

Abstract
The traditional diagnostic tests for tuberculosis consist of an acid fast stain and a culture test from a sputum sample. With the emergence of drug resistant strains of tuberculosis, nucleic acid amplification has become the diagnostic test of choice. The nucleic acid amplification test consists of four steps: sputum sample collection, lysis of bacilli to release DNA, DNA amplification by PCR and detection of PCR products. The DNA extraction step has been largely overlooked and this study describes a systematic approach to measure the kinetics of cell lysis in a Tris-EDTA buffer. Mycobacterium smegmatis is a saphorytic, fast-growing mycobacterium that is often used as a surrogate of Mycobacterium tuberculosis in laboratory studies. M. smegmatis cells have been transformed with green fluorescent protein (GFP) genes. Transformed cells are lysed in a temperature-controlled cuvette that is equipped with optical input/output. The fluorescence signal increases when the GFP is released from lysed cells, and the extent of lysis of the loaded cells can be followed in real time. The experimental results are complemented by two theoretical models. The first model is based on a Monte Carlo simulation of the lysis process and the accompanying probability density function as described by the Fokker-Planck equation. The second model follows a chemical reaction engineering approach: the cell wall is modeled as layers, where each layer is made up of ‘blocks’. Blocks can only be removed if they are exposed to the lysis solution and the model describes the rate of block exposure and removal. Both models are consistent with the experimental results. The main findings are: (1) the activation energy for M. smegmatis lysis by Tris-EDTA buffer is 22.1kcal/mole, (2) cells lyse on the average after 14–17% loss in cell wall thickness locally, (3) with the help of the models, the initial distribution in cell wall thickness of the population can be resolved, (4) near complete lysis of the cells is accomplished in 200 seconds at 80°C (90 seconds at 90°C). The results can be used to design an optimal lysis protocol that compromises between shorter processing times at higher temperature and reduced thermal damage to DNA at lower temperature.
Keywords: Kinetics, Lysis, Mycobacterium smegmatis, Mathematical Modeling, Molecular biology, Fokker-Planck
1. Introduction
The gold standards for diagnosis of tuberculosis and drug-resistance are Ziehl-Nielsen (acid-fast) stains and cultures. Although rapid culture systems (such as BACTEC) greatly reduce the 4–6 week waiting period for the slow-growing organism to form identifiable cultures, these systems are expensive and not practical in many of the high burden countries. Nucleic acid amplification tests (Su (2002), Tenover (2007), Daniel (1990)) and more specifically real-time PCR (Parashar et al., (2006)) has long been recognized as a promising diagnostic tool for mycobacterial infections and antimicrobial resistance. Daniel (1990) mentioned the need for “rapid, simple and inexpensive” diagnostic methods, and when discussing PCR wrote that PCR “offers exciting promise”, but also that “the technology is too complex for application in developing countries, but it has potential for simplification”. Though great strides have been made in the development of nucleic acid amplification tests, it still cannot compete with the traditional methods on the basis of cost and simplicity of use, especially in developing countries. A systematic approach is needed to analyze each one of the steps: sample preparation, lysis of cells, DNA extraction, PCR amplification of targets, and the detection of PCR products. In this study, the kinetics of cell lysis is investigated.
DNA extraction/isolation is a key (and yet often overlooked) step in the molecular diagnostic process, and contributes a great deal to the overall sensitivity of an assay. The ideal nucleic acid isolation protocol will be simple and safe to perform, require minimal handling, use readily available equipment and involve inexpensive reagents. The isolation protocol should kill viable organisms rendering the sample safe for further handling and efficiently release nucleic acid material for amplification, all while incurring minimal damage to the genetic material. One must also consider the practicality/feasibility of the process. Many of the so-called high burden countries are developing nations with limited resources and have constraints on the type of techniques that can be successfully integrated into routine lab work (Daniel, (1990)).
The development of a simple, effective lysis protocol hinges on a deeper understanding of the events occurring on a molecular level during chemical lysis. The bacterial cell wall is a complex, highly interlinked system of polymers that ensures the structural integrity of the cell and allows the maintenance of proper turgor pressure. In order to gain access to the genetic material, the highly-crosslinked peptidoglycan structure of the cell wall must be disrupted. When the wall is weakened beyond a certain point, it can no longer withstand the pressure inside the cell. The weakened cell will rupture, thereby releasing the cellular contents including the genetic material.
As summarized by Garg et al. (2003), a wide variety of lysis protocols have been described: “sonication, boiling, SDS with lysozyme and heat, proteinase K, chaotropic salts, etc.”. For example, sonication (combined with boiling and centrifugation) is the lysis method used in the FDA approved Gen-Probe Amplified Mycobacterium tuberculosis Direct Test (AMTD) (Miller et al. (1994)). Thomson et al. (2005) found that 20 minutes of boiling and a 5 minute incubation at 55°C with microLYSIS® (Microzone Ltd., Haywards Heath, West Sussex) resulted in similarly sensitive PCR assays for detection of mycobacterial DNA. Kocagöz et al. (1993) concluded that three centrifugation washes followed by resuspension and 10 minutes of boiling in Tris-EDTA (TE) buffer (pH 8.0), resulted in better PCR amplification of TB genomic DNA than a sample treated with lysozyme, proteinase K and SDS followed by phenol-chloroform extraction and ethanol precipitation. Kocagoz et al. (2005) later reported successfully using a similar protocol (boiling for 20 minutes instead of 10 minutes) to identify rifampin resistance in clinical isolates of TB using real-time PCR.
As stated by Kocagoz et al. (1993), the sample washes are necessary to remove proteins and salts produced during the decontamination step. Three washes effectively translate into three batches of supernatants that are discarded. However, Pathak et al. (2007) found that 1) supernatant of freshly processed samples (which is routinely discarded) contained mycobacterial DNA and 2) autolysis occurred during storage at low temperatures, leading to an increase in DNA in the supernatant; thus further highlighting the need for simplification of the lysis process, especially for patients with low bacterial loads and for analysis of stored samples.
In this work, the degree of lysis of M. smegmatis cells was measured as a function of time and temperature. Although there are important differences between M. smegmatis and M tuberculosis (Hett and Rubin, (2008)), M. smegmatis was chosen since it is a fast-growing nonpathogenic species particularly useful in studying basic cellular processes of relevance to pathogenic mycobacteria. The M. smegmatis strain was transformed with green fluorescent protein (GFP) and provided high and uniform amounts of GFP expression and fluorescence upon excitation. As the opaque cells lysed and the protein was released into the buffer solution, an increase in fluorescence was observed. The rate of increase in the measured fluorescence is an indication of rate of lysis of the bacterial cells.
The experimental results are presented here along with two theoretical models. The first model is based on a Monte Carlo simulation of the lysis process and the accompanying probability density function as described by the Fokker-Planck equation. The second model follows a chemical reaction engineering approach: the cell wall is modeled as layers, where each layer is made up of ‘blocks’. Blocks can only be removed if they are exposed to the lysis solution and the model describes the rate of block exposure and removal.
2. Materials and methods
2.1. Mycobacterium smegmatis
M. smegmatis was grown from stock mc2155 (high-efficiency plasmid transformation mutant of M. smegmatis mc26) (Snapper et al. (1990)). The mc2155 strain was transformed by electroporation with the Escherichia-Mycobacterium multi-copy 5.6 kb plasmid pBUN277. To construct plasmid pBUN277, a 1.4 kb fragment carrying the GFP gene under the control of the M. bovis BCG hsp60 promoter was amplified from plasmid pWES4 (Parker and Bermudez, 1997) using primer pairs pwes4for (5′ - GCA GCG AGG ACA ACT TGA G-3′) and pwes4rev (5′ - TTT CGA CTG AGC CTT TCG TT-3′). The amplified PCR fragment was ligated into vector pCR2.1, excised from this recombinant with HindIII, and cloned into the unique HindIII site of the E.coli-Mycobacterium shuttle plasmid pMV206-H that carries a hygromycin-resistant marker (George et al. 1995). The construct with GFP gene transcription opposite to the transcription of oriM open reading frames (ORFs) was defined as pBUN277. Plasmids of this type, derived from the Mycobacterium fortuitum plasmid pAL500, replicate with a low copy number in mycobacteria (Stolt and Stoker, 1996).
M. smegmatis strains were grown at 37°C in Middlebrook 7H9 base broth supplemented with 0.5% bovine serum albumin fraction V (EM Science, Gibbstown, N.J.), 0.01 M dextrose (Sigma Chemical Co., St. Louis, Mo.), 0.015 M sodium chloride and 0.2% glycerol (MADC) (as described by Chacon et al. (2002)). The cultures were prepared using 20 mL of MADC and 100μL of glycerol-preserved stock. Liquid cultures were typically grown for ~24 hours at 37°C in an Innova 4300 rotary incubator (New Brunswick Scientific Co. Inc., Edison, N.J.) with shaking at 200 rpm. The culture was centrifuged at 2000 rpm for 5 minutes at 4°C in a TJ-6 centrifuge (Beckman Instruments, Inc., Fullerton, Calif.). The MADC supernatant was removed. A final cell concentration of 6 × 10⁹ bacteria per mL was achieved by resuspension in sterile distilled water. Cell concentration was determined via optical density analysis using a Beckman DU-64 spectrophotometer at λ = 600 nm. This concentration, 6 × 10⁹ cells per mL, while very high, was useful in providing sufficient GFP signal.
2.2. Lysis
Twenty microliters of cell suspension was transferred to a micro-centrifuge tube, centrifuged, supernatant discarded and resuspended in 20μl of lysis medium. Five microliters of cells in lysis medium were immediately transferred to a 20μl LightCycler® capillary (Roche Applied Science, Indianapolis, IN) and subjected to analysis, to minimize the amount of premature lysis. The lysis media comprised different concentrations of TE buffer (pH 8.0, 1mM EDTA and 10mM Tris-HCl for 1X buffer). A 1 minute hold at ~37°C ensured that each sample was at uniform starting conditions. The samples were then rapidly heated to the lysis temperature (heating time for the sample core was between 3.7 sec and 8.9 sec depending on the lysis temperature). Trials were undertaken at 65, 70, 75, 80, 85, and 90°C.
Lysis was performed and tracked in a PCRJet® thermocycler (Megabase Research Products, Lincoln, NE). The sample was excited using a 470 nm blue LED (Model # LS-450, Ocean Optics, Dunedin, FL) emitting light at λ ~ 400–490 nm, with a BG3 deep blue Schott filter (Edmund Optics, Barrington, NJ). GFP emission was read with a CCD-based spectrometer (Model # USB-2000, Ocean Optics) at λ = 500–560 nm. As the cells were lysed, GFP within the opaque cell wall was released into the lysis medium, thus increasing the spectrometer readout. Lysis progression was monitored by recording the spectrometer counts of the GFP emission over time at various temperatures.
2.3. PCR amplification
Presence of M. smegmatis DNA was confirmed with PCR amplification of a 451bp rpoB gene target. Primers used were MS-rpoB-F2 5′ AGG TCG ACG ACA TCG ACC ACT TC 3′, and MS-rpoB-R2 5′ TAC GGC GTC TCG ATG AAG CCG AAC 3′. Amplification was performed in a PCRJet® thermocycler (Megabase Research Products, Lincoln, NE), with 0.2mM of each dNTP, 5mM MgSO4, 0.5U KOD Hot Start DNA Polymerase (Novagen, Madison, WI), 1X manufacturers buffer, 0.6μM of each primer, 10% (v/v) DMSO and 0.4mg/ml BSA. To each reaction either 5μl of lysis product (before and after 80°C lysis), or 1μl of extracted purified genomic DNA was added as template. Cycling consisted of a 30 sec hot start at 94°C, followed by 35 cycles of 2 sec denaturation at 94°C, 3 sec annealing at 60°C and 3 sec elongation at 72°C.
3. Results
3.1. GFP fluorescence measurements
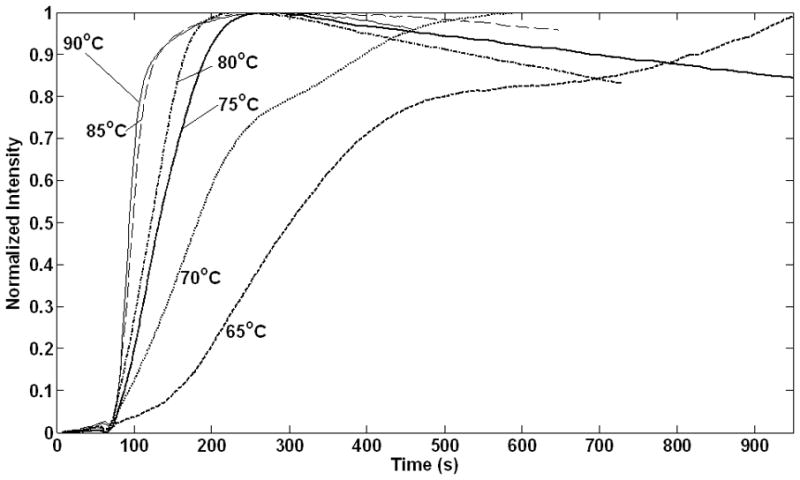
Results of the lysis experiments in 50X TE buffer, as described in Section 2.2, are shown in Figure 1 for temperatures between 65°C and 90°C. The rate of lysis increases with temperature and no appreciable cell lysis occurred below 60°C (data not shown). As the M. smegmatis cells lyse, GFP is released and the fluorescence signal increases and reaches a local maximum before it slowly decreases. A gradual decrease in intensity after the fluorescence maximum has been reached can be ascribed to the denaturing of GFP in the lysis solution.
Figure 1.
GFP fluorescence measurements over time at temperatures as indicated: ( ) 65°C; (
 ) 70°C; (
 ) 75°C; (
 ) 80°C; (
 ) 85°C; (
 ) 90°C. Fluorescence intensity measurements are normalized, each to their maximum value. The first 60sec of observations were at ~37°C, after which temperature is rapidly increased to the lysis temperature.
The GFP emission signals shown here have been normalized with respect to their maxima (original data files are available as Supplemental Material). Experimental variances made this normalization necessary. These variances include differences in the optical properties of the individual LightCycler® capillaries, precise positioning of the capillary within the optical detection system of the PCRJet® thermocycler and interference with the optical detection by the opaque M. smegmatis cells at the bottom of the capillary. Together, these deviations created up to a 20% difference in the background signal with an approximately proportional difference in the optical signal maximums. While there were differences in sample-to-sample optical signals, no significant difference was seen in either the average background signal or the average maximum emission signals while adjusting the lysis conditions.
The maxima for the plots between 75°C and 90°C lie very close. A subset of the cell population persists and more time is required to lyse these persisters at the lower temperatures. There is a further qualitative difference between the curves at 65°C and 70°C compared to the curves at higher temperatures. At 65°C and 70°C there is an initial steep rise in fluorescent output, followed by a near-plateau before a second steep increase occurs. A comparison between the curves at 65°C and 70°C shows a decrease in the plateau length at the higher temperature and it disappears at temperatures above 70°C. This is an indication that the starting cell population is not uniform.
3.2. PCR results
PCR amplification was used to confirm the DNA release from the M. smegmatis cells. Results of PCR amplification of a 451 bp fragment of the rpoB gene of M. smegmatis (as described in section 2.3) is shown in Figure 2. As a positive control, purified extracted DNA was used as template (Lane 2). Lane 3 shows amplification of the lysis solution before any thermal lysis treatment. As discussed in section 1, some DNA is expected in the solution from natural autolysis of the cells, resulting in a weakly positive result. Lane 4 shows amplification of the lysis solution after thermal treatment and shows a stronger positive result. These results are not quantitative however; further studies are underway to confirm these results with real-time quantitative PCR.
Figure 2.
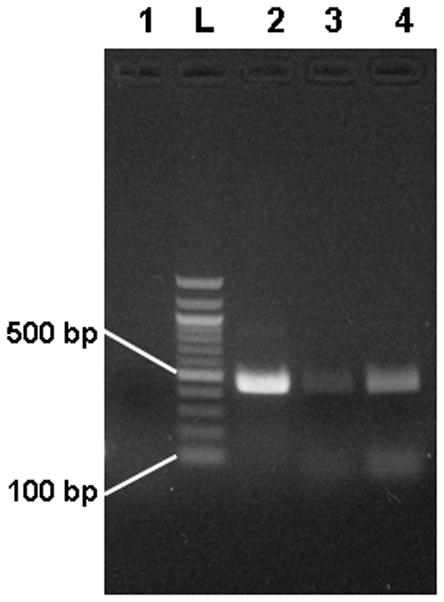
Gel electrophoresis results for amplification of lysed M. smegmatis cells. Lane 1 is a negative control (no template added), Lane 2 is a positive control (purified DNA as template), Lane 3 is amplification of pre-lysis M. smegmatis cells, and Lane 4 is amplification of post-lysis M. smegmatis cells.
3.3. Mathematical modeling
The M. smegmatis cell envelope structure includes a ~7nm plasma lipid bilayer membrane; two internal electron dense layers (~4 nm and ~8 nm respectively) separated by a thin electron-transparent layer and an ~8nm outer membrane consisting of acyl lipids, mycolic acids, and porins (Hoffman et al. (2008), Etienne et al. (2005)). The individual internal layer compositions are not yet fully understood (Hoffman et al. (2008)), but they consist of peptidoglycan, arabinogalactan, and mycolate. The glycolipid, lipoarabinomannan, spans much of the cell envelope (Brennan and Nikaido (1995)). Since the precise structure and the physical and chemical properties of each individual layer is unknown, the cell wall envelope will be modeled as a pseudo-homogeneous structure with properties that are an average of the properties of each individual component. When such information becomes available, the models are amenable to these complexities.
A schematic of a section of the cell wall used for the model is shown in Figure 3. The cell wall in the model is divided into layers, labeled from 1 at the outer membrane to M at the cytoplasmic membrane. Based on cryo-electron micrographs of cross sections of cells of M. smegmatis, the cell wall thickness (including both membranes, periplasmic layers, and periplasmic space) is estimated to have an average thickness of approximately 35 nm, see supplemental table II in Hoffman et al. (2008). If M = 35, then each layer is 1nm in thickness. Every layer is discretized into N blocks. Changes in the volume of blocks in inner layers compared to the outer layers, due to curvature at the poles, are neglected. Based on measurements for M. smegmatis cells (Greendyke et al. (2002), Dziadek et al. (2003)), the average surface is estimated at 3 μm2. If N is set equal to 3×10⁶, then the blocks are approximately cube shaped with 1 nm3 volumes.
Figure 3.
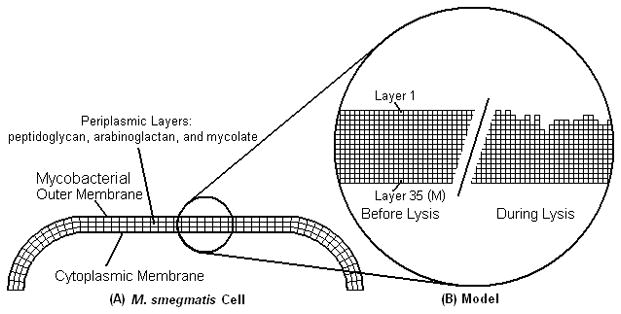
Two-dimensional cell envelope schematic. (A) M. smegmatis envelope with outer membranes and periplasmic structures. (B) Model of the cell wall has uniform properties and a fine mesh for calculations. The mesh is shown before lysis and during lysis with some of the blocks removed. Note: for clarity, not all of the 35 layers are displayed.
Progressive chemical lysis from the outside of the cell surface due to the lysis buffer will be modeled. Although autolysins also contribute to cell lysis under physiological conditions, our experiments were carried out at temperatures well above temperatures at which autolysins would normally function. Therefore, autoysis should not adversely distort the lysis data. Autolysins target mostly older cell wall material (Pooley (1976)). Newly synthesized wall material is deposited underneath the inner surface of the older cell wall (Blümel et al. (1979)). The picture that emerges from these observations is that autolytic activity is focused on the outer layers of the cell wall.
3.3.1 Monte Carlo method
The Monte Carlo method simulates the lysis of a single cell over time by randomly removing blocks which are exposed. A block bij can be uniquely identified by the layer j it belongs to (1 ≤ j ≤ M) and its position in that layer by an index i (where 1 ≤ i ≤ N). Only blocks with exposed faces are accessible to the lysing reagent. In 3-D models, the number of free faces of block bij, denoted by σij, can vary between 0 and 5. In 2-D models, 0 ≤ σij ≤ 3. If σij = 0, then block bij is either removed or it is still fully covered by other blocks. A Monte Carlo experiment consists of a large number of lysis events; each lysis event constitutes the removal of one block. At the onset of the nth lysis event in the Monte Carlo experiment, the total number of exposed faces is calculated:
An exposed face is randomly selected from the pool of all exposed faces. Since an exposed face is uniquely associated with a block, that block is removed from the cell wall structure and the new set of exposed faces is calculated. Obviously blocks with a larger number of exposed faces are statistically favored for selection.
We assume that the initial number of free faces S(1) = N, i.e. a smooth starting cell surface. The mc2155 M. smegmatis strain has a smooth surface; however, other M. smegmatis strains have a rough surface (Etienne et al (2005)). As the Monte Carlo simulation progresses, the cell surface becomes increasingly irregular. Thus, the number of exposed faces increases from S(1) = N until a quasi-steady state is reached. Only when blocks adjacent to the cytoplasm are removed (an unrealistic situation since cell rupture would occur prior to this), does S decrease. In Figure 4, the number of exposed edges S(n) is plotted as a function of the lysis events n for a two-dimensional Monte Carlo experiment with N × M = 3500×35. At the onset, S(1) = 3500 and S reaches the quasi-steady state value of 8000 within 20 000 lysis events. The rapid drop-off in S for n>100 000 is a result of blocks that are removed from the final layer. Interestingly, the average number of free edges/block during the quasi-steady state period is approximately 2.3.
Figure 4.
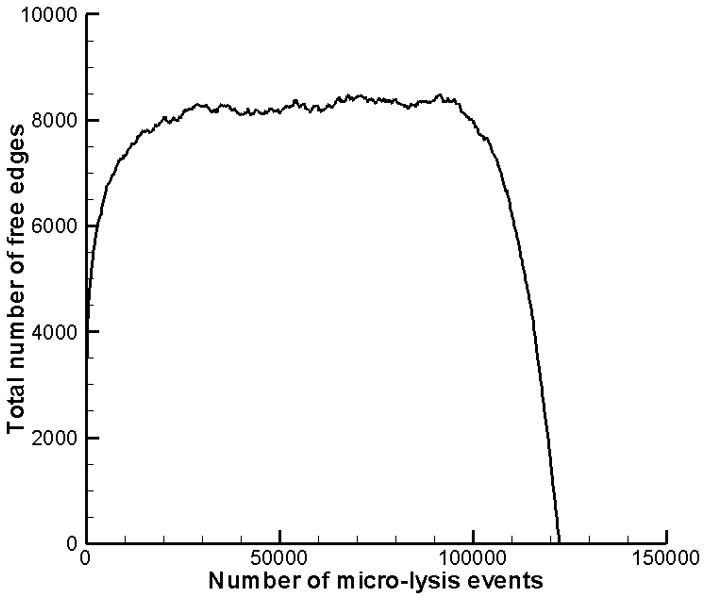
Number of free edges in a two-dimensional Monte Carlo simulation of the lysis of a cell wall that initially has 3500 free edges and consists of 35 layers.
If the Monte Carlo experiment is repeated a large number of times, then the evolution (in terms of n) of the probability density function (pdf), denoted as F (n, m), can be calculated. The pdf F (n, m) is defined as the probability to have an exposed face in layer m at the onset of the nth lysis event. During the initial transient period where S(n) increases, the pdf is not described by a binomial distribution because the probability, given by 1/S(n), changes from one lysis event to the next. The pdf is given by a binomial distribution when S is close to or at the quasi-steady state value S = Sqs. The value of the Monte Carlo experiment with N × M = 3500×35is to show that the quasi steady state is established quickly. Furthermore, the binomial distribution is well approximated by a normal distribution for large n; therefore, the pdf becomes:
| (1) |
In Figure 5 the distribution of exposed faces (F (n, m)) for the two-dimensional case N × M = 3500×35, is plotted as a function of position in the cell wall at intervals of 5000 lysis events. Layers are numbered from 1 at the outer surface to 35 at the inner surface of the cell wall, as described above. The pdf is calculated by repeating the Monte Carlo experiment 100 000 times and averaging the results; it evolves from a delta function at m=1 to a binomial shape.
Figure 5.
Progression of the pdf (not normalized) through cell wall layers, generated by the Monte Carlo method for a two-dimensional model that measures NxM=3500×35.
The Monte Carlo method is computationally expensive, but it has one advantage: the method easily accommodates changes in probability, i.e. changes in the number of exposed faces. The calculation of the realistic three-dimensional case N×M = 3 000 000×35is prohibitively expensive. A strong argument can be made for the use of the Fokker-Planck model, which describes the evolution of the pdf through the layers.
3.3.2 Fokker-Planck model
The evolution of the normalized pdf as a function of time, on the domain 0 ≤ x ≤ M can be calculated directly from the Fokker-Planck equation:
| (2) |
The function f (t, x) in eq (2) is analogous to F (n, m) in eq (1). The velocity V changes until a quasi-steady state in the number of exposed faces is reached. However, the results of the Monte Carlo method show that the change is small and D = V ≈ Vqs = k */Sqs can be used. The rate constant k* is assigned to the number of lysis events per second, thence n = k*t. The solution that corresponds to an initial condition of f (0, x) = δ0is
| (3) |
where k = k*/Sqs and x = 0corresponds to the first layer m=1. Also note that there exists a direct relationship between n and t as well as between m and x, thus F (n, m) and f (t, x) holds equivalence.
To obtain a general solution, the initial condition f (x,0) = Nδ0 must be changed to include cells that are partially lysed. Let the initial state be given by f (x,0) = g(x), then the solution of eq.(2) is given by:
| (4) |
To illustrate the effect of a distributed initial state, the following idealized two-peak distribution is used in eq.(4):
| (5) |
Thus 50% of the cells have wall thickness M and 50% of the cells have wall thickness M−15. The distribution evolves from the initial two peaks to two normal distributions that overlap slightly at Vqst = kt/Sqs = 4, shown in Figure 6(a). At the later time Vqst = 10 (Figure 6(b)) the overlap increases and the combined curve is shown in blue.
Figure 6.

The progression of pdf f (x,t) for initial data given by eq.(5). Shown at (A) Vqst=500 and (B) Vqst=1000. () represents the δ0 population, and () represents the δ15 population at the indicated points in time. () in (B) represents the combined population.
Turgor will cause the cell wall to rupture when a critical layer m = mcrit is exposed. The critical layer is determined by fitting the theoretical models to the experimental results, see section 3.4). Suppose the pdf with initial data (5) has mcrit = 20 as the critical layer. The fraction of the cell population that has lysed as a function of time is given by the cumulative distribution:
| (6) |
In Figure 7 the cumulative distribution P(t) is shown. Note the qualitative similarity between the curve in Figure 7 and the experimental curves at 65°C and 70°C in Figure 1. It is the extent of separation between peaks that determine the extent of the plateau-like region in the curve. The overlap between peaks depends on the dispersion of the pdf; in the case of the experimental curves the dispersion depends on the rate constant k and hence on the temperature. At higher temperatures the separate peaks of a multimodal initial distribution spread out faster and the multi-peak character is lost much sooner than at lower temperatures – this explains the differences between the experimental curves at lower temperature (observable plateaus) and higher temperature (no observable plateaus).
Figure 7.
The cumulative distribution P(t) for a case where x=20 and equation (7) describes the initial population.
The initial data g(s) in eq.(4) can be adjusted to fit the experimental data. Suppose the cell population is distributed evenly over the first four layers and the critical layer is mcrit = 6. The expected outcome is that the 25% of cells that occupy layer m = 4will lyse first, followed by the cells in layer 3 and so forth. If the initial distribution occupies only a few layers adjacent to mcrit, the GFP is released sooner and the lysis curve shifts toward shorter times, compared to an initial distribution that occupies more layers. The position of the inflection point in the lysis curve shifts right on the time axis if a larger fraction of cells is assigned to the outmost layer (furthest from mcrit). If the layers adjacent to mcrit is more occupied, then the lysis curve may have no inflection point at all and the second derivative remains negative. Superimposed on the curvature is the effect of the rate constant. Larger (smaller) rate constants effectively shortens (lengthens) the time scale.
In Figure 8 the theoretical result (6) has been fitted to the experimental lysis curve for the 50X TE lysis buffer at 70°C. The dotted and dashed curves present initial data that correspond to even distributions over 4 and 6 layers adjacent to mcrit = 6 respectively. The initial distributions, denotes as g4 and g6 respectively, are:
Figure 8.
Results of the Fokker-Planck model with initial data of 6 evenly distributed layers () and 4 evenly distributed layers () of exposed faces adjacent to mcrit. The experimental result for 70°C is also shown (). The best fit is obtained for k = 0.0204 s−1. Note: the 4-layer model is shifted to the left compared to the 6-layer model.
In both cases the curvature does not match the experimental curve – in section 3.4 the number fraction that is assigned to each layer is adjusted to correct for this. However, the 6-layer model matches the experimental results better than the 4-layer model. (Although the results are not shown, other layers have also been compared.) The 4-layer model will exhibit faster kinetics than the 6-layer model, because fewer layers need to be removed before lysis and this result is confirmed by a comparison of the dot curve (4-layer model) and dash curve (6-layer model) in Figure 8. The 6-layer model fits the experimental data best for k = 0.0204s−1. The best fitted results at the other temperatures are k = 0.0584s−1 at 80°C and k = 0.1213s−1 at 90°C.
3.3.3 Multi-layer model
The multi-layer model is introduced to offer an alternative and independent method to determine the rate constants and initial data. The model is also more intuitive to engineers. The cell wall is again modeled as M consecutive layers and each layer consists of N blocks. The layers are labeled as before, from 1 at the outer membrane to mcrit, the critical layer where cell wall failure occurs. Although there may be some variability in mcrit, it is assumed in this study that mcrit is constant. The value of mcrit is determined by fitting the models to the experimental results – described in section 3.4.
As already mentioned, the initial data depend on the variation in cell wall synthesis rates, variations in the autolysis activity from one cell to the other and the cessation of peptidoglycan synthesis in dead cells. If the sum of exposed blocks in the jth layer of all C cells in the sample is denoted by , then the average number of exposed blocks in the jth layer, expressed as a fraction is . The initial distribution is g={A1 (0), A2 (0),…Amcrit (0)}. Note that only layers at and above the critical layer are considered.
The blocks with exposed faces react with the lysing reagent. In the multi-layer model we do not distinguish between blocks with different number of exposed faces. A balance over the outer layer gives:
| (7) |
The balancing equation for consecutive layers has the general form:
| (8) |
Note that removal of blocks in the layer j−1 exposes blocks in the jth layer. For the initial distribution g={A1(0), A2(0),…Amcrit (0)}, the solution for the jth layer is:
| (9) |
The extent of lysis is then given by the number of blocks with exposed faces which have been removed from the critical layer (after normalizing by N):
| (10) |
In Figure 9 the multi-layer model (10) with initial data Aj (0) = 1/6, for 1 ≤ j ≤ 6 is compared to the experimental results at 70°C for the 50X TE buffer. The best fit of k = 0.0205s−1 was obtained for the 6-layer model. The best fitted results at the other temperatures are k = 0.0577s−1 at 80°C and k = 0.1218s−1 at 90°C.
Figure 9.
A comparison of the multi-layer model result () with initial data that corresponds to an even distribution over 6 layers and the experimental curve () at 70°C. The best fit is obtained for k = 0.0205 s−1.
3.4. Discussion of results
The best-fit values for k at all three temperatures for the multi-layer model match the best-fit results of the Fokker-Planck model closely (cf. eqns.(4,6) and eqns.(9,10)). This result is not surprising since the multilayer model and the Fokker-Planck (and therefore the Monte Carlo model) are orthogonal approaches with similar outcomes (ergodic theorem); the average lysis progression as given by a pdf that is obtained by repeated Monte Carlo experiments on a single cell is expected to be the same as the pdf obtained by averaging over many cells simultaneously. In Table 1 the rate constants are listed for the models.
An Arrhenius plot of the rate constants is shown in Figure 10. The activation energy is estimated to be 22.1 kcal/mole. Unfortunately the temperature span that can be investigated is limited, but it is informative that the lysis reaction with the TE buffer slows down dramatically at lower temperatures. For example, at 50°C the rate constant is k = 0.0028s−1, which is nearly ten times less than at 70°C.
Figure 10.
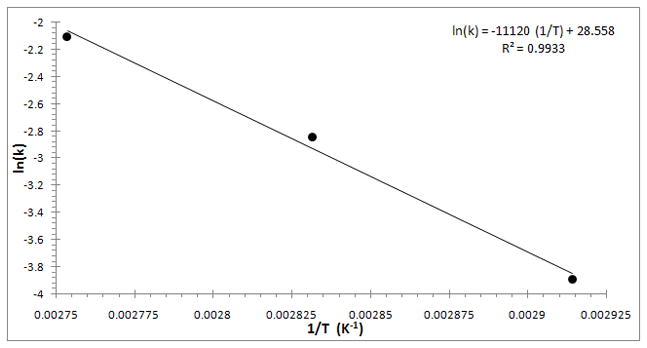
Arrhenius plot of average rate constants from Table 1. The activation energy is estimated to be 22.1 kcal/mole.
It is possible, by adjusting the initial distribution of cells that occupy the different layers, to closely match the experimental and theoretical results. The best fit to the experimental results at 70°C was obtained for mcrit = 5 and
| (11) |
An mcrit of 5 translates into ~15% of the cell wall that is lysed before cell rupture. As a rough comparison, a mycolic-acid deficient mutant of Corynebacterium glutamicum that has a 6.4 nm (~16%) decreased wall thickness is a lethal mutation in M. smegmatis (Hoffman et al. (2008)). Note: the analysis for 70°C is shown here, but analysis of all of the experimental results shown in Figure 1 resulted in values of mcrit corresponding to 14–17% of cell wall.
The best-fit value of the rate constant remained unchanged; k =0.020529 s−1. The results of the model using values given in eq (11), are shown in Figure 11. The agreement between the experimental results and the theoretical model is excellent. If the initial data are adjusted for higher temperatures, then the best-fit results differ slightly from the initial data obtained at 70°C, as in eq.(11). There may be several explanations for these differences, but one contributing factor is the difference in heat-up time to the operating temperature of the cuvette and small differences in the handling times of the cells/lysing buffer samples prior to heat-up.
Figure 11.
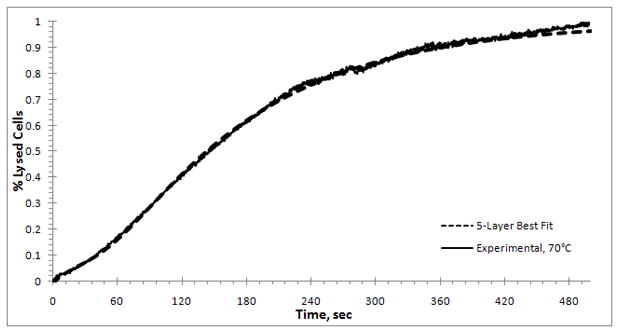
Improved fit of the multilayer model () to experimental data at 70°C () by adjusting the initial composition of the cell layers. The composition used here is: 78% have 5 layers to break, 9% have 3 layers to break, 7% have 2 layers to break, and 6% have one layer to break for lysis to occur.
4. Conclusions
The kinetics of the lysis reaction of M. smegmatis has been measured by the fluorescence of GFP that is released from lysed cells. A Monte Carlo has first been used to model the lysis reaction. Average behavior was obtained by multiple repeats of the Monte Carlo experiment, but the approach is too time-consuming to model the more realistic three-dimensional cases. Instead the Fokker-Planck equation, which describes the evolution of the pdf, has been solved and the solution has been fitted to the experimental data. The solution of the multi-layer model has also been fitted to the experimental results and the rate constants from data-fitting, at different temperatures for the two models are very close. The rate constants have been used to calculate the activation energy for the reaction. Treating the initial data as unknown, the critical layer and initial state of lysis could be determined. The following conclusions can be made from this study:
The activation energy for the lysis of M. smegmatis by TE buffer is 22.1 kcal/mole for a TE buffer strength of 50X.
Based on fitted data, a typical cell lyses when its wall thickness is reduced at any position by more than 14 – 17% (estimated to be 5 to 6 nm for a thickness of 35 nm).
The models enable users to solve for the initial state of the cell wall – the initial state depends on the time the cells spend outside the culture medium, the temperature and the natural variation in cell wall synthesis and autolysis.
Near complete lysis is accomplished in 90 seconds to 200 seconds at lysis temperatures of 80°C and 90°C respectively.
This study provides valuable insight for the development of a rapid, simple lysis procedure for M. tuberculosis clinical samples to be tested via nucleic acid amplification tests.
Supplementary Material
Acknowledgments
Portions of this work were supported by Animal Health Project NEB-14-141 (RGB, OC). We thank Drs. C. Barry and L.E. Bermudez for plasmids pMV206-H and pWES4, respectively. We thank D.K. Zinniel for assistance in transformation experiments and N.B. Harris for the construction of pBUN277.
References
- Blümel P, Uecker W, Giesbrecht P. Zero order kinetics of cell wall turnover in Staphylococcus aureus. Archives of Microbiology. 1979;121:103–110. doi: 10.1007/BF00689972. [DOI] [PubMed] [Google Scholar]
- Brennan PJ, Nikaido H. The envelope of mycobacteria. Annu Rev Biochem. 1995;64:29–63. doi: 10.1146/annurev.bi.64.070195.000333. [DOI] [PubMed] [Google Scholar]
- Chacon O, Feng Z, Harris NB, Caceres NE, Adams LG, Barletta RG. Mycobacterium smegmatis D-alanine racemase mutants are not dependent on D-alanine for growth. Antimicrob Agents Chemother. 2002;46:47–54. doi: 10.1128/AAC.46.1.47-54.2002. [DOI] [PMC free article] [PubMed] [Google Scholar]
- Daniel TM. The rapid diagnosis of tuberculosis: A selective review. J Lab Clin Med. 1990;116:277–282. [PubMed] [Google Scholar]
- Dziadek J, Rutherford SA, Madiraju MV, Atkinson MA, Rajagopalan M. Conditional expression of mycobacterium smegmatis ftsZ, an essential cell division gene. Microbiology. 2003;149:1593–1603. doi: 10.1099/mic.0.26023-0. [DOI] [PubMed] [Google Scholar]
- Etienne G, Laval F, Villeneuve C, Dinadayala P, Abouwarda A, Zerbib D, Galamba A, Daffé M. The cell envelope structure and properties of mycobacterium smegmatis mc(2)155: Is there a clue for the unique transformability of the strain? Microbiology. 2005;151:2075–2086. doi: 10.1099/mic.0.27869-0. [DOI] [PubMed] [Google Scholar]
- Garg SK, Tiwari RP, Tiwari D, Singh R, Malhotra D, Ramnani VK, Prasad GB, Chandra R, Fraziano M, Colizzi V, et al. Diagnosis of tuberculosis: Available technologies, limitations, and possibilities. J Clin Lab Anal. 2003;17:155–163. doi: 10.1002/jcla.10086. [DOI] [PMC free article] [PubMed] [Google Scholar]
- George KM, Yuan Y, Sherman DR, Barry CE., 3rd The biosynthesis of cyclopropanated mycolic acids in mycobacterium tuberculosis. identification and functional analysis of CMAS-2. J Biol Chem. 1995;270:27292–27298. doi: 10.1074/jbc.270.45.27292. [DOI] [PubMed] [Google Scholar]
- Greendyke R, Rajagopalan M, Parish T, Madiraju MV. Conditional expression of mycobacterium smegmatis dnaA, an essential DNA replication gene. Microbiology. 2002;148:3887–3900. doi: 10.1099/00221287-148-12-3887. [DOI] [PubMed] [Google Scholar]
- Hett EC, Rubin EJ. Bacterial growth and cell division: A mycobacterial perspective. Microbiol Mol Biol Rev. 2008;72:126–56. doi: 10.1128/MMBR.00028-07. [DOI] [PMC free article] [PubMed] [Google Scholar]
- Hoffmann C, Leis A, Niederweis M, Plitzko JM, Engelhardt H. Disclosure of the mycobacterial outer membrane: Cryo-electron tomography and vitreous sections reveal the lipid bilayer structure. Proc Natl Acad Sci U S A. 2008;105:3963–3967. doi: 10.1073/pnas.0709530105. [DOI] [PMC free article] [PubMed] [Google Scholar]
- Kocagoz T, Saribas Z, Alp A. Rapid determination of rifampin resistance in clinical isolates of mycobacterium tuberculosis by real-time PCR. J Clin Microbiol. 2005;43:6015–6019. doi: 10.1128/JCM.43.12.6015-6019.2005. [DOI] [PMC free article] [PubMed] [Google Scholar]
- Kocagoz T, Yilmaz E, Ozkara S, Kocagoz S, Hayran M, Sachedeva M, Chambers HF. Detection of mycobacterium tuberculosis in sputum samples by polymerase chain reaction using a simplified procedure. J Clin Microbiol. 1993;31:1435–1438. doi: 10.1128/jcm.31.6.1435-1438.1993. [DOI] [PMC free article] [PubMed] [Google Scholar]
- Miller N, Hernandez SG, Cleary TJ. Evaluation of gen-probe amplified mycobacterium tuberculosis direct test and PCR for direct detection of mycobacterium tuberculosis in clinical specimens. J Clin Microbiol. 1994;32:393–397. doi: 10.1128/jcm.32.2.393-397.1994. [DOI] [PMC free article] [PubMed] [Google Scholar]
- Parashar D, Chauhan DS, Sharma VD, Katoch VM. Applications of real-time PCR technology to mycobacterial research. Indian J Med Res. 2006;124:385–398. [PubMed] [Google Scholar]
- Parker AE, Bermudez LE. Expression of the green fluorescent protein (GFP) in mycobacterium avium as a tool to study the interaction between mycobacteria and host cells. Microb Pathog. 1997;22:193–198. doi: 10.1006/mpat.1996.0106. [DOI] [PubMed] [Google Scholar]
- Pathak D, Chakravorty S, Hanif M, Tyagi JS. Lysis of tubercle bacilli in fresh and stored sputum specimens: Implications for diagnosing tuberculosis in stored and paucibacillary specimens by PCR. BMC Microbiol. 2007;7:83–92. doi: 10.1186/1471-2180-7-83. [DOI] [PMC free article] [PubMed] [Google Scholar]
- Pooley HM. Turnover and spreading of old wall during surface growth of Bacillus subtilis. J Bacteriol. 1976;125:1127–1138. doi: 10.1128/jb.125.3.1127-1138.1976. [DOI] [PMC free article] [PubMed] [Google Scholar]
- Snapper SB, Melton RE, Mustafa S, Kieser T, Jacobs WR., Jr Isolation and characterization of efficient plasmid transformation mutants of mycobacterium smegmatis. Mol Microbiol. 1990;4:1911–1919. doi: 10.1111/j.1365-2958.1990.tb02040.x. [DOI] [PubMed] [Google Scholar]
- Stolt P, Stoker NG. Functional definition of regions necessary for replication and incompatibility in the mycobacterium fortuitum plasmid pAL5000. Microbiology. 1996;142 (Pt 10):2795–2802. doi: 10.1099/13500872-142-10-2795. [DOI] [PubMed] [Google Scholar]
- Su WJ. Recent advances in the molecular diagnosis of tuberculosis. J Microbiol Immunol Infect. 2002;35:209–214. [PubMed] [Google Scholar]
- Tenover FC. Rapid detection and identification of bacterial pathogens using novel molecular technologies: Infection control and beyond. Clin Infect Dis. 2007;44:418–423. doi: 10.1086/510684. [DOI] [PubMed] [Google Scholar]
- Thomson LM, Traore H, Yesilkaya H, Doig C, Steingrimsdottir H, Garcia L, Forbes KJ. An extremely rapid and simple DNA-release method for detection of M. tuberculosis from clinical specimens. J Microbiol Methods. 2005;63:95–98. doi: 10.1016/j.mimet.2005.03.005. [DOI] [PubMed] [Google Scholar]
Associated Data
This section collects any data citations, data availability statements, or supplementary materials included in this article.