

Abstract
A new portable instrument has been developed that offers rapid detection of ozone at the ppb level for personal exposure monitoring. The Personal Ozone Monitor is based on the EPA Federal Reference Method of UV absorbance and has the advantage of being small (10 × 7.6 × 3.8 cm), light-weight (0.3 kg), low power (2.9 watts), and battery-operated. The instrument can be worn by an individual during normal daily activities because it is unaffected by humidity, physical orientation, temperature, and vibration. In order to eliminate any significant interference from water vapor, Nafion® tubing was installed before the detection cell, and the optical path was lined with quartz. A precision of 1.5 ppbv and limit of detection of 4.5 ppbv (S/N = 3) was demonstrated with the instrument making measurements every 10 seconds.
INTRODUCTION
As an air pollutant, a major concern with ozone is its effect on human health. Because of its potent oxidizing capacity, ozone is extremely irritating to the respiratory system. Being less soluble than other irritant gases, ozone can penetrate effectively into the deep lung, causing injury to resident lung cells and triggering an influx of inflammatory cells.1,2 It has been shown that exposure to ozone reduces lung function and aggravates preexisting respiratory disease such as asthma.3–8 Emergency department visits, daily hospital admissions, and mortality increase during episodes of high ambient ozone concentration.9–12 The severity of respiratory effects produced by ozone exposure depends on several factors, including ozone concentration and exposure time, local meteorology, individual sensitivity, preexisting respiratory disease, age, and socioeconomic status.3,7,12–14
The EPA has developed a computer-based model for estimating ozone exposures likely to occur in urban populations. This Air Pollution Exposure Model (APEX) simulates typical activities and breathing rates of individuals moving through a comprehensive set of defined microenvironments and geographical locations. For each activity, APEX determines ozone exposure using ambient monitoring data and applicable micro-environmental adjustment factors. However, the APEX model requires validation, which would best be achieved using personal monitoring data obtained for a large number of individuals engaged in typical daily activities. There is a great need for a personal ozone monitor (POM) to carry out such studies. Ideally, a POM would be portable enough for an individual to wear, immune to potential interferences present in a person’s daily routine, and provide real-time measurements for high temporal resolution. The accuracy needs to be ≤2 ppbv, the detection limit ≤ 5 ppbv, and the response time relatively fast (~1–60 s) for exposure levels to be determined with adequate spatial resolution.
Numerous instruments have been developed in the past for measurements of ambient ozone based on a variety of chemiluminescent, electrochemical, semiconductor, and photometry techniques. Gas phase chemiluminescence instruments, which measure the intensity of light generated by chemical reaction with a reagent, require a vacuum pump, photomultiplier tube, and reagent gas source. Weight and power requirements make these instruments not amenable to personal exposure monitoring. Gas-solid chemiluminescence detectors are inherently sensitive and fast; however, they are sensitive to variations in humidity and require frequent calibration as reagent dye is consumed.15 Electrochemical ozone sensors, which measure the current produced by the chemical oxidation or reduction of the analyte, are inexpensive, lightweight, and portable; however, commercial electrochemical sensors lack the sensitivity required for personal monitoring with typical detection limits of ~10 ppbv. Electrochemical sensors are also not selective for ozone and will produce a response for other oxidizing gases. Heated metal oxide semiconductor (HMOS) sensors are widely used for industrial monitoring of high ozone concentrations with response times of less than a minute.16,17 These sensors use a thin film of a metal oxide (e.g., indium oxide) that is heated to ≈200 °C, and the resistance of the film varies with ozone concentration. HMOS sensors are limited by a highly non-linear response, low precision with typical resolution of 10 ppbv, interference from humidity changes, and typical accuracy of 10–20%. In addition, exposure to high levels of VOCs quenches their response to ozone, which recovers over a period of several hours as the organics “burn off” the heated sensor surface.
UV absorbance is the most widely accepted method for monitoring of atmospheric ozone and the method used almost exclusively by the U.S. EPA and environmental agencies internationally. Ozone has a strong absorbance in the near UV where there are very few atmospheric interferences and has a strong absorption cross section that peaks almost exactly at the 254-nm emission line of a low pressure Hg lamp.18 UV absorbance is an ideal method for this application because it is an absolute method requiring infrequent calibration checks, has a fast response time of 10 s, has high precision of 1–2 ppbv (10 s readings), and is much more selective than competing methods.
We have developed a small personal ozone monitor based on the method of UV absorbance. The instrument results from further miniaturization of the 2B Technologies Model 202 Ozone Monitor, which has been successfully tested as a personal exposure monitor.19 In that work, the ozone monitors were carried by test subjects in a backpack and the instrument response was found to be independent of instrument orientation, vibration, and rapid temperature change. The instrument was successfully used in a scripted 10-hour personal routine including five ten-minute events every hour and the data was used to evaluate the APEX model in predicting ozone exposures. The POM represents a significant reduction in size and weight of the Model 202 (3x smaller volume, 7x lighter), making it ideal for personal ozone monitoring.
EXPERIMENTAL SECTION
Theory
Figure 1 is a schematic diagram of a single-beam personal ozone monitor. Ozone is measured based on the attenuation of light passing through an absorption cell fitted with quartz windows. A low-pressure mercury lamp is located on one side of the absorption cell, and a photodiode is located on the opposite side of the absorption cell. The photodiode has a built-in interference filter centered on 254 nm, the principal wavelength of light emitted by the mercury lamp. An air pump draws sample air into the instrument at a flow rate of approximately 1 L/min. A solenoid valve switches every 5 s to alternately send this air directly into the absorption cell or through an ozone scrubber and then into the absorption cell. The intensity of light at the photodiode is measured in air that has passed through the ozone scrubber (Io) and air that has bypassed the scrubber (I). Ozone concentration is calculated from the measurements of Io and I according to the Beer-Lambert Law:
| (1) |
where l is the path length (15 cm) and σ is the absorption cross section for ozone at 254 nm (1.15 × 10⁻¹⁷ cm2 molecule−1).20 A complete measurement cycle is completed every 10 seconds. Instruments are calibrated against a NIST-traceable ozone standard and small calibration factors are applied, to take into account such effects as ozone loss to surfaces within the instrument, incomplete ozone destruction by the ozone scrubber, and nonlinearities in the electronics used to measure the light intensity. Typically, ozone scrubbers are replaced and the instruments recalibrated annually.
FIGURE 1.

Schematic diagram of a single-beam ozone monitor based on UV absorbance.
The Beer-Lambert Law (Eqn. 1) provides a measurement of ozone in concentration units of molecules/cm3. Measurements of temperature (T, K) and pressure (P, atm) are made in order convert the ozone concentration to a “mixing ratio” in parts-per-billion by volume using Eqn. 2,
| (2) |
where R is the gas constant in appropriate units (82.05 cm3 atm K−1 mol−1) and NA is Avogadro’s number.
Additional selectivity is achieved by use of an ozone scrubber that catalytically converts ozone to oxygen while passing other UV-absorbing species. If a UV-absorbing compound is present during both I and Io measurements, then it will not interfere with the measurement of ozone. Water vapor does not absorb at 254 nm; however, it does cause interference in most ozone monitors as a result of a refractive index effect.21 The ozone scrubber has a high surface area that adsorbs water molecules. When equilibrated with the humidity of ambient air, the scrubber neither increases nor decreases the concentration of water vapor molecules. However, if there is a sudden change in humidity, the scrubber will either take up or release adsorbed water to the ozone-scrubbed air stream. This results in a difference in water vapor concentration in the detection cell during I (air) and Io (ozone-scrubbed air) measurements. The humidity has an effect since all ozone monitors use uncollimated light, where most of the light reaching the detector has reflected from the interior surface of the detection cell, and the reflectivity of the cell surface is affected by adsorbed water molecules due to a change in refractive index. The water vapor interference is eliminated by use of Nafion® tubing inserted between the tee where the ozone scrubber and bypass flows converge and the entrance to the detection cell. Nafion® is both inert toward ozone and extremely permeable to water, which allows it to equilibrate the humidity of the scrubbed and unscrubbed gas with the surrounding air. Thus, use of a Nafion® tube assures that the humidity entering the detection cell is constant, thereby eliminating the effect of humidity change on the absorbance measurement of ozone.
RESULTS AND DISCUSSION
Development of the pocket-sized POM required a number of miniaturized components. A schematic diagram of the POM is shown in Fig. 1. The sample is drawn into the instrument and the flow path is split, with one path scrubbed by Hopcalite to remove ozone from the sample. A solenoid valve (Hargraves, 75M) alternately switches between the two flow paths, modulating the gas going to the detection cell between scrubbed and unscrubbed air. Nafion® tubing (Perma Pure, ME-070-03-45) is used after the valve to equilibrate the humidity of the air from both flow paths to ambient humidity. Maintaining a relatively constant humidity between the scrubbed and unscrubbed air significantly reduces a large humidity interference that arises from the effect of adsorbed water vapor on the transmission of non-collimated light through the absorbance cell. The gas flow then passes through the cell, where a mercury vapor lamp and a photodiode (Hamamatsu, S2684-254) are used to measure the absorbance at 254 nm.
Since a UV absorbance instrument for ozone measurement has never been built on this size scale, several miniature components needed to be evaluated for size, weight and power consumption.
UV Light Sources
Low pressure Hg lamps are almost universally used as light sources in ozone monitors. Three different Hg lamps were identified to be evaluated for the POM. Lamps were installed in a commercial ozone monitor (2B Technologies, Model 202) equipped with the standard 15 cm pathlength cell. Measurements of the “electronic zero” were made without flowing air through the cell, thereby providing a measure of the noise produced by the lamp, photodiode, and electronics only. Of the lamps tested, a small lamp (JKL Components, BF840-UVC), with dimensions of 0.8 cm diameter and 4 cm long, was found to have the lowest ten point standard deviation and lowest power consumption, and was chosen for use in the POM. A UV LED (Seoul Optodevice, T9B25C) emitting at 255 nm also was tested as a light source but found to have a noise level approximately 100 times too large for this application.
Air Pumps
Three diaphragm pumps and two fans were tested for their ability to produce adequate flow (>600 ccm) to thoroughly purge the cell between scrubbed and unscrubbed valve cycles. Although both fans were found to deliver adequate flow in the absence of a Nafion® tube, it was found that an air pump was required to produce enough flow when a Nafion® tube was in use to equilibrate humidity. The Gast air pump (3D-1060-101-1072) was found to deliver adequate flow (0.83 L/min) with a 25 cm length of Nafion® tubing in place, and was chosen for the prototype POM because of its small size (3.8 × 2.6 × 1.6 cm).
Folded Cell
The initial design concept was to fold the cell into a U-shape by machining holes in a block of Teflon and to mount mirrors at the corners to transmit UV light from the source to the detector. However, preliminary experiments with Teflon and glass-filled Teflon tubes showed that the optical throughput of 254 nm light was more than 35 times lower than that of quartz tubes used in commercial ozone monitors. Aluminum was selected as the material for the first prototype of the cell, because testing of an aluminum tube showed an optical throughput of 254 nm light that are comparable to quartz tubes. Ozone compatibility experiments showed no loss of 50 ppbv ozone through a 20-cm length of 9.5-mm I.D. aluminum tubing. A design was developed with a U-shaped cell machined into an aluminum block with a pathlength of 20 cm, as shown in Fig. 2. The aluminum cell was evaluated by installing it in a commercial ozone monitor (2B Technologies, Model 202). Calibration of the instrument yielded a slope calibration factor of 0.98 and an offset calibration factor of −1 ppbv, well within specifications for commercial ozone monitors. The average precision (one standard deviation) of the instrument was 0.9 ppbv ozone. Although the performance of this prototype was adequate, changes in humidity were found to cause large interferences as discussed in greater detail below.
FIGURE 2.

First design of the cell with a machined aluminum flow path.
A second prototype of the cell, shown in Fig. 3, was designed and built with several improvements. The mass of the cell was reduced by more than 50%, to 62 g, by decreasing the height of the cell and reducing the pathlength to 15 cm. The smaller aluminum block was machined to allow quartz tube inserts to be mounted inside the cell, thereby minimizing the interaction of the 254 nm light with aluminum surfaces. The diameter of the cell was reduced, which, combined with the reduced pathlength, reduced the volume of the detection cell to ≈3 mL, thereby reducing the flush time needed when switching between ozone-scrubbed and unscrubbed air. To make the assembly more rigid and less susceptible to vibration, the photodiode was mounted directly to the cell using a Delrin® mount. Finally, an aluminum “bridge” thermally linking the two ends of the cell was added to increase temperature uniformity throughout the cell. The overall dimensions of the revised cell are 7.1 × 5.6 × 1.5 cm.
FIGURE 3.

Second design of the cell with quartz tube inserts.
Ozone Scrubber
The use of a miniature diaphragm pump instead of a fan allowed conventional Hopcalite catalyst to be used as the ozone scrubber. The scrubbers were made from Hopcalite catalyst extrusions (Sud-Chemie, 3141-S) inserted inside fluoropolymer tubing. The catalyst was held in place with glass wool plugs on both ends and connected to barbed fittings via silicone tubing. The scrubber was installed in a commercial ozone monitor (2B Technologies, Model 202) and found to destroy 100% of the ozone at concentrations up to 1 ppmv.
Battery
To test the use of a battery to power the POM for an extended period of time, a rechargeable, Ni-Cad battery (Bescor, NMH-54) was used while sampling ambient air. This battery is highly portable with the advantages of being small (10 × 7.5 × 4.5 cm), light-weight (0.5 kg), and easy to wear using the integrated belt clip. Testing showed that the POM reads low when powered at voltages significantly lower than 11.0 volts DC, likely due to a decrease in the pump speed and insufficient purging of the cell between I and Io measurements. The time for the battery voltage to drop to 11.0 volts was 15.5 hours, which is adequate for monitoring exposure during waking hours.
Prototype Personal Ozone Monitor
The prototype POM, shown in an exploded view in Fig. 4, was designed with a “clam shell” housing made of Delrin® that contains the aluminum cell and circuit board. The housing has recessed channels to mount the lamp and lamp inverter, tapped holes to mount the circuit board and cell, and holes for connectors, status LEDs, and the gas inlet fitting. The overall dimensions of the prototype are 10 × 7.6 × 3.8 cm, and the total power consumption was measured to be 2.9 watts.
FIGURE 4.
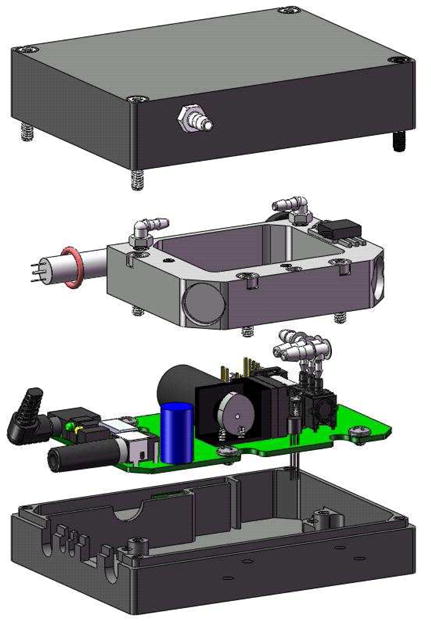
Exploded view of the Personal Ozone Monitor.
The printed circuit board was designed and constructed with a microprocessor that measures the photodiode voltage, temperature and pressure; computes ozone concentration as a mixing ratio; stores data along with a date and time stamp in an internal data logger; and transmits data and receives commands via a RS232 serial port. The data logger stores up to 2.8 days of 10-second averaged data. The pneumatic components, solenoid valve, pump, and pressure sensor, are mounted directly on the circuit board. The circuit board has a power switch, power jack, status LEDs, and a stereo jack used for RS232 serial communication along the edge of the board to make the components accessible through the side of the housing.
Prototype Evaluation
Calibration of the prototype POM was performed using ozone generated by photolysis of oxygen and subsequent dilution with ozone-scrubbed air. The ozone concentration of the gas mixture was measured by the POM and a commercial ozone monitor (2B Technologies, Model 202), which had been calibrated to a NIST-traceable standard. Ozone concentrations over the range 0–500 ppbv were generated, and ten measurements at 10 s averaging were collected for each concentration. A linear regression was applied to the data, and the slope and intercept were used to calibrate the POM response, which was found to be linear with an R2 correlation above 0.9999. A slope of 1.00 and an offset of +1 ppbv were determined, and the data was corrected for the offset in Fig. 5. The average difference between the POM and NIST traceable reference was −1.8 ±1.5 ppbv ozone, where the uncertainty is expressed as the standard error of the mean. The precision of the instrument was calculated by averaging the 10-point standard deviations for each ozone concentration and found to be 1.5 ppbv ozone. A limit of detection (S/N = 3) of 4.5 ppbv was calculated from the precision, which is a factor of ~2 improvement over passive samplers used in personal exposure studies.22 In addition, the 10-s averaging time is nearly four orders of magnitude faster than the 24hour averaging time required to achieve the ~10 ppbv limit of detection. In terms of linearity, accuracy and precision, the prototype POM meets the specifications of the 2B Technologies Model 202 Ozone Monitor, which uses the same absorption path length. The Model 202 Ozone Monitor has been designated as a Federal Equivalent Method (FEM) for ground-level ozone measurements.
FIGURE 5.

Calibration curve for the personal ozone monitor with calibration factors of S = 1.00 and Z = +1 ppbv applied.
To test the effects of physical orientation on the measurement of ozone, the POM was setup to measure the output of an ozone calibrator (2B Technologies, Model 306). The instrument was placed on end, on its side and upright while sampling 0 ppbv and 200 ppbv ozone. No significant change in the measured ozone concentration was observed between the three orientations of the instrument. In order to test for vibration effects, the POM was attached to a laboratory orbital shaker (Cole-Parmer, EW-51820-30) while exposed to either 0 or 200 ppbv. Measurements were made over the range of 40–360 rpm with no discernable effects on the measured ozone concentration due to shaking. The precision initially spiked as high as 5 ppbv when the speed of the shaker was changed, but quickly dropped below 2 ppbv within a few minutes.
The first cell prototype, which made use of an aluminum only flow path, was found to have a water vapor interference, almost certainly because of the strong adsorption of water molecules at the aluminum surface, thereby changing the reflectivity of the walls. Instantaneous switching between ambient air (~20% Relative Humidity (RH)) and humid air (100% RH) produced an immediate offset of 1,500 ppbv ozone. Since the use of quartz has been reported to dramatically decrease the humidity effect, the second cell prototype was designed with quartz tube inserts.21 Two 25-cm lengths of Nafion® tubing were added in parallel between the valve and inlet to the detection cell. These changes reduced the humidity effect by two orders of magnitude to an offset of 15 ppbv ozone for the same extreme change in humidity. Subsequent addition of quartz windows in front of the two corner mirrors completely eliminated the humidity effect. With the quartz windows installed, the UV light detected at the photodiode does not interact with the aluminum surfaces in the cell, only with the quartz tubes and quartz windows. Humidity step changes between 20% and 100% RH resulted in no offset when measuring either 0 or 200 ppbv ozone. Therefore, the humidity effect is below the limit of detection of the instrument for sudden, large changes in humidity.
The POM was tested for sudden changes in temperature by placing it in a refrigerator at −20 °C and in an oven at 50 °C. Ozone concentrations of 0 and 200 ppbv where sampled under both temperature extremes. Initially, readings became noisy and offsets of up to 30 ppbv were observed. These effects were found to be due to desorption of UV-absorbing compounds from the ozone scrubber material. After changing the scrubber material to that from a commercial scrubber (Headline Filters, DIA-BKHO), no significant changes in signal were observed for step changes between ambient (23 °C) and −20 °C or between ambient and 50 °C while sampling ozone concentration of both 0 and 200 ppbv. The Hopcalite in the commercial scrubber appears to be a cleaner material and has been used to scrub ozone continuously for several years; however, the scrubber is typically replaced annually as a precaution against detrimental contamination of the scrubber.
CONCLUSIONS
A highly portable ozone monitor for rapid and accurate measurements has been developed. The miniature instrument has the advantage of being small (10 × 7.6 × 3.8 cm), light-weight (≤ 1 kg), low power (≤ 3 watts), battery-operated, and based on the well established method of UV absorbance. The Personal Ozone Monitor has a precision and accuracy of ≤ 2 ppb, detection limit of 4.5 ppbv (S/N = 3), can make new measurements every 10 s, and has an internal data logger that can store up to 2.8 days of 10-second averaged data. The use of a quartz lined optical path and Nafion® tubing makes the POM free of interference from humidity. The instrument was found to be unaffected by physical orientation, temperature, and vibration that might be experienced under personal monitoring conditions.
Acknowledgments
This work was supported by the National Institute of Environmental Health Sciences through a Small Business Innovative Research Grant (Grant 1R43ES016925-01).
References
- 1.American Thoracic Society. Am J Respir Crit Care Med. 1996;153:3–50. doi: 10.1164/ajrccm.153.1.8542133. [DOI] [PubMed] [Google Scholar]
- 2.Dworski R. Thorax. 2002;55:51s–53s. [Google Scholar]
- 3.Mudway IS, Kelly FJ. Am J Respir Crit Care Med. 2004;169:1089–1095. doi: 10.1164/rccm.200309-1325PP. [DOI] [PubMed] [Google Scholar]
- 4.Etzel RA. Pediatrics. 2003;112:233–239. [PubMed] [Google Scholar]
- 5.Krzyzanowski M, Cohen A, Anderson R. Occup Environ Med. 2002;59:791–793. doi: 10.1136/oem.59.12.791. [DOI] [PMC free article] [PubMed] [Google Scholar]
- 6.D’Armato G, Liccardi G, D’Armato M, Cazzola M. Eur Respir J. 2002;20:763–776. doi: 10.1183/09031936.02.00401402. [DOI] [PubMed] [Google Scholar]
- 7.Mortimer KM, Neas LM, Dockery DW, Redline S, Tager IB. Eur Respir J. 2002;19:699–705. doi: 10.1183/09031936.02.00247102. [DOI] [PubMed] [Google Scholar]
- 8.Friedman MS, Powell KE, Hutwagner L, Graham LM, Teague WG. Chest. 2001;119:402–408. doi: 10.1001/jama.285.7.897. [DOI] [PubMed] [Google Scholar]
- 9.Lin M, Chen Y, Burnett RT, Villeneuve PJ, Krewski D. J Epidemiol Community Health. 2003;57:50–55. doi: 10.1136/jech.57.1.50. [DOI] [PMC free article] [PubMed] [Google Scholar]
- 10.Lin M, Chen Y, Villeneuve PJ, Burnett RT, Lemyre L, Hertzman C, McGrail KM, Krewski D. Am J Epidemiol. 2004;159:294–303. doi: 10.1093/aje/kwh043. [DOI] [PubMed] [Google Scholar]
- 11.Fusco D, Forastiere F, Michelozzi P, Spadea T, Ostro B, Arca M, Perucci CA. Eur Respir J. 2001;17:1143–1150. doi: 10.1183/09031936.01.00005501. [DOI] [PubMed] [Google Scholar]
- 12.Burnett RT, Smith-Doiron M, Stieb D, Raizenne ME, Brook JR, Dales RE, Leech JA, Cakmark S, Krewski D. Am J Epidemiol. 2001;153:444–452. doi: 10.1093/aje/153.5.444. [DOI] [PubMed] [Google Scholar]
- 13.Annesi-Maesano I, Agabiti N, Pistelli R, Couilliotn MF, Forastiere F. Eur Respir J. 2003;21:57s–63s. doi: 10.1183/09031936.03.00402103. [DOI] [PubMed] [Google Scholar]
- 14.Goldberg MS, Burnett RT, Brook J, Bailar JC, III, Valois M-F, Vincent R. Am J Epidemiol. 2001;154:817–826. doi: 10.1093/aje/154.9.817. [DOI] [PubMed] [Google Scholar]
- 15.Hill EA, Nelson JK, Birks JW. Anal Chem. 1982;54:541–546. [Google Scholar]
- 16.Korotcenkov G, Blinov I, Brinzari V, Stetter JR. Sens Actuators B. 2007;122:519–526. [Google Scholar]
- 17.Kanan SM, El-Kadri OM, Abu-Yousef IA, Kanan MC. Sensors. 2009;9:8158–8196. doi: 10.3390/s91008158. [DOI] [PMC free article] [PubMed] [Google Scholar]
- 18.Bowman LD, Horak RF. A Continuous Ultraviolet Absorption Ozone Photometer. In: Scales JW, editor. Air Quality Instrumentation. Vol. 2 Instrument Society of America; Pittsburgh, PA: 1972. [Google Scholar]
- 19.Long TC, Johnson T, Capel J. Comparison of Continuous Personal Ozone Measurements to Ambient Concentrations and Exposure Estimates from the APEX-Ozone Exposure Model. Presented at the International Society for Environmental Epidemiology 20th Annual Conference; Pasadena, California. October, 2008; Poster S213. [Google Scholar]
- 20.Sander SP, Golden DM, Kurylo MJ, Moortgat GK, Wine PH, Ravishankara AR, Kolb CE, Molina MJ, Finlayson-Pitts BJ, Huie RE, Orkin VL, Friedl RR, Keller-Rudek H. JPL Publication 06-2. National Aeronautics and Space Administration; Government Printing Office; Washington, DC: 2006. Chemical Kinetics and Photochemical Data for Use in Atmospheric Studies. [Google Scholar]
- 21.Wilson KL, Birks JW. Environ Sci Technol. 2006;40:6361–6367. doi: 10.1021/es052590c. [DOI] [PubMed] [Google Scholar]
- 22.Sarnat SE, Coull BA, Schwartz J, Gold DR, Suh HH. Environ Health Perspect. 2006;114:649–654. doi: 10.1289/ehp.8422. [DOI] [PMC free article] [PubMed] [Google Scholar]