

Abstract
Fronto-striatal circuitry interacts with the midbrain dopaminergic system to mediate the learning of stimulus–response associations, and these associations often guide everyday actions, but the precise role of these circuits in forming and consolidating rules remains uncertain. A means to examine basal ganglia circuit contributions to associative motor learning is to examine these process in a lesion model system, such as Parkinson’s disease (PD), a basal ganglia disorder characterized by the loss of dopamine neurons. We used functional magnetic resonance imaging (MRI) to compare brain activation of PD patients with a group of healthy aged-match participants during a visual–motor associative learning task that entailed discovering and learning arbitrary associations between a set of six visual stimuli and corresponding spatial locations by moving a joystick-controlled cursor. We tested the hypothesis that PD would recruit more areas than age-matched controls during learning and also show increased activation in commonly activated regions, probably in the parietal and premotor cortices, and the cerebellum, perhaps as compensatory mechanisms for their disrupted fronto-striatal networks. PD had no effect in acquiring the associative relationships and learning-related activation in several key frontal cortical and subcortical structures. However, we found that PD modified activation in other areas, including those in the cerebellum and frontal, and parietal cortex, particularly during initial learning. These results may suggest that the basal ganglia circuits become active more so during the initial formation of rule-based behavior.
Keywords: Visual–motor associative learning, Event-related functional MRI, Basal ganglia, Parkinson’s disease, Feedback, Hand movement
Introduction
A hallmark of cognition relates to the flexibility with which humans and other animals can associate environmental stimuli with specific motor actions even when these do not share an a priori relationship. Associative learning often occurs by trial and error by integrating a sensory event, a movement, and its consequence. At the onset of learning associations between stimuli and responses (S–R), participants often commit errors as they try to establish the associations and receive negative feedback; with repetition, participants discover the associations and receive positive feedback that indicates correctness, and these new patterns become reinforced with further correct repetition of the S–R associations.
Considerable evidence has accrued suggesting a paramount role of fronto-striatal networks in associative learning. Anatomically, functional reciprocal loops of sensory and motor inputs connect the frontal cortex and basal ganglia (Alexander et al., 1986). The striatum also receives substantial reward-related input from midbrain dopaminergic neurons (Schultz, 2007). Thus, the striatum has an ideal position to establish an association between sensory inputs and motor responses according to their behavioral outcomes. As such, imaging studies have found learning-related activation in the putamen and caudate nucleus, various portions of the prefrontal cortex (PFC; ventro-lateral and dorso-lateral), anterior cingulate (ACC), and also the premotor and supplementary motor areas (PM, SMA; Boettiger and D’Esposito, 2005; Brovelli et al., 2008; Delgado et al., 2000, 2005; Eliassen et al., 2003; Galvan et al., 2005; Grol et al., 2006; Seger and Cincotta, 2005, 2006; Toni and Passingham, 1999; Toni et al., 2001b). Also, PM lesions in humans and monkeys impair associative learning (Halsband and Freund, 1990; Halsband and Passingham, 1985). Moreover, other areas that participate in associative learning include the parahippocampal formation (Seger and Cincotta, 2005, 2006; Toni and Passingham, 1999; Toni et al., 2001b) and the parietal cortex (Eliassen et al., 2003; Grol et al., 2006). Electro-physiological studies in monkeys have also reported learning-related neuronal activity in PM, primary motor cortex, putamen, caudate nucleus, and hippocampus (Brasted and Wise, 2004; Buch et al., 2006; Hadj-Bouziane and Boussaoud, 2003; Mitz et al., 1991; Pasupathy and Miller, 2005; Romero et al., 2008; Schultz et al., 2003; Wise and Murray, 1999; Zach et al., 2008; for review see Hadj-Bouziane et al., 2003). Many of these areas are considered inter-connected via cortico-thalamic-basal ganglia loops. The head of the caudate, PFC, and parietal cortex form an executive loop and the putamen and PM–SMA form a motor loop (Alexander et al., 1986; Lawrence et al., 1998; Seger, 2008). Therefore, the fronto-striatal networks most likely have involvement in associative learning.
Despite all these findings, the exact role of fronto-striatal networks remains incompletely understood. Basal ganglia damage, as in Parkinson’s disease (PD) or focal lesions in monkeys, often does not cause impaired associative learning capabilities (Canavan et al., 1989; Frank et al., 2004; Mollion et al., 2003; Nixon et al., 2004; Pillon et al., 1998; Tucker et al., 1996). Although in a strict sense, these results would indicate that basal ganglia structures, especially the putamen-PM/SMA circuit, are not necessary in S–R learning, brain diseases and lesions do not completely abolish basal ganglia functions, and brain plasticity/reorganization at the cellular and system levels may compensate for immediate lesion effects (Bezard et al., 2003). Therefore, a fuller understanding of the role of fronto-striatal networks in associative leaning may depend, in part, in better understanding how and whether PD patients use compensatory mechanisms to learn S–R. Imaging studies in PD patients have often shown activation in other brain areas such as the cerebellum, parietal cortex, M1, PM, and ACC while PD patients performed and learned motor tasks, and these compensatory mechanisms often allowed these patients to reach a level of performance comparable to healthy controls (Buhmann et al., 2003; Catalan et al., 1999; Haslinger et al., 2001; Mentis et al., 2003; Sabatini et al., 2000; Turner et al., 2003; Wu and Hallett, 2005). Nevertheless, these studies have mostly used motor sequence and not associative learning as the testbed. A recent fMRI study found that PD modified fronto-striatal activation during rehearsal of S–R pairs (Schott et al., 2007; see also Cools et al., 2007); however, learning was not assessed per se in these studies. So, whether and what kind of compensatory mechanisms PD patients use during associative learning remains incompletely specified.
We aimed to better understand these compensatory mechanisms which in turn could help better understand the nature of basal ganglia involvement in associative learning. An unresolved issue concerns how basal ganglia and frontal regions interact during associative learning. Some have suggested that PFC would be involved early in learning but basal ganglia at a later stage to consolidate and automate habits (Alexander et al., 1986; Graybiel, 1998; Packard and Knowlton, 2002). Others have suggested that learning would first emerge in basal ganglia that would then “train” the PFC (Houk and Wise, 1995; Pasupathy and Miller, 2005; Seger and Cincotta, 2006). While psychophysics studies in PD can only suggest that basal ganglia may not be mandatory and that compensatory mechanisms may take place, neuroimaging in healthy volunteers only provide one window into the function of basal ganglia in S–R learning.
Thus, we used whole-brain fMRI and a lesion model of basal ganglia in humans, that is PD, to better understand how basal ganglia and frontal cortex mediate learning. We designed the visual–motor associative task so that patients with PD would learn similarly to a control group, thereby avoiding performance confounds when interpreting brain activation results (Price et al., 2006) Based on a recent imaging study indicating early basal ganglia and later PFC activation during S–R learning in young adults (Seger and Cincotta, 2006), we hypothesized that PD would recruit more areas than age-matched controls early in learning, to compensate for their pathology, and that these compensatory mechanisms would diminish or disappear as learning occurred. We further hypothesized that PD patients would recruit parietal, premotor, ACC, and the cerebellum to compensate for disrupted fronto-striatal circuitry.
Methods
Participants
Participants in this study included 10 individuals having a diagnosis of idiopathic PD, as assessed by a neurologist (five females, mean age=57.4±8 years, all right-handed). Most PD patients were in the early phases of the disease scoring in Stage I–II of the Hoehn and Yahr scale with only one patient scoring in Stage III (Table 1). The neurologist assessed motor function using a standard scale (Unified Parkinson Disease Rating Scale) while patients remained on their anti-parkinsonian medication, as they did for the actual experiment. The neurologist reported that the parkinsonian symptoms were essentially bilaterally symmetric, with some mild tendency for some patients to have a subtle left-sided prevalence in their deficit. Volunteers (n=10) with no history of neurological or motor/sensory disorder formed a control group (eight females, mean age=62.4± 10 years, all right-handed; no significant age differences between groups, t=1.22, p=0.25). All participants provided written informed consent according to established and approved Institution Review Board guidelines for human participation in experimental procedures at Brown University and Memorial Hospital of Rhode Island (the site of the MR imaging) and according to the Declaration of Helsinki. Participants received modest monetary compensation for their participation.
Table 1.
Characteristics of PD participants.
| Age | Gender | Hoehn and Yahr | UPDRS | Medication | |
|---|---|---|---|---|---|
| Patients | |||||
| 1 | 49 | F | 1.0 | 6 | Mirapex 1 mg tid Sinemet 25/100 tid |
| 2 | 53 | F | 1.5 | 7 | None |
| 3 | 71 | F | 2.0 | 10 | Permax 0.5 mg tid |
| 4 | 58 | F | 1.0 | 6 | Mirapex 1.5 mg tid |
| 5 | 68 | M | 2.0 | 16 | Mirapex 2.5 mg daily Sinemet 25/100 4×/day |
| 6 | 57 | F | 1.0 | 20 | Permax 1 mg tid |
| 7 | 52 | M | 2 | 15 | Sinemet 25/100 tid |
| 8 | 62 | M | 2.0 | 22 | Sinemet 25/250 tid Requip 5 mg tid Amantadine 100 mg tid |
| 9 | 46 | M | 2.5 | 29 | Sinemet 25/100 tid |
| 10 | 58 | M | 3.0 | 9 | Mirapex 1 mg tid Sinemet CR 50/200 7×/day Sinemet 25/100 2 in AM Amantadine 100 mg tid |
Tasks, apparatus and procedures
Participants learned arbitrary associations between individual visual stimuli and a specific hand movement. While holding a MRI-compatible joystick (Mag Design and Engineering, Sunnyvale, CA) in their right hand, volunteers lay supine in the MRI system with the right arm fully extended beside their right side. Joystick movements displaced a cursor (a white round dot) seen on a projection screen located at the foot of the MRI bed. Participants viewed the screen on an angled mirror mounted on the head coil of the MRI system. Left and right joystick movements displaced the cursor leftward and rightward on the screen, while forward and backward joystick movements displaced the cursor upward and downward on the screen. Participants wore a set of headphones for ear protection and communication with the experimenter and viewed a set of six annular-shaped targets and one initial-alignment, “home”, position (square) on a projection screen (Fig. 1A). The home position appeared in the middle of the screen flanked by three targets on each side in the horizontal plane. All six targets and the home position were white over a black screen background. We used the Windows version of PsychToolbox v.2.54 (www.psychtoolbox.org, Brainard, 1997; Pelli, 1997) for Matlab 7 (Mathworks, Natick, MA) running on a Dell computer (Round Rock, TX) to generate visual stimuli and record the cursor positions at 500 Hz.
Fig. 1.
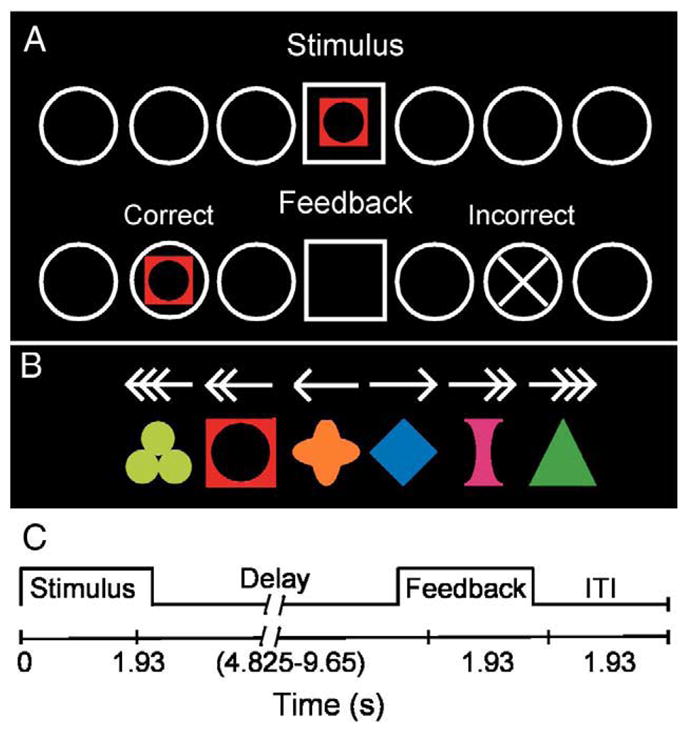
Schematic of experiment. (A) Visual stimuli used in the experiment: arrows (Movement task) and symbols (associative learning task). (B) Task schematic. Participants viewed a stimulus (arrow or symbol) and move the joystick that displaced a cursor on the screen from the center home position (square) to one of the six targets (circles) and then received feedback for correctness. (C) Trial Events. A trial started with the presentation of a stimulus during 1.93 s. Then, a variable delay of 4.825–9.65 s (randomly presented) allowed time for participants to move to a target. After the delay, feedback appeared for 1.93 s. An inter-stimulus interval (ITI) of 1.93 s allowed time for participants to replace the cursor in the home position before the next trial started. See text for additional details.
Participants performed a visual–motor learning “Association” task and a “Movement Control” task (Fig. 1). In the Association task, participants viewed an array of six circular outlines that flanked a central square, three to each side (Fig. 1A). One of six geometric symbols (Fig. 1B, lower row) appeared in the central square (Fig. 1A), and participants had to “uncover” the association between the stimulus and a target location. Each symbol was paired with only one target, and the stimulus–target mapping remained constant for the whole experiment. In the Movement Control task (hereafter termed Movement task), the stimuli comprised a set of six arrows whose orientation and number of arrowheads indicated the target to choose (Fig. 1B, top row). In each of five runs, participants first performed a block of 12 trials of the Movement task and then a block of 24 trials of the Association task; a short break separated each run (<1 min). Each symbol appeared once in a random order over a block of six trials yielding four trials per run and 20 trials during the whole experiment for each of the six symbols. Before each block of the Movement or Association task, the words “ARROWS” or “SYMBOLS” appeared for 3.86 s. We pre-tested two PD patients on a different set of geometric symbols to ensure that this number of trials would suffice for learning to occur.
Each trial comprised the presentation of either an arrow or a symbol (1.93 s; Fig. 1C) followed by a delay (4.82, 5.79, 6.75, 7.72, 8.86, or 9.65 s). The delays occurred randomly to permit disentanglement of activation related to presentation of the stimulus cue or the feedback signal. This design does not permit disentanglement of activation related to the stimulus cue from that related to movement; therefore we used stimulus onset as the temporal anchor in subsequent data processing. After the initial delay, a feedback signal appeared (1.93 s; Fig. 1A, second row) at the selected location to indicate a correct (the symbol reappeared) or an incorrect (an X appeared) response. Note that participants could move at any time during stimulus presentation or the delay; we did not emphasize rapid reaction time, but also indicated that participants should not dawdle at the central location. Participants had to keep the cursor in the chosen target until the feedback signal appeared. After the feedback signal extinguished, an inter-trial-interval (ITI) of 1.93 s occurred to allow participants to return the cursor to the home position. However, this ITI may not permit complete disentanglement of stimulus- from feedback-related activation. Our results should be interpreted with this aspect in mind; we only report the data concerning the stimulus-related activation. No feedback appeared during the Movement task. After receiving task instructions, participants practiced both tasks immediately before entering the MRI scanner with different symbols than those used during of the actual experiment. They practiced until they performed at least three S–R associations correctly.
MR imaging
We used a 1.5 T Symphony Magnetom MRI system equipped with Quantum gradients (Siemens Medical Solutions, Erlangen, Germany) to acquire anatomical and functional MR images. Participants lay supine inside the magnet bore with the head resting inside a circularly polarized receive-only head coil used for radio frequency reception; the body coil transmitted radio frequency signals. Cushioning and mild restraint reduced head movements. After shimming the standing magnetic field, we acquired a high-resolution anatomical image consisting of 160 1 mm sagittal slices (magnetization prepared rapid acquisition gradient echo sequence, MPRAGE; repetition time (TR)= 1900 ms, echo time (TE)=4.15 ms, inversion time=20 ms, 1 mm isotropic voxels, 256 mm field of view). Then, we generated T2*-weighted gradient echo images using the blood oxygenation level-dependent (BOLD) mechanism (Kwong et al., 1992). In each of five runs, we collected 48 axial slices to sample the whole brain during 112 interleaved volumes (TE=38 ms, TR=3.86 s, field of view=192 mm, flip angle=90°, image matrix=64×64, 3 mm slice thickness for 3 mm isotropic voxels). The MRI system did not collect any data for the first volume of each run because of T1 saturation effect leaving 111 volumes of data. For six participants, we acquired four runs of data (two participants in the Control group and four participants in the PD group).
Behavioral data analysis
We classified each of the 20 trials performed with each symbol into one of six categories to assess the effects of PD across learning: “Incorrect” included all trials performed incorrectly before the first correctly performed trial (labeled “X” in Figs. 4, 5); “Correct-1” included the first, second, and third correctly performed trials; “Correct-2” included the fourth, fifth, and sixth correctly performed trials; and so on until a category termed “Correct-5”. For all six categories of trials, the number of trials per group averaged 14 and 19; this variation occurred due to the number of incorrectly performed trials out of the total of 20 trials. We confirmed using a two-way ANOVA with Groups (control, PD) as between factor and Category (Incorrect, Correct-1 to Correct-5) as repeated measures that the number of trials per categories did not differ between the groups; that is, we failed to reject the null hypotheses of no Group difference (F(1, 18)=0.54, p=0.47), of no Category difference (F(5, 90)=1.24, p=0.30), and of no Group by Category interaction (F(5, 90)=0.17, p =0.97). Classifying trials into these six categories effectively accounted for more than 87% and 95% of all trials of the control and PD groups respectively; the remaining trials were not included in any subsequent analysis. We classified all trials performed during the Movement task as “Arrows”.
Fig. 4.

Regions depicting a main effect of Category. (A) These included the ACC (BA32), PFC (BA9), precuneus, SMG, cerebellum (CR-I), head of the caudate nucleus, ventral striatum, ITG, and thalamus. The color bar represents the F statistics of the Category main effect. See Table 2 for more details. L, left hemisphere. (B) MRI signal (%) for each group across all 6 learning categories. Most clusters showed decreased activation across the learning categories but two showed an increase (ventral striatum and thalamus). CB, cerebellum (Cr: Crus); ACC, anterior cingulate cortex; PFC, prefrontal cortex; SMG, supramarginal gyrus; ITG, inferior temporal gyrus.
Fig. 5.

Regions depicting an interaction effect of Group×Category. (A) These included the SMG (BA40), precuneus (BA7), PFC (BA9), cerebellum, and tail of the caudate nucleus. The color bar represents the F statistics of the interaction. See Table 3 for more details. L, left hemisphere. (B) MRI signal (%) for each group across all 6 learning categories. The interaction indicates that PD had high level of activation in the early learning phase but decreased it across learning whereas controls had sustained activation throughout (see text). CS, central sulcus.
MRI signal processing and analysis
We processed our MRI data using AFNI (Analysis of Functional NeuroImages; Medical College of Wisconsin; National Institute of Health: http://afni.nimh.nih.gov/afni Cox and Hyde, 1997; Cox, 1996) and FSL (FMRIB software Library, http://www.fmrib.ox.ac.uk/fsl/, Smith et al., 2004). For each run, we removed the linear trend in the time-series, scaled it by its mean to yield signal percent change, and then concatenated the time-series of functional images. We motion-corrected this concatenated time-series with a six-parameter rigid-body cubic polynomial interpolation (3dvolreg tool in AFNI) aligned to the third functional volume. We used FSL to normalize the anatomical and functional data sets to the MNI template and finally spatially smoothed the functional data with a 6 mm full-width half-maximum Gaussian kernel.
All event types, that is, the time of stimulus presentation for the Incorrect, the five blocks of correct trials, and trials during the Movement task, the time of feedback presentation for the Incorrect and the five blocks of correct trials were convolved with a gamma variate function (waver tool in AFNI; Cohen, 1997) to yield an impulse response function. We then used these reference functions and the six motion correction parameters as inputs to a multiple regression analysis (3dDeconvolve tool in AFNI) to estimate the β weights (representing % signal change) of each category.
Statistical analysis
We first sought to identify activation related to performing the Associative task. To achieve this aim, we first subtracted (within participants) the estimated β weights of the Movement task from β weights estimated for each of the six trial categories (Incorrect and Correct-1 through Correct-5) to yield a more appropriate measure of associative performance and then averaged the resulting β weights. We then used a t-test to identify above-threshold voxels across both groups and retained those voxels that passed the criterion of rejecting the null hypothesis of no activation difference between conditions (random effects test; voxel threshold: p≤0.001, t(19)≥3.863; corrected for multiple comparisons at p≤0.05 for 21 contiguous voxels as implemented in AFNI). This procedure effectively yielded a mask of activation shown in Fig 3. We then used a two-way ANOVA with Groups (control, PD) as between factor and Category (Incorrect, Correct-1 through Correct-5) as repeated measures (mixed random effects) to assess how PD affects learning but only for those voxels included in the mask. We thresholded these resulting maps by retaining voxels that satisfied a probability threshold of p≤0.01 and also formed a contiguous cluster of at least 7 voxels. We localized activation clusters with the brain atlas of Duvernoy (1991), the cerebellum atlas of Schmahmann et al. (1999), and a navigable web-based human brain atlas (https://www.msu.edu/~brains/brains/human/index.html).
Fig. 3.
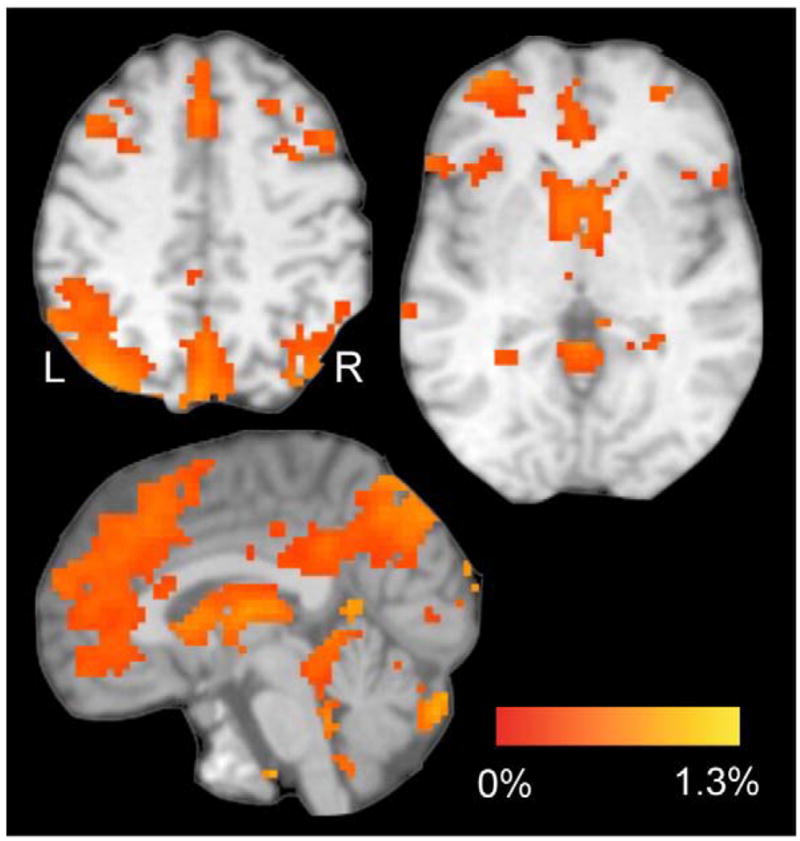
Task-related brain activation (% MRI signal) for both groups. These regions represent a contrast (t-test) between the Associative task (averaged across the 6 trials categories) vs. the Movement task on both groups (voxel threshold: p≤0.001, t (19)≥3.863; corrected for multiple comparisons at p≤0.05 for 21 contiguous voxels as implemented in AFNI). Activation occurred in frontal and parietal cortices, thalamus, basal ganglia, and cerebellum. The color bar represents the % MRI signal change of the contrast aforementioned. L, left hemisphere.
Results
Behavioral performance
To index learning, we computed the percent of correctly performed trials per run (Fig. 2A) and used a two-way ANOVA with Groups (Control, PD) as the between factor and Runs as the repeated measures factor (mixed random effects). From the ANOVA output, we did not reject the null hypothesis of no Group difference, F(1, 18)= 2.14, p=0.16, or the null hypothesis of no Group by Runs interaction, F(4, 72)=0.34, p=0.85. Although we did not reject the null hypothesis of no difference between the two groups, a power analysis with G*Power 3 (Faul et al., 2007) indicated that 19 participants in each group, that is, an additional nine per group, would be required to perhaps reject the null hypothesis of no Group difference at p≤0.05 and power of 0.5. This result strongly suggests that PD and aged-matched participants learned at an equivalent rate. Not surprisingly, the ANOVA output revealed a significant main effect of Runs, F(4, 72)=46.21, p=0.05e–14, such that the number of correctly performed trials increased as experience accrued through increasing exposure to the visual–motor associations (means±SEM of 39.8±4.8%, 70.6±5.3, 86.7±4.1, 91.9±2.8, 97.1±0.9 from Run 1 through Run 5, respectively); post-hoc t-test confirmed these findings revealing a significant increase in accuracy from Run 1 to Run 2 (t(9)=7.17, p=0.00005), from Run 2 to Run 3 (t(9)=3.44, p=0.01), and marginal increases from Run 3 to Run 4 (t(9)=1.91, p=0.08) and from Run 4 to Run 5 (t(9)=2.00, p=0.08).
Fig. 2.
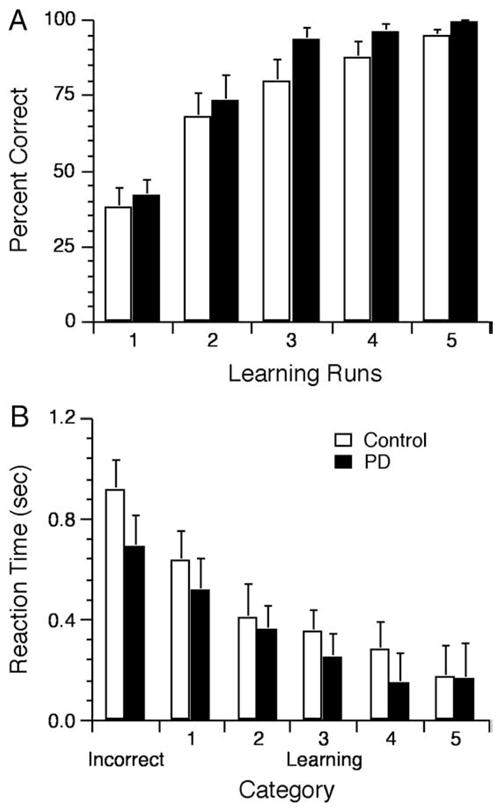
Behavioral results. (A) Percent of correct responses increased for the control and PD groups across runs as revealed by a two-way 2 Group×5 Runs ANOVA that yielded a main effect of Runs, F(4, 72)=46.21, p=0.02e–14, no interaction F(4, 72)<1, and no main effect of Group F(1, 18)=2.14, p>0.16. (B) RT decreased across the 6 categories of trials for the control and PD groups as revealed by a two-way 2 Group×6 Category ANOVA that yielded a main effect of Category, F(5, 90)=30.92, p<0.01e–13, indicating a decrease of RT going from the Incorrect to Correct-1 and Correct-2 with no further significant decrease. The ANOVA yielded no significant main effect of Group, F(1, 18)<1, or interaction F(5, 90)<1.
We computed reaction time (RT) defined by the time elapsed between the presentation of a stimulus and initiation of joystick movement (Fig. 2B). In this analysis, we first subtracted RT of each of the six categories from the Movement task to yield a learning-related measure of RT. This procedure reduces the possibility of finding RT differences simply due to bradykinesia typically observed in parkin-sonism (Berardelli et al., 2001). However, we also note that the absolute RT did not differ between the Control and PD groups in the Movement task (0.78±0.1 s and 0.68±0.11 s; t(18)=0.66, p=0.52). We then used a two-way ANOVA, with Groups (control, PD) as the between factor and Category (Incorrect, Correct-1 through Correct-5) as repeated measures factor (mixed random effects), to determine how PD affected RT. From the ANOVA output, we could not reject the null hypothesis of no Group difference, F(1, 18)=0.55, p=0.47, and the null hypothesis of no Group by Category interaction, F(5, 90)= 0.76, p=0.58. Because of apparent RT differences between the groups at some categories, we also used t-tests to compare RT obtained from the two groups at each Category; from the output of these tests, we did not reject the null hypothesis of no group difference for any of these tests (ps >0.20). To assess the failure to reject the null hypotheses, we implemented a power analysis for the Incorrect trials, for which the group means differed the most; this analysis indicated that 25 participants in each group, that is, an additional 15 per group, would be required to perhaps reject the null hypothesis of no group difference at p≤0.05 and power of 0.5. The ANOVA output also revealed a significant main effect of Category, F(5, 90)=30.92, p<0.01e–13, that indicated a steady decrease of RT across learning. Post-hoc t-tests confirmed this observation revealing a significant RT decrease going from Incorrect to Correct-1 (t(9)=3.59, p≤0.01), from Correct-1 to Correct-2 (t(9)=4.64, p=0.001), a marginal decrease from Correct-2 to Correct-3 (t(9)=2.1, p=0.07), a significant decrease going from Correct-3 through Correct-4 (t(9)=2.27, p=0.05), a no further significant decrease from Correct-4 to Correct-5 (t(9)=0.96, p=0.36).
Thus, the accuracy and RT data support conclusions of prior work that PD does not appear to impair associative learning capabilities (e.g., Pillon et al., 1998), a finding of some importance to avoid performance confounds when interpreting brain imaging results (Price et al., 2006).
Brain activation
We first show activation related to performing the Associative task (Methods, Fig. 3). Performing the Associative task in both groups yielded activation in regions within the frontal (ACC, IFG, MFG) and parietal (inferior, superior lobules and precuneus) cortices and subcortical regions within the thalamus, basal ganglia, and in the cerebellum. No region exhibited more activation for the Movement than for the Associative task. Taken together, these regions have commonly been shown before as involved in associative learning (see Introduction). Our next analysis entailed understanding how PD affected dynamic aspects of learning-related brain activation, that is, activation changes across the six trial categories. To do so, we used a two-way ANOVA (Group×Category) using the activated mask shown in Fig. 3 and examined the main effects of Group and Category and the Group by Category interaction.
No cluster exhibited a main effect of Group. By contrast, the two-way ANOVA main effect of Category revealed 15 clusters illustrated in Fig. 4A (Table 2). These included three clusters in the precuneus (BA 7; labeled 1 and 2 in Figs. 4A, B; the most superior cluster is not shown), and three clusters in the SMG (BA40; two in the left, labeled 4 and 5 and one in the right hemisphere), prefrontal cortex (PFC; BA9), ACC (BA24, 32), and left ITG (BA21); in subcortical regions, we found three clusters in the cerebellum (CR-VI; bilaterally with two on the right hemisphere labeled 6 and 7; cluster 7 is not depicted in Fig. 4A), right thalamus, the left head of the caudate and one in the ventral striatum. Fig. 4B illustrates the functional MRI signal (%) for each group and for the six trial categories. As can be seen, activation in some clusters decreased and others increased (main effect of Category). To confirm this observation, we calculated the slope of functional MRI signal across the six trial categories, pooled across group, and found support to reject the null hypothesis of zero slope for all of these clusters (p≤0.05). For the majority of these clusters, activation decreased across categories except for the ventral striatum and right thalamus, both of which showed increased activation across these learning categories.
Table 2.
Category main effect.
| Brain regions (BA) | Volume |
F values |
MNI coordinates |
|||
|---|---|---|---|---|---|---|
| Mean | Max | X | Y | Z | ||
| Cortical | ||||||
| Precuneus | 3132 | 5.61 | 13.55 | 0 | 72 | 39 |
| L Precuneus | 1053 | 4.74 | 7.9 | 3 | 60 | 63 |
| R Precuneus | 594 | 4.87 | 7.78 | −9 | 75 | 57 |
| L SMG (40) | 2565 | 4.98 | 11.23 | 33 | 75 | 42 |
| L SMG (40) | 297 | 3.68 | 4.62 | 48 | 42 | 39 |
| R SMG (40) | 783 | 4.1 | 6.59 | −33 | 66 | 36 |
| ACC (24, 32) | 1215 | 4.51 | 8.07 | 3 | −30 | 42 |
| L ITG (21) | 243 | 4.36 | 5.66 | 66 | 27 | −15 |
| L PFC (9) | 189 | 3.96 | 5.55 | 54 | −12 | 33 |
| Subcortical | ||||||
| L Cerebellum (CR-VI) | 1296 | 5.35 | 12.01 | 45 | 66 | −27 |
| R Cerebellum (CR-VI) | 378 | 5.27 | 6.95 | −39 | 69 | −21 |
| R Cerebellum (CR-VI) | 270 | 3.71 | 4.27 | −24 | 75 | −21 |
| R Thalamus | 594 | 4.28 | 5.6 | −9 | 21 | 18 |
| R Ventral striatum | 378 | 3.93 | 6.13 | −3 | −12 | 0 |
| L Caudate (head) | 189 | 3.95 | 5.5 | 54 | −12 | 33 |
Volume represent the cluster volume in mm3. F values represent the mean and the maximal F statistics of the main effect of Group. MNI coordinates indicate voxel with the highest F values, with +X indicating left hemisphere.
The two-way ANOVA revealed a Group by Category interaction in six clusters illustrated in Fig. 5A (Table 3). These included the left SMG (BA40), precuneus (BA7), right PFC (BA9), two clusters in the right cerebellum (CR-VII and CR-I), and one in the tail of the right caudate nucleus. Fig. 5B illustrates the functional MRI signal (%) for each group across all six trial categories. Note that PD patients had higher activation than Controls in the early learning phase (X, Correct-1), but then PD patients showed decreased activation as the associations became learned and participants entered a rehearsal phase. For these clusters, the Control group exhibited more sustained activation across trial category, thereby yielding a smaller group difference at the end of performing the Associative task. To confirm these descriptive observations, we calculated the slope of functional MRI signal (%) across the six trial categories for each participant and tested the null hypothesis of no group difference for slope, which we rejected for all clusters (p≤0.05). We also rejected the null hypothesis of null slope for the PD group for all six clusters (p≤0.01) and similarly rejected this null hypothesis for one cluster in the Control group; this cluster appeared in the caudate nucleus (p≤0.05; other clusters p≥0.31). These results confirm the observation that the PD group showed decreased activation for these clusters as they accrued experience with the Associative task, whereas the Control group mostly exhibited sustained activation during the same period. Moreover, we tested the null hypothesis of no group difference within a specific trial category (t-test post-hoc). For those trials classified as Incorrect, PD patients showed more activation than Controls for all identified clusters (p≤0.05 but p=0.09 for SMG). During the Correct-1, PD also had higher activation than Controls in the left cerebellum (CR-VII) and caudate nucleus that yielded a marginal statistical effect (p=0.07 and p=0.06, respectively). Finally, we also found that Controls had more activation than PD patients but only in the PFC in the Correct-5 block (p=0.02; marginal effects were found in the Correct-3 and Correct-4 blocks, p=0.08 and p=0.09, respectively).
Table 3.
Interaction effect.
| Brain regions (BA) | Volume |
F values |
MNI coordinates |
|||
|---|---|---|---|---|---|---|
| Mean | Max | X | Y | Z | ||
| Cortical | ||||||
| L SMG (40) | 297 | 4.17 | 5.45 | 42 | 48 | 42 |
| R PFC (9) | 243 | 4.24 | 5.11 | −48 | −15 | 39 |
| Precuneus | 216 | 4.05 | 5.09 | 0 | 54 | 54 |
| Subcortical | ||||||
| R Cerebellum (CR-VII) | 405 | 4.73 | 7.66 | −9 | 81 | −36 |
| R Cerebellum (CR-I) | 270 | 4.04 | 4.93 | −30 | 78 | −24 |
| R Caudate (tail) | 297 | 4.8 | 6.86 | −21 | 39 | 9 |
As evident in Fig. 3, we did not find activation clusters in the putamen related to performing the Association task contrary to prior imaging work (Seger and Cincotta, 2005, 2006); we failed to find activation in this region even when lowering the voxel threshold to p≤0.05. To better understand the learning- and rehearsal-related activation in the putamen, we implemented a ROI analysis of that structure bilaterally with the AFNI ROI tool and outputted the results of the two-way ANOVA. We found one cluster with a main effect of Group (9 voxels; x=−24, y=0, z=−6) and one cluster with a main effect of Category (25 voxels x=−12, y=−6, z=−3) but only after lowering the voxel threshold to p≤0.05. Fig. 6A illustrates these clusters with the functional MRI signal (%) for each group across all six trial categories shown in Fig. 6B. Note that PD patients exhibited more activation than Controls (main effect of Group), which was confirmed by a t-test on the functional MRI signal (%) between each group, pooled across categories (t(18)=−3.09 p≤0.01). For the main effect of Category, we calculated the slope of functional MRI signal (%) across the six trial categories, pooled across group, and rejected the null hypothesis of zero slope (t(9)=−3.70 p≤0.005). Despite these apparent learning and rehearsal effects, the activation remained very close to zero within each cluster. We confirmed that the activation cluster of the Group main effect was not significantly different than zero for the PD group (t(9)=0.98, p=0.35) and negative for the Control group (t(9)=−3.2, p=0.01). Concerning the main effect of Category, only the activation occurring during the Incorrect trials could be deemed significantly different than zero (p=0.02; p=0.08 for the Correct-3; p>0.15 for the others). The interaction revealed four scattered clusters with no more than 3 contiguous voxels (we do not report these). These results suggest that the putamen had very limited involvement, if any, during the Association task.
Fig. 6.
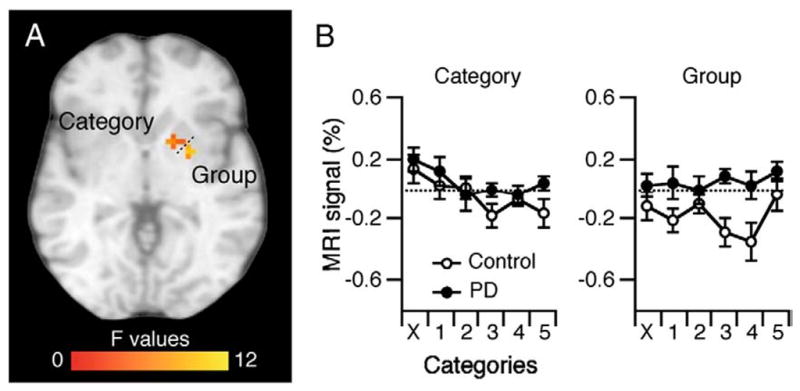
Putamen ROI analysis. We found clusters within the right putamen with a main effect of Group and a main effect of Category (p≤0.05).
Discussion
Here, we aimed to investigate a basal ganglia role in S–R learning since although imaging studies found learning-related activation in these structures and their associated neocortical targets (e.g., Seger and Cincotta, 2005; Seger and Cincotta, 2006), patients with PD often do not exhibit S–R learning deficits (e.g., Canavan et al., 1989; Tucker et al., 1996). We found brain activation in both the Control and PD groups in the fronto-striatal networks (Fig. 4), that is in the head of the caudate nucleus and PFC (BA9), that decreased as rules became learned, suggesting a more prominent role in uncovering and forming new rules than rehearsing known rules. Furthermore, since PD patients presented with essentially “normal” learning performance, the changes in brain activation observed in the PD group that occurred specifically during rule formation (Fig. 5) also indicate subtle but important contribution by basal ganglia–neocortical circuits to establish new sensory–motor linkages.
Basal ganglia and associative learning
Each group recruited the head of the caudate nucleus, PFC (BA9), and parietal cortex (SMG, precuneus) during performance of the Associative tasks, and these regions are part of an executive loop interconnected via cortico-striatal loops (Alexander et al., 1986; Lawrence et al., 1998; Seger, 2008). Imaging and electrophysiological studies have repeatedly reported activation in these regions during S–R learning (Boettiger and D’Esposito, 2005; Brovelli et al., 2008; Eliassen et al., 2003; Grol et al., 2006; Hadj-Bouziane and Boussaoud, 2003; Schultz et al., 2003; Seger and Cincotta, 2005, 2006; Toni and Passingham, 1999; Toni et al., 2001b). It might appear surprising to find activation in the caudate nucleus in the PD cohort, but consider that this group of patients had mild disease and that the caudate nucleus is not typically as dopamine-depleted as the putamen early in the disease (Kish et al., 1988; Morrish et al., 1998). More importantly, all these regions showed high level of activation in the early learning phase that decreased as knowledge of the S–R associations emerged (Delgado et al., 2005; Grol et al., 2006; Seger and Cincotta, 2006). This pattern of activation suggests an involvement of basal ganglia circuitry in rule formation, rather than rehearsing well learned rules or forming long-term memories (Boettiger and D’Esposito, 2005; Graybiel, 1998; Toni and Passingham, 1999; Toni et al., 2001b). This suggestion is supported by recent imaging studies showing caudate nucleus activation related to reinforcement of movements that led to reward, rather than process of reward per se, and that this pattern of activation decreased as the contingencies were learned (Delgado et al., 2005; Tricomi et al., 2004). Therefore, the caudate nucleus and its neocortical targets could identify and link stimuli with specific movements that then lead to reward.
Concerning the putamen and its neocortical target PM that form a motor loop (Alexander et al., 1986; Lawrence et al., 1998; Seger, 2008), we found no evidence to support their involvement in S–R learning. Although prior associative studies had reported activity in putamen or PM (Boettiger and D’Esposito, 2005; Brasted and Wise, 2004; Buch et al., 2006; Seger and Cincotta, 2005, 2006), their role may differ from that of the caudate–neocortical circuits. These structures may have more, or somewhat similar, involvement in executing well learned rules than learning them per se (Boettiger and D’Esposito, 2005; Buch et al., 2006; Grol et al., 2006; Mitz et al., 1991; Seger, 2008; Toni et al., 2001a). Also, since these structures have so much involvement in movement selection and execution, it may be harder to tease apart learning- from movement-related involvement in this circuit than in other brain areas. Note that some imaging studies that reported putamen activation contrasted learning with a no movement condition (Seger and Cincotta, 2005, 2006), whereas we and others that did not find putamen activation used a Movement Control task (Boettiger and D’Esposito, 2005). Thus, the contribution to S–R learning of the putamen-neocortical circuit remains doubtful. A longer learning paradigm with a retention test of well learned S–R, as well as a well-designed control task could unveil their role more definitively.
We also found activation in the ventral striatum that showed an increase of activation and in the ACC that showed decreased activation. The ventral striatum has strong feedback-related activity (Delgado et al., 2000, 2005; Schultz, 2007) which we may not have fully dissociated from the stimulus presentation. So, the steady increase of activation we found may relate to the processing of positive feedback, and elderly seem to respond more to feedback then young adults (Schott et al., 2007). The ACC has often been associated with conflict monitoring, error processing, and event outcome evaluation based on prior experience (Botvinick et al., 2004). Eliassen et al. (2003) found a cluster in the same ACC region as here that indicated more activation for incorrect than correct trials, a pattern of results that resembled ours. Thus, our results of learning-related decrease of activation in ACC fits well with its traditional role, as conflict and error decreased as learning emerged.
Finally, an unexpected yet interesting finding relates to the bilateral activation of the cerebellum (CR-VI) that we found in both groups. Imaging studies have rarely reported cerebellar activation during associative learning (Seger and Cincotta, 2006) and cerebellum lesions in monkeys have not caused associative learning deficits (Nixon and Passingham, 1999, 2000). However, studies in human with cerebellar diseases have reported associative learning deficits (Canavan et al., 1994; Drepper et al., 1999; Tucker et al., 1996). In these human studies, participants included older adults within the same age range as our participants, whereas imaging studies, and most probably monkey studies, included younger participants. This suggests an age-dependent shift in the brain representation of S–R, perhaps from a fronto-striatal to a cerebellar–parietal network (Fera et al., 2005).
PD affects early learning-related brain activation
Although, PD does not completely abolish basal ganglia functioning, system level compensatory mechanisms can provide insights how this set of structures mediates S–R learning in humans. We reasoned that compensatory mechanisms would emerge when learning-related computations required basal ganglia–neocortical circuits. We found that compared to Controls, PD patients showed more activation in the fronto-parietal network (precuneus, SMG, PFC), cerebellum (CR-VII, I), and tail of the caudate nucleus (Fig. 5) as shown in prior imaging work (Wu and Hallett, 2005; Introduction). However, we have found that these compensatory mechanisms occurred exclusively in the early learning stage, that is while performing trials classified as Incorrect and Correct-1. Once the visual–motor rules became formed, from Correct-2 and on, brain activation patterns in PD patients did not differ substantially from Controls. This represents a rather novel finding that PD compensatory mechanisms are plastic and malleable. Prior imaging work in PD had not necessarily assessed how and whether these compensatory mechanisms adapted as behavior changed (Cools et al., 2007; Schott et al., 2007; Wu and Hallett, 2005). We interpret these compensatory mechanisms as evidence for early involvement of basal ganglia circuits in associative learning.
The largest over-recruitment occurred while PD performed the trials classified as Incorrect. PD patients on medication, as here, appear to learn less from incorrect than correct associations (Frank et al., 2004). Our findings of over-recruitment during the Incorrect trials support these results as it may have helped PD to learn as well as Controls in this difficult learning phase. The fact that the PD group had the same number of Incorrect trials as the Control group corroborates that claim. While performing the trials classified as Correct-1, PD had less over-recruitment than in the Incorrect trials, but still had more activation in the cerebellum (CR-VII) and caudate nucleus (tail) than Controls. Afterwards, Controls had more activation than PD but only for the PFC at Correct-5. So, after uncovering the S–R, PD and Controls had an almost similar brain activation pattern. This decreasing pattern of over-recruitment in PD as rules knowledge emerged agrees with the fact that PD patients on medication learn well from correct associations (Frank et al., 2004). In turn, this suggests that basal ganglia pathology did not disrupt brain processing involved in late learning as much as in early learning.
PD patients took their daily medication during the current experimental procedures. In early PD, the dorsal striatum is much more depleted in dopamine (DA) than the ventral striatum (Kish et al., 1988; Morrish et al., 1998). According to an over-dose hypothesis, dopaminergic medication replenishes DA-depleted areas, like the dorsal striatum, but also overdoses non-DA-depleted brain areas, like the ventral striatum (Cools, 2006). PD medication should thus impair the normal modulation of DA. A recent imaging study in PD using a reversal learning task seems to support that claim (Cools et al., 2007). Upon making the last reversal error, PD on medication showed increased activation in ventral striatum, whereas PD off medication showed no activation in ventral striatum; no effect of medication was found in the PFC and dorsal striatum. Here, however, we did not find that PD had more activation than Controls in the ventral or dorsal striatum (Figs. 4, 5). Also, all the clusters we found showed, even in the ventral striatum, strong learning-related modulation which is rather inconsistent with an over-dose hypothesis that would predict sustained activation across learning. Note however that Cools et al. (2007) did not use a learning paradigm as here and their task also differs. We found little ground to suggest that the increased activation in the early learning phase relates solely to PD medication.
Our results do not fully agree with the view that the basal ganglia “train” the PFC (Houk and Wise, 1995; Pasupathy and Miller, 2005). Prior work directly measured the head/body of the caudate and the dlPFC reporting earlier and later involvement in learning, respectively (Pasupathy and Miller, 2005; Seger and Cincotta, 2006). Although we found early activation in the head of the caudate nucleus that decreased across categories, lending support to the view above, we found the same pattern in the left PFC (Fig. 4). If basal ganglia trains PFC we would have expected to find increasing activation in PFC. Perhaps, age had an effect on the pattern of activation among fronto-striatal networks (Fera et al., 2005).
The current results bear upon theoretical approaches to the basal ganglia’s role in motor learning. Doyon and Benali (2005) have proposed that basal ganglia–neocortical circuits participate in motor learning, particularly in acquisition, consolidation and recall of motor sequences but only in the initial processes of sensory–motor adaptation. This scheme has not addressed whether basal ganglia–neocortical circuits participate in associative learning; the current findings and others (e.g., Boettiger and D’Esposito 2005) provide ample evidence that the model of Doyon and Benali (2005) should become extended to include basal ganglia involvement in associative learning, particularly in the early phases of discovering relationships between visual stimuli and appropriate motor responses.
Acknowledgments
This work was supported by the Dr. Ralph and Marian Falk Medical Trust and by the Ittleson Foundation. We thank Drs. Joseph Friedman and Kelvin Chou for recruiting and providing clinical evaluations of the parkinsonian patients and some age-matched controls.
References
- Alexander GE, DeLong MR, Strick PL. Parallel organization of functionally segregated circuits linking basal ganglia and cortex. Annu Rev Neurosci. 1986;9:357–381. doi: 10.1146/annurev.ne.09.030186.002041. [DOI] [PubMed] [Google Scholar]
- Berardelli A, Rothwell JC, Thompson PD, Hallett M. Pathophysiology of bradykinesia in Parkinson’s disease. Brain. 2001;124:2131–2146. doi: 10.1093/brain/124.11.2131. [DOI] [PubMed] [Google Scholar]
- Bezard E, Gross CE, Brotchie JM. Presymptomatic compensation in Parkinson’s disease is not dopamine-mediated. Trends Neurosci. 2003;26:215–221. doi: 10.1016/S0166-2236(03)00038-9. [DOI] [PubMed] [Google Scholar]
- Boettiger CA, D’Esposito M. Frontal networks for learning and executing arbitrary stimulus–response associations. J Neurosci. 2005;25:2723–2732. doi: 10.1523/JNEUROSCI.3697-04.2005. [DOI] [PMC free article] [PubMed] [Google Scholar]
- Botvinick MM, Cohen JD, Carter CS. Conflict monitoring and anterior cingulate cortex: an update. Trends Cogn Sci. 2004;8:539–546. doi: 10.1016/j.tics.2004.10.003. [DOI] [PubMed] [Google Scholar]
- Brainard DH. The psychophysics toolbox. Spat Vis. 1997;10:433–436. [PubMed] [Google Scholar]
- Brasted PJ, Wise SP. Comparison of learning-related neuronal activity in the dorsal premotor cortex and striatum. Eur J Neurosci. 2004;19:721–740. doi: 10.1111/j.0953-816x.2003.03181.x. [DOI] [PubMed] [Google Scholar]
- Brovelli A, Laksiri N, Nazarian B, Meunier M, Boussaoud D. Understanding the neural computations of arbitrary visuomotor learning through fMRI and associative learning theory. Cereb Cortex. 2008;18:1485–1495. doi: 10.1093/cercor/bhm198. [DOI] [PubMed] [Google Scholar]
- Buch ER, Brasted PJ, Wise SP. Comparison of population activity in the dorsal premotor cortex and putamen during the learning of arbitrary visuomotor mappings. Exp Brain Res. 2006;169:69–84. doi: 10.1007/s00221-005-0130-y. [DOI] [PMC free article] [PubMed] [Google Scholar]
- Buhmann C, Glauche V, Sturenburg HJ, et al. Pharmacologically modulated fMRI–cortical responsiveness to levodopa in drug-naive hemiparkinsonian patients. Brain. 2003;126:451–461. doi: 10.1093/brain/awg033. [DOI] [PubMed] [Google Scholar]
- Canavan AG, Passingham RE, Marsden CD, Quinn N, Wyke M, Polkey CE. The performance on learning tasks of patients in the early stages of Parkinson’s disease. Neuropsychologia. 1989;27:141–156. doi: 10.1016/0028-3932(89)90167-x. [DOI] [PubMed] [Google Scholar]
- Canavan AG, Sprengelmeyer R, Diener HC, Homberg V. Conditional associative learning is impaired in cerebellar disease in humans. Behav Neurosci. 1994;108:475–485. doi: 10.1037//0735-7044.108.3.475. [DOI] [PubMed] [Google Scholar]
- Catalan MJ, Ishii K, Honda M, Samii A, Hallett M. A PET study of sequential finger movements of varying length in patients with Parkinson’s disease. Brain. 1999;122:483–495. doi: 10.1093/brain/122.3.483. [DOI] [PubMed] [Google Scholar]
- Cohen MS. Parametric analysis of fMRI data using linear systems methods. Neuroimage. 1997;6:93–103. doi: 10.1006/nimg.1997.0278. [DOI] [PubMed] [Google Scholar]
- Cools R. Dopaminergic modulation of cognitive function-implications for L-DOPA treatment in Parkinson’s disease. Neurosci Biobehav Rev. 2006;30:1–23. doi: 10.1016/j.neubiorev.2005.03.024. [DOI] [PubMed] [Google Scholar]
- Cools R, Lewis SJ, Clark L, Barker RA, Robbins TW. L-DOPA disrupts activity in the nucleus accumbens during reversal learning in Parkinson’s disease. Neuropsychopharmacology. 2007;32:180–189. doi: 10.1038/sj.npp.1301153. [DOI] [PubMed] [Google Scholar]
- Cox RW. AFNI: software for analysis and visualization of functional magnetic resonance neuroimages. Comput Biomed Res. 1996;29:162–173. doi: 10.1006/cbmr.1996.0014. [DOI] [PubMed] [Google Scholar]
- Cox RW, Hyde JS. Software tools for analysis and visualization of fMRI data. NMR Biomed. 1997;10:171–178. doi: 10.1002/(sici)1099-1492(199706/08)10:4/5<171::aid-nbm453>3.0.co;2-l. [DOI] [PubMed] [Google Scholar]
- Delgado MR, Nystrom LE, Fissell C, Noll DC, Fiez JA. Tracking the hemodynamic responses to reward and punishment in the striatum. J Neurophysiol. 2000;84:3072–3077. doi: 10.1152/jn.2000.84.6.3072. [DOI] [PubMed] [Google Scholar]
- Delgado MR, Miller MM, Inati S, Phelps EA. An fMRI study of reward-related probability learning. Neuroimage. 2005;24:862–873. doi: 10.1016/j.neuroimage.2004.10.002. [DOI] [PubMed] [Google Scholar]
- Doyon J, Benali H. Reorganization and plasticity in the adult brain during learning of motor skills. Curr Opin Neurobiol. 2005;15:161–167. doi: 10.1016/j.conb.2005.03.004. [DOI] [PubMed] [Google Scholar]
- Drepper J, Timmann D, Kolb FP, Diener HC. Non-motor associative learning in patients with isolated degenerative cerebellar disease. Brain. 1999;122:87–97. doi: 10.1093/brain/122.1.87. [DOI] [PubMed] [Google Scholar]
- Duvernoy HM. The Human Brain: Surface, Three-Dimensional Sectional Anatomy and MRI. Springer-Verlag; New York: 1991. [Google Scholar]
- Eliassen JC, Souza T, Sanes JN. Experience-dependent activation patterns in human brain during visual–motor associative learning. J Neurosci. 2003;23:10540–10547. doi: 10.1523/JNEUROSCI.23-33-10540.2003. [DOI] [PMC free article] [PubMed] [Google Scholar]
- Faul F, Erdfelder E, Lang AG, Buchner A. G*Power 3: a flexible statistical power analysis program for the social, behavioral, and biomedical sciences. Behav Res Methods. 2007;39:175–191. doi: 10.3758/bf03193146. [DOI] [PubMed] [Google Scholar]
- Fera F, Weickert TW, Goldberg TE, et al. Neural mechanisms underlying probabilistic category learning in normal aging. J Neurosci. 2005;25:11340–11348. doi: 10.1523/JNEUROSCI.2736-05.2005. [DOI] [PMC free article] [PubMed] [Google Scholar]
- Frank MJ, Seeberger LC, O’reilly RC. By carrot or by stick: cognitive reinforcement learning in parkinsonism. Science. 2004;306:1940–1943. doi: 10.1126/science.1102941. [DOI] [PubMed] [Google Scholar]
- Galvan A, Hare TA, Davidson M, et al. The role of ventral frontostriatal circuitry in reward-based learning in humans. J Neurosci. 2005;25:8650–8656. doi: 10.1523/JNEUROSCI.2431-05.2005. [DOI] [PMC free article] [PubMed] [Google Scholar]
- Graybiel AM. The basal ganglia and chunking of action repertoires. Neurobiol Learn Mem. 1998;70:119–136. doi: 10.1006/nlme.1998.3843. [DOI] [PubMed] [Google Scholar]
- Grol MJ, de Lange FP, Verstraten FA, Passingham RE, Toni I. Cerebral changes during performance of overlearned arbitrary visuomotor associations. J Neurosci. 2006;26:117–125. doi: 10.1523/JNEUROSCI.2786-05.2006. [DOI] [PMC free article] [PubMed] [Google Scholar]
- Hadj-Bouziane F, Boussaoud D. Neuronal activity in the monkey striatum during conditional visuomotor learning. Exp Brain Res. 2003;153:190–196. doi: 10.1007/s00221-003-1592-4. [DOI] [PubMed] [Google Scholar]
- Hadj-Bouziane F, Meunier M, Boussaoud D. Conditional visuo-motor learning in primates: a key role for the basal ganglia. J Physiol Paris. 2003;97:567–579. doi: 10.1016/j.jphysparis.2004.01.014. [DOI] [PubMed] [Google Scholar]
- Halsband U, Freund HJ. Premotor cortex and conditional motor learning in man. Brain. 1990;113:207–222. doi: 10.1093/brain/113.1.207. [DOI] [PubMed] [Google Scholar]
- Halsband U, Passingham RE. Premotor cortex and the conditions for movement in monkeys (Macaca fascicularis) Behav Brain Res. 1985;18:269–277. doi: 10.1016/0166-4328(85)90035-x. [DOI] [PubMed] [Google Scholar]
- Haslinger B, Erhard P, Kampfe N, et al. Event-related functional magnetic resonance imaging in Parkinson’s disease before and after levodopa. Brain. 2001;124:558–570. doi: 10.1093/brain/124.3.558. [DOI] [PubMed] [Google Scholar]
- Houk JC, Wise SP. Distributed modular architectures linking basal ganglia, cerebellum, and cerebral cortex: their role in planning and controlling action. Cereb Cortex. 1995;5:95–110. doi: 10.1093/cercor/5.2.95. [DOI] [PubMed] [Google Scholar]
- Kish SJ, Shannak K, Hornykiewicz O. Uneven pattern of dopamine loss in the striatum of patients with idiopathic Parkinson’s disease. Pathophysiologic and clinical implications. N Engl J Med. 1988;318:876–880. doi: 10.1056/NEJM198804073181402. [DOI] [PubMed] [Google Scholar]
- Kwong KK, Belliveau JW, Chesler DA, et al. Dynamic magnetic resonance imaging of human brain activity during primary sensory stimulation. Proc Natl Acad Sci U S A. 1992;89:5675–5679. doi: 10.1073/pnas.89.12.5675. [DOI] [PMC free article] [PubMed] [Google Scholar]
- Lawrence AD, Sahakian BJ, Robbins TW. Cognitive functions and corticos-triatal circuits: insights from Huntington’s disease. Trends Cog Sci. 1998;2:379–388. doi: 10.1016/s1364-6613(98)01231-5. [DOI] [PubMed] [Google Scholar]
- Mentis MJ, Dhawan V, Nakamura T, et al. Enhancement of brain activation during trial-and-error sequence learning in early PD. Neurology. 2003;60:612–619. doi: 10.1212/01.wnl.0000044154.92143.dc. [DOI] [PubMed] [Google Scholar]
- Mitz AR, Godschalk M, Wise SP. Learning-dependent neuronal activity in the premotor cortex: activity during the acquisition of conditional motor associations. J Neurosci. 1991;11:1855–1872. doi: 10.1523/JNEUROSCI.11-06-01855.1991. [DOI] [PMC free article] [PubMed] [Google Scholar]
- Mollion H, Ventre-Dominey J, Dominey PF, Broussolle E. Dissociable effects of dopaminergic therapy on spatial versus non-spatial working memory in Parkinson’s disease. Neuropsychologia. 2003;41:1442–1451. doi: 10.1016/s0028-3932(03)00114-3. [DOI] [PubMed] [Google Scholar]
- Morrish PK, Rakshi JS, Bailey DL, Sawle GV, Brooks DJ. Measuring the rate of progression and estimating the preclinical period of Parkinson’s disease with [18F]dopa PET. J Neurol Neurosurg Psychiatry. 1998;64:314–319. doi: 10.1136/jnnp.64.3.314. [DOI] [PMC free article] [PubMed] [Google Scholar]
- Nixon PD, Passingham RE. The cerebellum and cognition: cerebellar lesions do not impair spatial working memory or visual associative learning in monkeys. Eur J Neurosci. 1999;11:4070–4080. doi: 10.1046/j.1460-9568.1999.00825.x. [DOI] [PubMed] [Google Scholar]
- Nixon PD, Passingham RE. The cerebellum and cognition: cerebellar lesions impair sequence learning but not conditional visuomotor learning in monkeys. Neuropsychologia. 2000;38:1054–1072. doi: 10.1016/s0028-3932(99)00138-4. [DOI] [PubMed] [Google Scholar]
- Nixon PD, McDonald KR, Gough PM, Alexander IH, Passingham RE. Cortico-basal ganglia pathways are essential for the recall of well-established visuomotor associations. Eur J Neurosci. 2004;20:3165–3178. doi: 10.1111/j.1460-9568.2004.03788.x. [DOI] [PubMed] [Google Scholar]
- Packard MG, Knowlton BJ. Learning and memory functions of the basal ganglia. Annu Rev Neurosci. 2002;25:563–593. doi: 10.1146/annurev.neuro.25.112701.142937. [DOI] [PubMed] [Google Scholar]
- Pasupathy A, Miller EK. Different time courses of learning-related activity in the prefrontal cortex and striatum. Nature. 2005;433:873–876. doi: 10.1038/nature03287. [DOI] [PubMed] [Google Scholar]
- Pelli DG. The VideoToolbox software for visual psychophysics: transforming numbers into movies. Spat Vis. 1997;10:437–442. [PubMed] [Google Scholar]
- Pillon B, Deweer B, Vidailhet M, et al. Is impaired memory for spatial location in Parkinson’s disease domain specific or dependent on ‘strategic’ processes? Neuropsychologia. 1998;36:1–9. doi: 10.1016/s0028-3932(97)00102-4. [DOI] [PubMed] [Google Scholar]
- Price CJ, Crinion J, Friston KJ. Design and analysis of fMRI studies with neurologically impaired patients. J Magn Reson Imaging. 2006;23:816–826. doi: 10.1002/jmri.20580. [DOI] [PubMed] [Google Scholar]
- Romero MC, Bermudez MA, Vicente AF, Perez R, Gonzalez F. Activity of neurons in the caudate and putamen during a visuomotor task. Neuroreport. 2008;19:1141–1145. doi: 10.1097/WNR.0b013e328307c3fc. [DOI] [PubMed] [Google Scholar]
- Sabatini U, Boulanouar K, Fabre N, et al. Cortical motor reorganization in akinetic patients with Parkinson’s disease: a functional MRI study. Brain. 2000;123:394–403. doi: 10.1093/brain/123.2.394. [DOI] [PubMed] [Google Scholar]
- Schmahmann JD, Doyon J, McDonald D, et al. Three-dimensional MRI atlas of the human cerebellum in proportional stereotaxic space. Neuroimage. 1999;10:233–260. doi: 10.1006/nimg.1999.0459. [DOI] [PubMed] [Google Scholar]
- Schott BH, Niehaus L, Wittmann BC, et al. Ageing and early-stage Parkinson’s disease affect separable neural mechanisms of mesolimbic reward processing. Brain. 2007;130:2412–2424. doi: 10.1093/brain/awm147. [DOI] [PubMed] [Google Scholar]
- Schultz W. Multiple dopamine functions at different time courses. Annu Rev Neurosci. 2007;30:259–288. doi: 10.1146/annurev.neuro.28.061604.135722. [DOI] [PubMed] [Google Scholar]
- Schultz W, Tremblay L, Hollerman JR. Changes in behavior-related neuronal activity in the striatum during learning. Trends Neurosci. 2003;26:321–328. doi: 10.1016/S0166-2236(03)00122-X. [DOI] [PubMed] [Google Scholar]
- Seger CA. How do the basal ganglia contribute to categorization? Their roles in generalization, response selection, and learning via feedback. Neurosci Biobehav Rev. 2008;32:265–278. doi: 10.1016/j.neubiorev.2007.07.010. [DOI] [PMC free article] [PubMed] [Google Scholar]
- Seger CA, Cincotta CM. The roles of the caudate nucleus in human classification learning. J Neurosci. 2005;25:2941–2951. doi: 10.1523/JNEUROSCI.3401-04.2005. [DOI] [PMC free article] [PubMed] [Google Scholar]
- Seger CA, Cincotta CM. Dynamics of frontal, striatal, and hippocampal systems during rule learning. Cereb Cortex. 2006;16:1546–1555. doi: 10.1093/cercor/bhj092. [DOI] [PubMed] [Google Scholar]
- Smith SM, Jenkinson M, Woolrich MW, et al. Advances in functional and structural MR image analysis and implementation as FSL. Neuroimage. 2004;23 (Suppl 1):S208–S219. doi: 10.1016/j.neuroimage.2004.07.051. [DOI] [PubMed] [Google Scholar]
- Toni I, Passingham RE. Prefrontal–basal ganglia pathways are involved in the learning of arbitrary visuomotor associations: a PET study. Exp Brain Res. 1999;127:19–32. doi: 10.1007/s002210050770. [DOI] [PubMed] [Google Scholar]
- Toni I, Rushworth MF, Passingham RE. Neural correlates of visuomotor associations. Spatial rules compared with arbitrary rules. Exp Brain Res. 2001a;141:359–369. doi: 10.1007/s002210100877. [DOI] [PubMed] [Google Scholar]
- Toni I, Ramnani N, Josephs O, Ashburner J, Passingham RE. Learning arbitrary visuomotor associations: temporal dynamic of brain activity. Neuroimage. 2001b;14:1048–1057. doi: 10.1006/nimg.2001.0894. [DOI] [PubMed] [Google Scholar]
- Tricomi EM, Delgado MR, Fiez JA. Modulation of caudate activity by action contingency. Neuron. 2004;41:281–292. doi: 10.1016/s0896-6273(03)00848-1. [DOI] [PubMed] [Google Scholar]
- Tucker J, Harding AE, Jahanshahi M, et al. Associative learning in patients with cerebellar ataxia. Behav Neurosci. 1996;110:1229–1234. doi: 10.1037//0735-7044.110.6.1229. [DOI] [PubMed] [Google Scholar]
- Turner RS, Grafton ST, McIntosh AR, DeLong MR, Hoffman JM. The functional anatomy of parkinsonian bradykinesia. Neuroimage. 2003;19:163–179. doi: 10.1016/s1053-8119(03)00059-4. [DOI] [PubMed] [Google Scholar]
- Wise SP, Murray EA. Role of the hippocampal system in conditional motor learning: mapping antecedents to action. Hippocampus. 1999;9:101–117. doi: 10.1002/(SICI)1098-1063(1999)9:2<101::AID-HIPO3>3.0.CO;2-L. [DOI] [PubMed] [Google Scholar]
- Wu T, Hallett M. A functional MRI study of automatic movements in patients with Parkinson’s disease. Brain. 2005;128:2250–2259. doi: 10.1093/brain/awh569. [DOI] [PubMed] [Google Scholar]
- Zach N, Inbar D, Grinvald Y, Bergman H, Vaadia E. Emergence of novel representations in primary motor cortex and premotor neurons during associative learning. J Neurosci. 2008;28:9545–9556. doi: 10.1523/JNEUROSCI.1965-08.2008. [DOI] [PMC free article] [PubMed] [Google Scholar]