Abstract
Methods were developed to perform precipitation photopolymerization of PEG-diacrylate. Previously, co-monomers have been added to PEG when precipitation polymerization was desired. In the present method, the LCST of the PEG itself was lowered by addition of the kosmotropic salt sodium sulfate to an aqueous solution. Typical of a precipitation polymerization, small microparticles or microspheres (1–5 micron) resulted with relatively low polydispersity. However, aggregate formation was often severe, presumably due to a lack of stabilization of the phase-separated colloids. Microparticles were also produced by copoymerization of PEG-diacrylate with acrylic acid or aminoethylmethacrylate. The co-monomers affected the zeta potential of the formed microparticles, but not the size. The carboxyl groups of acrylic acid-containing PEG microparticles were activated and scaffolds were formed by mixing with amine-containing PEG microparticles. Although the scaffolds were relatively weak, human hepatoma cells showed excellent viability when present during microparticle crosslinking.
Keywords: Precipitation polymerization, poly(ethylene glycol), hydrogel, microsphere, microparticle, tissue engineering scaffold
Introduction
Microparticles made of polyethylene glycol may help to enable the production of novel macroporous scaffolds and drug delivery vehicles. Hydrogel microparticles have previously been produced by a variety of means, such as suspension polymerization, dispersion/precipitation polymerization, as well as mechanical means such droplet generators, micromolding, or photopatterning.1, 2 Solution-phase methods of microparticle formation are advantageous due to their scalability. The various solution phase methods may be categorized in part by the locations of the monomer and initiator in the various phases present during polymerization.3, 4 In emulsion polymerizations, the monomer and initiator are in different phases, while in suspension polymerizations, the monomer and initiator are in the same phase of a two phase system. Precipitation polymerizations occur in an initially homogenous system, with the monomers soluble throughout the reaction, but the formed polymer is insoluble in the solvent. During polymerization, phase separation of the formed polymers produces discrete particles. Dispersion polymerization is a precipitation polymerization in the presence of a stabilizer that limits coalescence of the particles.4 Suspension polymerizations tend to produce larger particles with larger size dispersion compared to emulsion or dispersion polymerizations.5
Hennick and colleagues previously described the production of microspheres from poly(ethylene glycol)-diacrylate (PEG-DAc) by a suspension polymerization in an aqueous two phase PEG/dextran system.6, 7 Other aqueous two phase systems have been used to produce PEG microspheres by free radical-mediated suspension polymerization, for example, in sodium chloride, 8, 9 or magnesium sulfate solutions6, 10. A variety of water-in-oil suspension polymerization schemes has also been used to produce PEG microspheres via free radical crosslinking. 8, 11–14
Dispersion/precipitation polymerization in aqueous systems has been used with a variety of hydrophilic monomers, often resulting in particles with low size dispersion. Precipitation polymerization was used to produce poly(HEMA) micropheres by Rembaum et al. in 1976,15 and poly(NIPAAm) microspheres by Pelton and Chibante in 1986.16 Microgels of polyacrylamide were produced by precipitation polymerization in various alcohols, using low molecular weight PEG-monoacrylate as a steric stabilizer17, 18 or methacrylic acid as an electrostatic stabilizer.19 Peppas and colleagues demonstrated that similar reaction conditions may be used to copolymerize NIPAAm and PEG-DAc.20–22 PEG/NIPAAm microgels were also produced by Lyon and colleagues, which have been used as surface coatings23, 24 and for a variety of other applications25.
Recently, our group demonstrated that micron-sized 100% PEG microspheres may be produced by timing gelation to occur soon after a thermally induced phase separation in the absence of mixing.26–28 Phase separation occurs just above room temperature due to the presence of sodium sulfate. Following phase separation, the PEG-rich domains start out initially quite small, but increase in size due to coarsening, e.g. by coalescence or Ostwald ripening. Gelation halts coarsening, locking in whatever domain structure was present at that time, which in our case consisted of droplets. The method is similar to the phase inversion process used to produce porous membranes, in which phase separation is typically induced by changing the solvent, and then halted by vitrification, crystallization or gelation.29 Thus, we refer to this method of microsphere production as a phase inversion polymerization. The method differs from suspension polymerization in that coarsening by coalescence or Ostwald ripening is not counteracted by rapid mixing and/or surfactants. In a phase inversion polymerization, the size of the microspheres is determined by the balance between the time required to reach the gel point and the kinetics of coarsensing. As such, small particles (1–10 microns) result if the gel point is reached soon after phase separation, a size range that is difficult to reach with suspension polymerization without the use of large amounts of surfactants or sonication.3
Phase inversion polymerization was previously performed using reactive multi-arm PEGs and we asked if the process was amenable to chain growth polymerizations. Chain growth polymerizations, such as the widely used free radical photopolymerization of PEG-DAc,30 add monomers to a growing polymer chain, contrasted with the previously used step growth polymerization where chains of any size may react with each other. Microparticle formation with PEG-DAc was possible, but resulted in a bimodal size distribution, probably due to concomitant phase inversion and precipitation polymerizations. Sodium sulfate concentrations were lowered to ensure that only a precipitation polymerization occurred. Conditions were found in which precipitation polymerization occurred without phase inversion polymerization. Precipitation polymerization may be quite useful on its own, and the nature of the precipitation polymerization was further explored. Use of the PEG microparticles in the formation of scaffolds in the presence of cells was also tested.
Methods
Unless otherwise stated, all reagents were from Sigma-Aldrich
Fabrication of PEG microparticles with acrylic acid using visible light photoinitiation
Solutions of PEG-DAc (mol. wt. 3400 and 35,000) were prepared at 20% (w/v) in 115 mM triethanolamine (TEOA) in Dulbecco’s phosphate-buffered saline (D-PBS; Pierce Chemical) and sterile filtered with 0.22 µm syringe filters (Millipore). Acrylic acid and N-vinylpyrrolidone (NVP) were added to the PEG-DAc solutions, each at 69 mol% relative to PEG molecules. The solution was diluted to 2% PEG-DAc at 37°C with 40 µM Eosin Y in D-PBS, and various concentrations of sodium sulfate. The solutions were photopolymerized for 2 min using a Xenon arc lamp (Genzyme Focal Seal LS1000, filtered at 480–520 nm). Microparticles were then buffer exchanged by centrifugation in D-PBS pH 7.4 or 10mM 2-[N-morpholino] ethanesulfonic acid (MES) at pH 6.0 3× to remove the sodium sulfate.
Fabrication of microparticles using UV photoinitiation
A UV photoinitiator 2,2-dimethoxy-2-phenylacetophenone in NVP (DMPAP; 300 mg/mL) was added to a 20% PEG-DAc stock solution. This solution was then centrifuged at maximum speed in an Eppendorf centrifuge at 16,100 g for 5 min to remove bubbles from the samples. The listed concentration of sodium sulfate was then added to the solution to a final PEG-DAc (mol. wt. 3000 or 3400) concentration of 2% and DMPAP concentration of 30 mg/mL. Solutions were photopolymerized for 30–60 s using a 365 nm longwave ultraviolet light (Spectronics Corporation, Westbury NY). Alternatively, Irgacure 2959 was used as the UV photoinitiator at a final concentration of 0.5% (w/v) without the centrifugation step and at 525 mM sodium sulfate. For Irgacure 2959, an ADAC Cure Spot 50 lamp (2.5 mW/cm2 at 365 nm) was used.
Microparticle characterization
The areas of individual microparticles were measured by manually tracing the outer edge. A nominal radius was then calculated from the projected area of the microparticle. Microparticles were counted on an Olympus X71 using an Olympus SLCPlanFL 40×/0.55 phase contrast objective or on a Zeiss Axiovert 200M using a Plan-Neofluar 100×/1.30 oil immersion objective in DIC mode. Polydispersity index was calculated as:
where Vi is the volume of microparticle i and N is the total number of microparticles. If the microparticles were aggregated, the diameters of the constituent microparticles was measured, not the diameter of the aggregate. To determine microparticle yield, microparticles were washed and centrifuged in DI water three times. The microparticles were then freeze-dried and the remaining mass weighed. Zeta potentials were measured in 10 mM sodium phosphate, pH 7.4 by dynamic light scattering (DLS; 90PLUS Particle Size Analyzer, Brookhaven Instruments, Holtsville, NY).
Fluorescent labeling of PEG-DAc
The thiol on cysteine was reacted with acrylate groups on PEG by a Michael-type reaction.31 Stock solutions of 200 mg/mL PEG-DAc with 69 mol% acrylic acid or 28 mol% 2-aminoethyl methacrylate (AEMA) were incubated with L-cysteine hydrochloride monohydrate at a 100:1 and 1600:1 molar ratio of PEG:cysteine for 30 minutes at 37°C. The amine groups on the cysteine were then reacted with a 10 mg/mL solution of Dylight-488 or Dylight-633 (Pierce) in dimethylformamide 100:1 and 1600:1 molar ratio of PEG:dye in the dark overnight at room temperature.
Formation of Scaffolds
1-ethyl-3-(3-dimethylaminopropyl) carbodiimide hydrochloride (EDC; 15mM) and 100mM N-hydroxysuccinimide (NHS) in MES buffer pH 6.0 was added to PEG-DAc/acrylic acid microparticles formed in 400 mM sodium sulfate using DMAMP and UV photopolymerization. The EDC/NHS/microparticle solutions were rotated at room temperature for 30 min. The microparticles were then buffer exchanged 3× into D-PBS pH 7.4. Activated PEG-DAc/acrylic acid microparticles were mixed with PEG-DAc/AEMA microparticles in a 1:1 volume ratio in a UV/Vis cuvette in D-PBS pH 7.4, with or without 5 × 10⁵ HepG2 cells. Scaffolds were formed by centrifugation at 1000 g for 10 min and then incubated at 37°C for 1 h. After 1 h, a live/dead assay (Invitrogen) was performed by adding 2 µM calcein and 4 µM ethidium bromide and incubating at room temperature for 30 min. EDC/NHS activation of the carboxyl groups in PEG-DAc/acrylic acid microparticles was demonstrated by incubation with poly-L-lysine (PLL 20K Da; 2.6 mg/mL in D-PBS) labeled with fluorescein isocyanate. The microparticles were pelleted in the PLL-FITC solution at 14,100 g for 2 min and incubated for 1 h. The pellets were then washed with 1× D-PBS and imaged.
Confocal Fluorescence Microscopy
Images were recorded using a Nikon Eclipse C1/80i confocal microscope. Scaffolds were imaged in the UV/Vis cuvettes with a 20× objective (0.45 DIC L WD 7.4). EZ-C1 3.70 FreeViewer Software (Nikon Instruments Inc.) was used to render the images in three dimensions.
Rheometry
Scaffolds were formed as above using EDC/NHS activated PEG-DAc/acrylic acid microparticles and PEG-DAc/AEMA microparticles (1:1 volume ratio) in 25 mm diameter glass vials. Storage (G’) and loss (G”) moduli of scaffolds were measured (RFS3 rheometer, Rheometric Scientific, 25 mm parallel plates). Viscoelasticity was quantified within a frequency range of 1–100 rad/s at 5% strain. The stiffness is reported as an average of G* at 10 rad/s.
Statistical analysis
Means ± std. dev. are shown. Significance determined by ANOVA with Scheffe’s posthoc test in MATLAB.
Results
PEG-DAc 3400 was photopolymerized using Eosin Y and triethanolamine with visible light. The polymerization of PEG-DAc required the presence of a co-monomer, N-vinylpyrrolidone (NVP). Concentrations of sodium sulfate were found such that PEG-DAc was soluble at room temperature, but phase separated at 37°C. These conditions were previously used to promote the polycondensation of PEG-octavinylsulfone with PEG-octaamine.26–28 Solutions of PEG-DAc 3400 were incubated at 37°C for different times before being exposed to visible light. The solutions were contained in Eppendorf tubes and heated in a heating block without stirring. Under these conditions, it was expected that the PEG-DAc would phase separate while heating to form small droplets that would become stable microspheres during photopolymerization. If the solutions were exposed to light immediately upon addition to the heating block, small, relatively uniform microparticles were observed (Figure 1A). Longer incubations at 37°C resulted in a bimodal distribution of particle sizes (Figure 1B–E). The set of smaller microparticles had sizes that were quite similar to those obtained with no incubation time prior to exposure to the light. We postulated that this solution had not yet reached the cloud point prior to the start of the photopolymerization, such that a precipitation polymerization resulted. With longer incubations at 37°C prior to the photoinitiation of polymerization, phase separation likely occurred and coarsening progressed to produce PEG-rich droplets with sizes on the order of 10 microns with a relatively high polydispersity. Phase diagrams suggest that some amount of PEG-DAc will remain in the continuous phase.32 The PEG-DAc in the continuous phase may undergo a precipitation polymerization. If Eosin Y is more soluble in the continuous phase, perhaps due to an ion exchange mechanism in the high salt phase, precipitation polymerization may in fact be favored. Using PEG-DAc 35,000, the polymer phase separated at even lower sodium sulfate concentrations. At 350 mM sodium sulfate, the polymer phase separated at room temperature. When photopolymerized, large microspheres were found (10–50 microns), mixed with extremely small, aggregated microparticles (probably less than or about 1 micron but difficult to measure optically). Bimodal size distributions have been previously attributed to the presence of two simultaneous polymerization mechanisms.5 Under the conditions shown in Figure 1, we suspected the presence of a phase inversion polymerization producing larger microspheres and a precipitation polymerization producing smaller microparticles.
Figure 1.
(A–E) A 2% PEG-DAc 3400 solution was brought above the cloud point at room temperature in 700mM sodium sulfate and then incubated at 37°C for various times prior to photopolymerization using visible light. Phase contrast photomicrographs taken with a 20X objective after: (A) 0, (B) 5, (C) 10, (D) 15, (E) 20 min. (F) A 2% PEG-DAc 35,000 solution was brought above the cloud point at room temperature in 350mM sodium sulfate and then raised to 37°C and immediately photopolymerized using visible light.
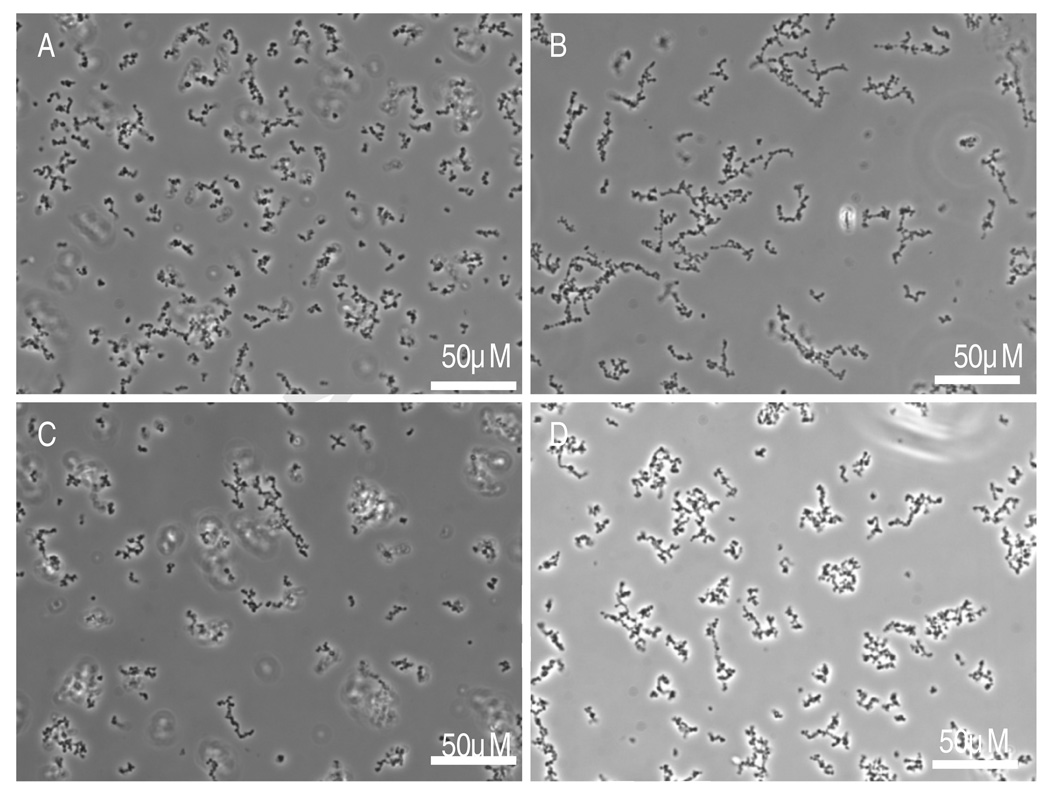
Given the difficulty in controlling two types of polymerization simultaneously, we focused on the precipitation polymerization to produce PEG microparticles. The minimum concentration of sodium sulfate to cause the phase separation of PEG-DAc 3400 at 37°C was found to be about 400 mM. The temperature of the photopolymerizing solution was also measured to ensure that the temperature did not rise following exposure to light. No measurable change in temperature during visible light photopolymerization was observed. A range of sodium sulfate concentrations of 500–530 mM yielded microparticles with mean diameters in the range of 2.59–2.89 microns and polydispersities between 1.27–1.38 (Figure 2; Table 1). Microparticle sizes were measured by manually analyzing images collected on a phase contrast microscope using a 40× objective.
Figure 2.
PEG-DAc microparticles were formed using a 2% PEG-DAc 3400 solution at various sodium sulfate concentrations using visible light photoinitiation. Phase contrast photomicrographs were taken with a 40X objective for sodium sulfate concentrations of: (A) 500 mM, (B) 510 mM, (C) 520 mM, and (D) 530 mM.
Table 1.
Sizing data for PEG-DAc microparticles
| PEG-DAc mol. wt. |
Na2SO4 conc. (mM) |
Photoinitiator | Co-monomers | Mean Diameter (microns)a |
Number of Samples |
Polydispersityb |
|---|---|---|---|---|---|---|
| 3400 | 500 | Eosin Y | NVP | 2.59 | 1 | 1.27 |
| 3400 | 510 | Eosin Y | NVP | 2.71 | 1 | 1.30 |
| 3400 | 520 | Eosin Y | NVP | 2.69 ± 0.016* | 2 | 1.31 |
| 3400 | 530 | Eosin Y | NVP | 2.89 ± 0.04* | 2 | 1.38 |
| 3000 | 525 | Irgacure | none | 1.62 ± 0.07† | 6 | 1.16 |
| 3400 | 525 | Irgacure | none | 2.39 ± 0.05* | 3 | 1.17 |
| 3000 | 525 | Irgacure | acrylic acid | 1.66 ± 0.08† | 6 | 1.19 |
| 3400 | 525 | Irgacure | acrylic acid | 2.64 ± 0.03* | 3 | 1.19 |
Mean of sample mean diameters, with std. dev. of sample mean diameters
Calculated using all sized microparticle data from within each treatment group
p < 0.05 vs. PEG-DAc mol. wt. 3000, Irgacure, no acrylic acid
p < 0.05 vs. PEG-DAc mol. wt. 3400, Irgacure, no acrylic acid
The effect of PEG-DAc concentration was assessed. Typically, PEG-DAc concentrations of 10–23% w/v have been used to form bulk hydrogels.33 To reduce the likelihood of particle aggregation, lower concentrations were used for the precipitation polymerization (1.0–2.4% w/v PEG-DAc). Particle size was not greatly affected by the concentration of PEG over this range (Supplementary Figure 1). However, more aggregation was observed as the PEG-DAc concentration increased. The aggregates could be broken up by pipetting during buffer exchange, and this may have resulted in the formation of strings of microparticles (e.g. in Supplementary Figure 1B & 1D), although the strings may also have formed during photopolymerization, perhaps due to upward flow of the buoyant PEG-rich domains.
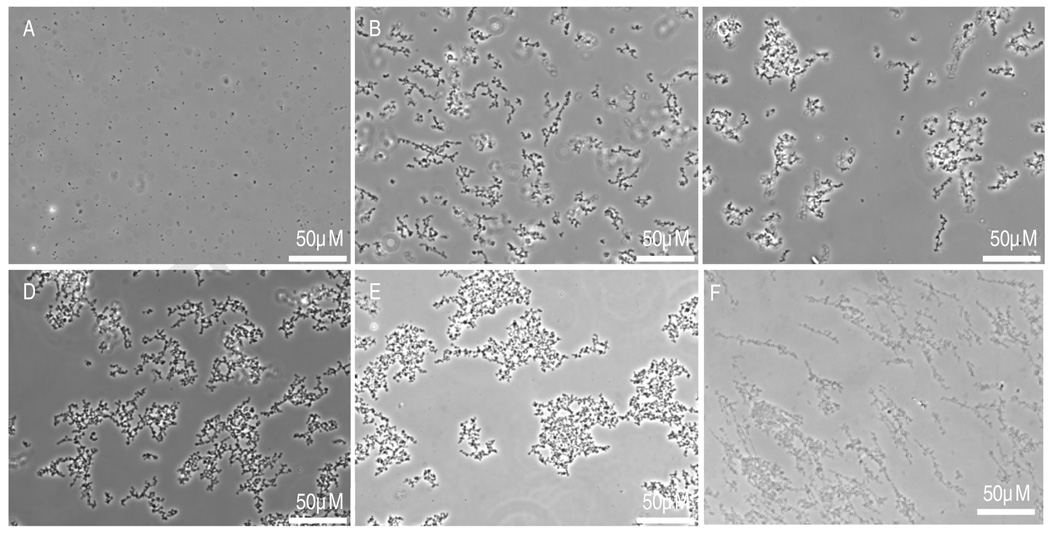
UV photopolymerization was also amenable to precipitation polymerization in sodium sulfate solutions. Using DMPAP as the photoinitiator, microparticles formed over a wide range of sodium sulfate concentrations (350 – 440 mM; Supplementary Figure 2). The lower sodium sulfate concentrations compared to the visible light system were needed to avoid obtaining a bimodal size distribution. This was due to heating during the 5 min centrifugation step that was used with the UV photopolymerization to remove bubbles (a temperature increase of 6.2°C above room temperature was measured; the ‘degassing’ step was later shown to be unnecessary for microparticle formation). At these higher temperatures, PEG-DAc began to phase separate using the original sodium sulfate concentrations, so the salt concentration was lowered. Even at the lower sodium sulfate concentrations, particle size was not greatly affected by the PEG concentration (Figure 3A–E). However, the mass of microparticles produced was affected by the PEG concentration (Figure 4). A 1% starting concentration of PEG-DAc resulted in the recovery of less than 10% of the starting PEG in microparticles. With 2.5% PEG-DAc, about 80% of the PEG was found in microparticles. PEG-DAc 35,000 at a 2% concentration produced microparticles that were aggregated but too small to be accurately measured at 400X magnification (Figure 3F).
Figure 3.
(A–E) PEG-DAc microparticles were formed at various PEG-DAc concentrations with 400mM sodium sulfate using UV photoinitiation with DMPAP. Phase contrast photomicrographs were taken with a 40X objective with PEG-DAc concentrations of: (A) 1.0%, (B) 1.5%, (C) 2.0%, (D) 2.5%, and (E) 3.0% (w/v). (F) PEG-DAc 35,000 in a 2% solution was crosslinked in 300 mM sodium sulfate using UV photoinitiation with DMPAP, producing noticeably smaller microparticles.
Figure 4.
PEG-DAc microparticles were formed at various concentration of PEG-DAc 3400 by UV photoinitiation with DMPAP and acrylic acid as a co-monomer. The formed microparticles were washed with DI water and collected by centrifugation. The mass remaining after freeze drying was compared to the starting mass of PEG-DAc. Error bars are standard deviations, n = 3 for each condition, except 3.0% (n=2). *p < 0.05 versus 2.5%.
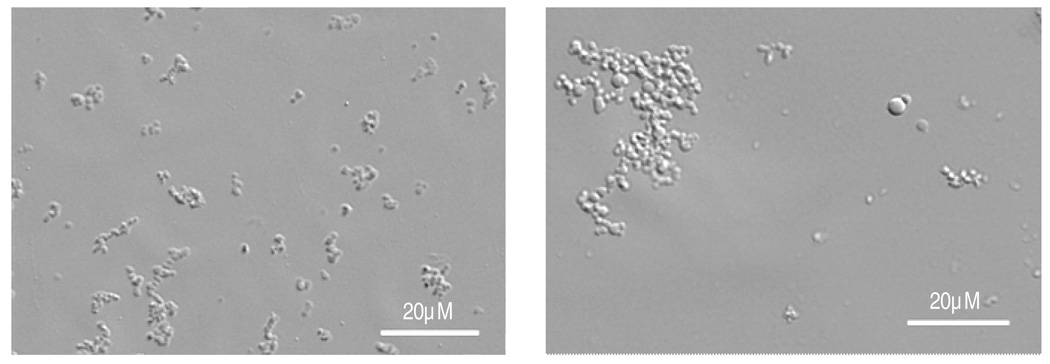
The effects of the molecular weight of PEG-DAc and photoinitiator on microparticle size were further tested. Utilizing 0.5% Irgacure 2959 as the initiator, microparticles were fabricated from PEG-DAc 3000 or PEG-DAc 3400 (Figure 5). The centrifugation degassing step was omitted as it had no effect on the product. Without the additional heating caused by centrifugation, the original sodium sulfate concentration of 525 mM was required for precipitation polymerization. Microparticle sizes were affected by the molecular weight of the PEG-DAc (Table 1). Microparticles formed from PEG-DAc 3000 exhibited a decrease in the average size of the microparticles. However, the addition of 69 mol% of acrylic acid to the PEG-DAc solution did not alter the sizes of microparticles formed using either molecular weight of PEG-DAc (Table 1). PEG-DAc 35,000 produced microparticles that were too small to measure optically but too aggregated to measure by other means, indicating a non-monotonic relationship between PEG-DAc molecular weight and microparticle size.
Figure 5.
Microparticles were formed with different mol. wt. PEG-DAc and Irgacure 2959 as the UV photoinitiator. Microparticle sizes were measured using a 100× objective. Acrylic acid was added to some samples at 69 mol% to allow subsequent activation with EDC. Representative images are shown, the complete dataset is in Table 1. (A) PEG-DAc 3000, no acrylic acid, (B) PEG-DAc 3400, acrylic acid. Scale bars = 20 µm.
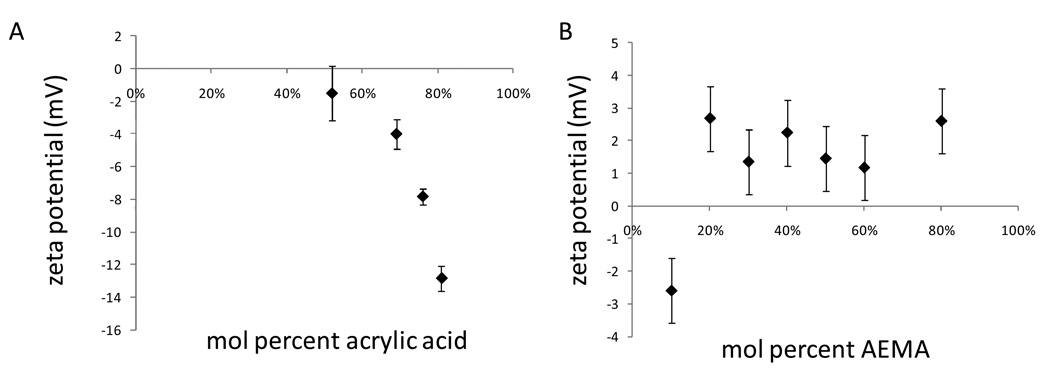
To allow the eventual crosslinking of the PEG microparticles into scaffolds, microparticles were also produced with AEMA. Although the inclusion of charged monomers in the polymers might be expected to affect the precipitation of polymer during crosslinking, the high salt concentration seemed to obviate the effects of the charges, as microparticles sizes were not strongly affected by inclusion of acrylic acid (Table 1) or AEMA (data not shown). The zeta potential of the microparticles did not change linearly with increasing amounts of the charged monomers (Figure 6). Below 50 mol% of acrylic acid, the zeta potential was hardly affected by the monomers. With AEMA, the zeta potential became positive with 20 mol% AEMA or greater, but higher amounts of AEMA did not change the zeta potential. The solubilities of acrylic acid and AEMA in the PEG-rich phases were not measured, but may have contributed to the relative difficulty in incorporating these monomers into the microparticles.
Figure 6.
Zeta potential of PEG-diacrylate microparticles co-polymerized with 2% PEG-DAc 3400 and: (A) acrylic acid, (B) aminoethylmethacrylate (AEMA). n = 2–3 for all samples.
Microparticles containing acrylic acid were activated using EDC and NHS. To test the activation of the carboxylic acid groups, acrylic acid-containing microparticles were incubated with fluorescently labeled poly-L-lysine (PLL). If the acrylic acid groups were activated with EDC/NHS, fluorescent aggregates formed that persisted after washing. Without EDC/NHS activation, the washed microparticles did not aggregate and were only weakly fluorescent after washing (Figure 7).
Figure 7.
Demonstration of the activation of carboxyl groups in PEG-DAc/acrylic acid microparticles by EDC/NHS. Microparticles were reacted with fluorescently labeled poly-L-lysine after pelleting by centrifugation. (A) With EDC/NHS activation, large fluorescent aggregates formed that were stable to washing with PBS. (B) Without EDC/NHS activation, the microparticles remained largely unaggregated and were poorly fluorescent after washing.
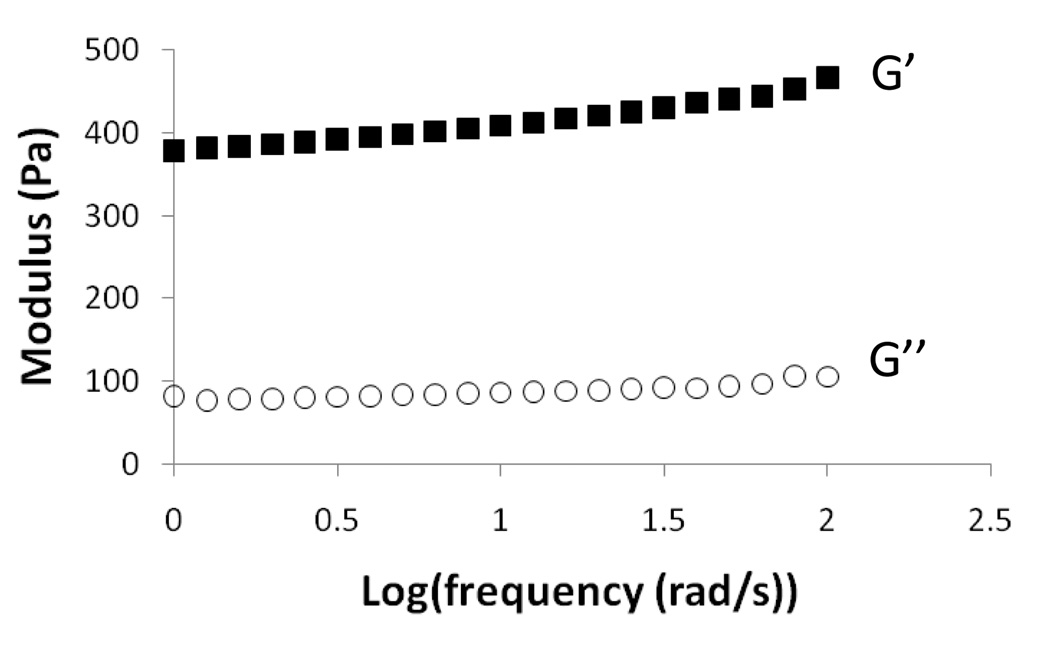
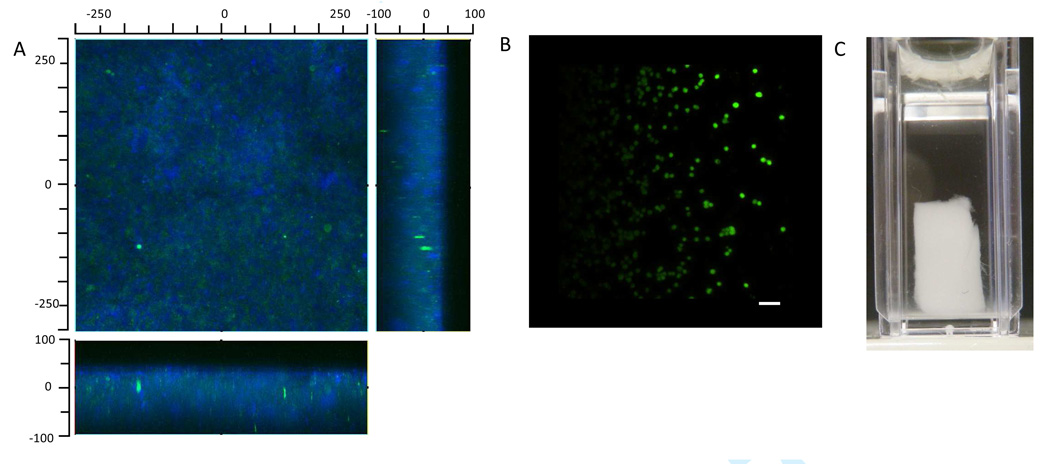
Scaffolds were formed by mixing the two types of microparticles and then compacting them by centrifugation. Scaffold formation was only observed after EDC/NHS activation and mixing with amine-containing microparticles. Rheometry demonstrated that the storage moduli of the scaffolds were about 400 Pa (Figure 8). The scaffolds were imaged by scanning confocal microscopy, with the PEG-acrylic acid microparticles labeled with Dylight 488 and PEG-AEMA microparticles labeled with Dylight 633 (Figure 9A). To test the ability to crosslink the scaffolds in the presence of cells, the scaffolds were assembled in the presence of HepG2 hepatoma cells. A live/dead assay demonstrated good viability of the cells (100% at 1 h post-scaffold formation; Figure 9B). Free standing scaffolds could be obtained by running a spatula or pipette tip between the cuvette wall and the scaffold followed by agitation of the fluid (Figure 9C). The scaffolds were too weak to be handled with forceps.
Figure 8.
Rheometry of scaffold formed by activating carboxyl groups contained in PEG-DAc/acrylic acid microparticles with EDC/NHS, which were then mixed with PEG-DAc/AEMA microparticles and centrifuged to form a crosslinked structure.
Figure 9.
Scaffolds were formed by activating carboxyl groups contained in PEG-DAc/acrylic acid microparticles with EDC/NHS, which were then mixed with PEG-DAc/AEMA microparticles and centrifuged. Scanning confocal microscopy was used to visualize the scaffolds. (A) A scaffold formed with fluorescently labeled microparticles, blue = PEG-DAc/AEMA microparticles, green = PEG-DAc/acrylic acid microparticles. (B) Scaffolds were also formed in the presence of human HepG2 cells. One hour after scaffold fomration, a live/dead assay was performed. Green = live cells, red = dead cells. Scale bar = 50 µm. (C) A macroscopic image of a scaffold in a UV/vis cuvette.
Discussion
The production of particles by dispersion/precipitation polymerization is believed to proceed in general agreement with the model of La Mer from 1950.34 According to La Mer, nucleation commences only as the concentration of formed polymer becomes supersaturated. However, the formation of particles by phase separation relieves the supersaturation. As such, nucleation occurs for only a short period of time and early in the polymerization. Thus, the number of particles remains nearly constant after the initial nucleation phase. Growth of the existing particles proceeds by incorporation of new polymer chains, either in solution or on the surface of the particles, without nucleation of new particles. The particles that were nucleated at the start of the polymerization grow at similar rates, leading to low dispersity in size. In dispersion polymerization, the role of the stabilizer or dispersant is to prevent coalescence, so as to narrow the size distribution. Without a dispersant, i.e. in a precipitation polymerization, flocculation/aggregation is observed, leading in many cases to irregularly shaped particles with a larger distributions in sizes.4
The model of La Mer provides some guidance for the effect of polymerization conditions on the sizes of particles formed by precipitation photopolymerization. In this study, the rate of radical initiation was expected be somewhat constant in the presence of light, assuming sufficient amounts of initiator and near uniform illumination, although neither assumption was tested here. The salt concentration should affect the molecular weight at which the growing polymer chains precipitate. The presence of vinylpyrrolidone/acrylic acid/aminoethylmethacrylate may also affect the solubility of the polymer, although the cloud point of poly(vinylpyrrolidone) is similar to that of PEG35 and the high sodium sulfate concentrations used here may dampen the effects of the charged monomers. Despite the potential impact of these variables on particle size, we found that the mean diameters of the formed particles varied little using three different initiators, a range of PEG-DAc concentrations, various added monomers and a range of salt concentrations. This indicates that the nucleation step was similar under the tested conditions.
The precipitation polymerization of PEG-DAc presented here does not use explicit stabilizer. Electrostatic stabilization will likely be ineffective at the high salt concentrations used in this study. Potentially, the PEG itself may have some effect on the stabilization of the growing particles, perhaps with the shorter PEG chains in the network remaining soluble and providing steric stabilization. Indeed, the molecular weight of the PEG was found to be the most significant determinant of size. Particles were about 35–40% smaller with PEG-DAc 3000 versus PEG-DAc 3400. However, polymerization with PEG-DAc 35,000 resulted in the smallest particles sizes, demonstrating a highly complex relationship between PEG molecular weight and particle size. Although the microparticles had relatively low polydisperities, they aggregated noticeably. The formation of clusters of microparticles indicates inadequate stabilization of particles during crosslinking. Strategies to stabilize the microparticles during polymerization are known,4 but may be quite complex to develop. Compared to the phase inversion polymerization of PEG that we previously published, the current precipitation polymerization led to lower polydispersities and smaller microparticles, but less control over microparticle size and more aggregation.
The PEG-DAc microparticles produced by precipitation polymerization were assembled into modular scaffolds to support the growth of cells in culture. The mechanical strength of the scaffolds was relatively low, with storage moduli of a few hundred Pascals, but could still be handled during routine cell culture. Hennink and colleagues previously demonstrated that oppositely charged dextran microparticles assembled themselves into relatively strong scaffolds without crosslinking if they were mixed in the dry state and rehydrated. Stiffnesses of up to 30,000 Pa were observed.36, 37 This suggests that the current system could be optimized to produce stiffer scaffolds.
Cell adhesion peptides or proteins were not added to the scaffolds, but these molecules could easily be coupled to the EDC/NHS activated microparticles. However, the EDC/NHS chemistry is non-specific and may lead to the coupling of serum proteins to the microparticles or covalent reaction with moieties on the cell surface. Currently, aggregation of microparticles during formation can be quite extensive and is evident in the scanning confocal images. Aggregation leads to a much larger polydispersity and may need to be controlled before the method is generally applicable in cell culture/transplantation applications.
Supplementary Material
Acknowledgments
The authors are grateful to Igor Efimov for use of the confocal microscope and funding from NIH R01HL085364 (DLE) and NSF 0755389 (RKW). We would like to thank Olga Neyman and Daniel Lee for technical assistance.
Footnotes
Supporting Information Available
This information is available free of charge via the Internet at http://pubs.acs.org/.
References
- 1.Khademhosseini A, Langer R. Biomaterials. 2007;28(34):5087–5092. doi: 10.1016/j.biomaterials.2007.07.021. [DOI] [PubMed] [Google Scholar]
- 2.Elbert DL. Acta Biomaterialia. 2011;7(1):31–56. doi: 10.1016/j.actbio.2010.07.028. [DOI] [PMC free article] [PubMed] [Google Scholar]
- 3.Hunkeler D, Candau F, Pichot C, Hemielec AE, Xie TY, Barton J, Vaskova V, Guillot J, Dimonie MV, Reichert KH. ADVANCES IN POLYMER SCIENCE. 1994;112:115–133. [Google Scholar]
- 4.Barrett KEJ. Dispersion polymerization in organic media. London: John Wiley & Sons; 1975. [Google Scholar]
- 5.Arshady R. J. Microencapsulation. 1988;5:101–114. doi: 10.3109/02652048809056474. [DOI] [PubMed] [Google Scholar]
- 6.Franssen O, Hennink WE. International Journal of Pharmaceutics. 1998;168(1):1–7. [Google Scholar]
- 7.Van Thienen TG, Demeester J, De Smedt SC. Int J Pharm. 2008;351(1–2):174–185. doi: 10.1016/j.ijpharm.2007.09.043. [DOI] [PubMed] [Google Scholar]
- 8.Drummond RK, Klier J, Alameda JA, Peppas NA. Macromolecules. 1989;22(9):3816–3818. [Google Scholar]
- 9.Jain S, Yap WT, Irvine DJ. Biomacromolecules. 2005;6(5):2590–2600. doi: 10.1021/bm0503221. [DOI] [PubMed] [Google Scholar]
- 10.Zhang XZ, Chu CC. Colloid and Polymer Science. 2004;282(12):1415–1420. [Google Scholar]
- 11.Meldal M. Tetrahedron Letters. 1992;33(21):3077–3080. [Google Scholar]
- 12.Olabisi RM, Lazard ZW, Franco CL, Hall MA, Kwon SK, Sevick EM, Hipp JA, Davis AR, Davis EA, West J. Tissue Engineering Part A. 2010;16:3727–3736. doi: 10.1089/ten.tea.2010.0234. [DOI] [PMC free article] [PubMed] [Google Scholar]
- 13.Rounds RM, Ibey BL, Beier HT, Pishko MV, Cote GL. Journal of Fluorescence. 2007;17(1):57–63. doi: 10.1007/s10895-006-0143-3. [DOI] [PubMed] [Google Scholar]
- 14.King WJ, Pytel NJ, Ng K, Murphy WL. Macromol Biosci. 2010;10(6):580–584. doi: 10.1002/mabi.200900382. [DOI] [PubMed] [Google Scholar]
- 15.Rembaum A, Yen SPS, Cheong E, Wallace S, Molday RS, Gordon IL, Dreyer WJ. Macromolecules. 1976;9(2):328–336. doi: 10.1021/ma60050a030. [DOI] [PubMed] [Google Scholar]
- 16.Pelton RH, Chibante P. Colloids and Surfaces. 1986;20(3):247–256. [Google Scholar]
- 17.Kim KS, Cho SH, Kim YJ. Polymer Journal. 1993;25(8):847–851. [Google Scholar]
- 18.Kim KS, Cho SH, Shin JS. Polymer Journal. 1995;27(5):508–514. [Google Scholar]
- 19.Kawaguchi H, Fujimoto K, Saito M, Kawasaki T, Urakami Y. Polymer International. 1993;30(2):225–231. [Google Scholar]
- 20.Leobandung W, Ichikawa H, Fukumori Y, Peppas NA. Journal of Controlled Release. 2002;80(1–3):357–363. doi: 10.1016/s0168-3659(02)00028-7. [DOI] [PubMed] [Google Scholar]
- 21.Leobandung W, Ichikawa H, Fukumori Y, Peppas NA. Journal of Applied Polymer Science. 2003;87(10):1678–1684. [Google Scholar]
- 22.Nolan CM, Reyes CD, Debord JD, Garcia AJ, Lyon LA. Biomacromolecules. 2005;6(4):2032–2039. doi: 10.1021/bm0500087. [DOI] [PubMed] [Google Scholar]
- 23.Singh N, Bridges AW, Garcia AJ, Lyon LA. Biomacromolecules. 2007;8(10):3271–3275. doi: 10.1021/bm700516v. [DOI] [PubMed] [Google Scholar]
- 24.Bridges AW, Singh N, Burns KL, Babensee JE, Lyon LA, Garcia AJ. Biomaterials. 2008;29(35):4605–4615. doi: 10.1016/j.biomaterials.2008.08.015. [DOI] [PMC free article] [PubMed] [Google Scholar]
- 25.Lyon LA, Debord JD, Debord SB, Jones CD, McGrath JG, Serpe MJ. Journal of Physical Chemistry B. 2004;108(50):19099–19108. [Google Scholar]
- 26.Nichols MD, Scott EA, Elbert DL. Biomaterials. 2009;30(29):5283–5291. doi: 10.1016/j.biomaterials.2009.06.032. PMCID: PMC2756745. [DOI] [PMC free article] [PubMed] [Google Scholar]
- 27.Scott EA, Nichols MD, Willits RK, Elbert DL. Acta Biomaterialia. 2010;6:29–38. doi: 10.1016/j.actbio.2009.07.009. PMCID: PMC2787810. [DOI] [PMC free article] [PubMed] [Google Scholar]
- 28.Roam JL, Xu H, Nguyen PK, Elbert DL. Biomaterials. 2010;31:8642–8650. doi: 10.1016/j.biomaterials.2010.07.085. [DOI] [PMC free article] [PubMed] [Google Scholar]
- 29.Mulder J. Basic principles of membrane technology. Dordrecht: Kluwer; 1996. [Google Scholar]
- 30.Sawhney AS, Pathak CP, Hubbell JA. Macromolecules. 1993;26(4):581–587. [Google Scholar]
- 31.Elbert DL, Hubbell JA. Biomacromolecules. 2001;2:430–441. doi: 10.1021/bm0056299. [DOI] [PubMed] [Google Scholar]
- 32.Matsuyama A, Tanaka F. Physical Review Letters. 1990;65(3):341. doi: 10.1103/PhysRevLett.65.341. [DOI] [PubMed] [Google Scholar]
- 33.Hern DL, Hubbell JA. J Biomed Mater Res. 1998;39(2):266–276. doi: 10.1002/(sici)1097-4636(199802)39:2<266::aid-jbm14>3.0.co;2-b. [DOI] [PubMed] [Google Scholar]
- 34.LaMer VK, Dinegar RH. Journal of the American Chemical Society. 1950;72(11):4847–4854. [Google Scholar]
- 35.Sun T, King HE. Macromolecules. 1998;31(18):6383–6386. [Google Scholar]
- 36.Van Tomme SR, van Nostrum CF, de Smedt SC, Hennink WE. Biomaterials. 2006;27(22):4141–4148. doi: 10.1016/j.biomaterials.2006.03.023. [DOI] [PubMed] [Google Scholar]
- 37.Van Tomme SR, van Nostrum CF, Dijkstra M, De Smedt SC, Hennink WE. European Journal of Pharmaceutics and Biopharmaceutics. 2008;70(2):522–530. doi: 10.1016/j.ejpb.2008.05.013. [DOI] [PubMed] [Google Scholar]
Associated Data
This section collects any data citations, data availability statements, or supplementary materials included in this article.


