

Abstract
Background
Recent work suggests that epigenetic differences may be associated with psychiatric disorders. Here we investigate, in a community-based sample, whether methylation profiles distinguish between individuals with and without lifetime depression. We also investigate the physiologic consequences that may be associated with these profiles.
Method
Using whole blood-derived genomic DNA from a subset of participants in the Detroit Neighborhood Health Study (DNHS), we applied methylation microarrays to assess genome-wide methylation profiles for over 14 000 genes in 33 persons who reported a lifetime history of depression and 67 non-depressed adults. Bioinformatic functional analyses were performed on the genes uniquely methylated and unmethylated in each group, and inflammatory biomarkers [interleukin (IL)-6 and C-reactive protein (CRP)] were measured to investigate the possible functional significance of the methylation profiles observed.
Results
Uniquely unmethylated gene sets distinguished between those with versus without lifetime depression. In particular, some processes (e.g. brain development, tryptophan metabolism) showed patterns suggestive of increased methylation among individuals with depression whereas others (e.g. lipoprotein) showed patterns suggestive of decreased methylation among individuals with depression. IL-6 and CRP levels were elevated among those with lifetime depression and, among those with depression only, IL-6 methylation showed an inverse correlation with circulating IL-6 and CRP.
Conclusions
Genome-wide methylation profiles distinguish individuals with versus without lifetime depression in a community-based setting, and show coordinated signals with pathophysiological mechanisms previously implicated in the etiology of this disorder. Examining epigenetic mechanisms in concert with other dynamic markers of physiologic functioning should improve our understanding of the neurobiology of depression.
Keywords: Epidemiology, inflammation, methylation, psychiatry
Introduction
Epigenetic modifications regulate genetic function through mechanisms that are independent of DNA sequences. Although multiple types of epigenetic modifications have been identified (Kim et al. 2009), all involve chemical modifications that regulate chromatin structure and/or DNA accessibility, which in turn alter the transcriptional activity of the surrounding loci. Methylation, the covalent modification of DNA whereby methyl groups are coupled to cytosine residues at CpG sites, is perhaps the best studied of these epigenetic mechanisms, due in part to its tractability to study. In general, methylation and gene expression are typically thought to show an inverse correlation, such that increased methylation corresponds to decreased gene expression and vice versa (Egger et al. 2004).
As dynamic molecular markers that have been shown to change with age (Bjornsson et al. 2008) and experience (Kang et al. 2007), epigenetic signatures are attractive candidates for elucidating the underlying mechanisms of complex diseases (reviewed in Petronis, 2010), including mental illness (Ptak & Petronis, 2010). With respect to depression, animal models have shown that early life events can change the methylation levels of genes implicated in the neurobiology of this disorder (i.e. NR3C1, 5-HTTLPR) (Weaver et al. 2004; Kinnally et al. 2010). In addition, work based again on animal models has shown that these levels can be altered through pharmacologic intervention (Weaver et al. 2004, 2005), even in terminally differentiated, adult tissues. In humans, few studies have been conducted that specifically address the link between methylation and depression. However, in vitro investigation has suggested an association between a lifetime history of major depressive disorder (MDD) and methylation levels in the promoter region of the serotonin transporter gene (SLC6A4; 5-HTTLPR) (Philibert et al. 2008); and in vivo work suggests a link between depressive symptoms and methylation at this same locus (Olsson et al. 2010). Similarly, in vivo work suggests an association between prenatal exposure to maternal depression and postnatal methylation levels in DNA from cord blood in the promoter region of the NR3C1 gene (Oberlander et al. 2008). Complementing these candidate gene examples, approaches that investigate the entire genome have reported numerous methylation differences in the frontal cortices of patients affected by schizophrenia and bipolar disorder, compared to unaffected controls (Mill et al. 2008). Importantly, many of these differences occur in genes previously implicated in the neurobiology of psychosis, including glutamatergic and gamma-aminobutyric acid (GABA)ergic neurotransmission genes and loci involved in neuronal development (Mill et al. 2008). Taken together, the results from these early studies suggest that specific epigenetic profiles may be associated with mental illness; however, to the best of our knowledge, such genome-wide epigenetic profiles have yet to be reported for depression.
An additional important mechanism to consider in the etiology of depression is inflammation. Considerable evidence has demonstrated a link between inflammatory processes and depression (reviewed in Maes, 1999; Dantzer et al. 2008). In particular, the role of pro-inflammatory cytokines has received much attention as a potential mediator of depression (Kronfol & Remick, 2000; Kiecolt-Glaser & Glaser, 2002; Schiepers et al. 2005; Irwin & Miller, 2007; Miller et al. 2009), with significant increases in interleukin (IL)-6 and IL-1, for example, associated with the presence the disorder (Maes et al. 1993a, 1995). In addition, depression and other adverse psychiatric outcomes are known to develop following therapeutic use of cytokines such as IL-2 and interferon (IFN)-α (Kronfol & Remick, 2000). From an epigenetic perspective, inflammation is known to induce oxidative damage (Backdahl et al. 2009), which can either reduce or increase methylation: the former through the oxidation of methyl groups, which renders methylated CpG sites less recognizable to the enzyme that maintains methylation during mitosis; the latter through the production of reactive halogen compounds that mimic 5-methylcytosines in the binding of methyl-binding proteins (Valinluck & Sowers, 2007). Indeed, significant correlations have been reported between levels of global methylation and inflammatory biomarkers [C-reactive protein (CRP) and IL-6] among patients suffering from chronic kidney disease (Stenvinkel et al. 2007). Nevertheless, research examining the link between depression and inflammation, and between inflammation and methylation, has been conducted primarily in experimental settings (i.e. in clinical and animal model studies). This highlights the importance of assessing these links in community-based, epidemiologic studies.
To address these gaps in the literature, here we test whether unique epigenetic profiles are associated with depression in samples obtained from an ongoing, prospective, longitudinal cohort: the Detroit Neighborhood Health Study (DNHS). We used methylation microarray technology to characterize genome-wide methylation signatures among individuals with and without lifetime depression in this community-based sample. We then conducted bioinformatic analyses of these microarray data to identify the biological pathways associated with the methylation profiles that characterize those with and without the disorder. Finally, to augment existing laboratory and clinical research examining the link between depression and inflammation, and to provide in vivo evidence for the functional significance of these depression-associated methylation profiles, we investigated serum IL-6 and CRP levels in these same individuals.
Method
A sample of 33 persons who reported a lifetime history of depression and 67 non-depressed adults were selected from an ongoing longitudinal study, the DNHS. The DNHS is a survey-based investigation of mental health correlates among Detroit residents. A total of 1547 participants were surveyed during wave 1 of the study, each of whom received US$25 for their participation in the survey. All survey participants were offered the opportunity to provide venepuncture (VP) blood specimens for the biospecimen component of the study (which included testing of immune and inflammatory markers from serum and also genetic testing of DNA) and received an additional US$25 if they elected to do so. VP specimens were obtained following informed consent from a subsample of eligible participants during wave 1 (n=501). For the purposes of this study, 100 of these 501 participants were selected midway through the wave 1 sample collection effort in order to conduct pilot testing of epigenetic profiles associated with mental illness in community-based settings.
Wave 1 survey participants were representative of the Detroit population in terms of age, gender, race, income, and educational attainment (ACS, 2009). The 100 participants in the current study were similar to the full sample on these key sociodemographic characteristics but were, on average, slightly younger than individuals in the full survey sample (45.3 v. 50.6 years, p=0.003). As our subsample of 100 participants for this study was selected specifically according to presence of mental illness, the prevalence of depression is much higher in our study sample (33%) than in the full survey sample (17.6%).
Depressive symptoms were evaluated with the nine-item depression scale of the Patient Health Questionnaire (PHQ-9; Kroenke et al. 2001). Each of the nine questions was scored as 0 (not at all) to 3 (nearly every day), such that scores ranged from 0 to 27 (Kroenke et al. 2001). Lifetime depression cases were participants who reported depressed mood or anhedonia, at least one additional symptom for ‘more than half the days’ for two or more weeks, and whose symptoms occurred together. One symptom, ‘thoughts that you would be better off dead or of hurting yourself in some way’, counted if present at all, regardless of duration. The PHQ-9 in this study had excellent internal consistency, with α=0.86.
In a clinical reappraisal performed on 51 random participants from the larger study, comparing the PHQ-9 to clinician-administered SCID, the measure had a sensitivity of 0.60, specificity of 0.93, positive predictive value of 0.67, negative predictive value of 0.90, and an area under the receiver operating characteristic (ROC) curve of 0.76; these are comparable to well-established brief assessments for depression used in community-based samples such as the CIDI (Andrews & Peters, 1998). Furthermore, low sensitivity values for this instrument imply that our prevalence estimates are conservative. Factor analysis yielded one global dominant factor for the PHQ-9, suggesting good symptom cohesiveness. This study was approved by the Institutional Review Board (IRB) of the University of Michigan, and all participants provided written, informed consent.
Bisulfite conversion of previously extracted, whole blood-derived genomic DNA from 100 individuals and from control human methylated and non-methylated DNA (Zymo Research, USA) was performed on 1 μg of each sample using the EZ-96 DNA Methylation™ Kit (Zymo Research) following the manufacturer's recommended protocol. Four technical replicates were also included, comprising duplicate samples of two randomly selected individuals and duplicate samples of the control human methylated and unmethylated DNA. Bisulfite-converted DNA was subsequently assessed for methylation status at 27 578 CpG loci covering more than 14 000 genes using the humanmethylation27 (HM27) DNA Analysis BeadChip (Illumina, USA). Samples were placed on microarray chips without knowledge of depression status; all replicates were placed on separate microarray chips. The resulting data were background normalized using Illumina's BeadStudio software and exported for subsequent analysis using the R package v. 2.9.0 and SAS software v. 9.2. Spearman correlation coefficients (ρ) of the two replicated samples were 0.81 and 0.89; control replicates showed ρ=0.96 (methylated controls) and ρ=0.98 (unmethylated controls).
DNA methylation β values range continuously from 0 (completely unmethylated) to 1 (completely methylated). The average β value for methylated control replicates was 0.93; for unmethylated control replicates the average β value was 0.17. In this study, probes with β values <0.2 were classified as unmethylated, and probes with β values >0.8 were classified as methylated. These values are conservative compared to other cutoffs that have been used previously to determine methylated and unmethylated sites on the HM27 BeadChip (Brunner et al. 2009) and to the analogous percentage of methylation reference (PMR) values found in the cancer literature (e.g. Pike et al. 2008). Methylation levels were averaged for each gene in each group (with and without depression) and the number of shared versus uniquely methylated/unmethylated genes was determined. McNemar's χ2 test was used to compare the proportion of uniquely methylated and unmethylated genes among depression-affected versus depression-unaffected individuals.
Functional analyses of genes uniquely methylated/unmethylated in each group were performed using the functional annotation clustering (FAC) tool in the Database for Annotation, Visualization and Integrated Discovery (DAVID; Huang et al. 2009). DAVID is a publicly available resource that provides a comprehensive set of functional annotation tools to help investigators understand the biological meaning behind large sets of genes. In this study, results were obtained using the FAC tool, which clusters similar annotations based on the co-occurrence of particular gene sets. The tool also calculates an associated enrichment score for each cluster based on the geometric mean of the p values determined for each of its component annotations (which is then reported in –log scale). For the FAC analyses reported here, options were set to their default values and annotations were accessed as indexed on 31 August 2009. Clusters were identified by selecting the over-represented annotation that conveyed the broadest biological meaning within each FAC. Additional analyses of disease-related annotations only were performed on the uniquely unmethylated gene sets, with options otherwise set to default values; the results for these analyses include all annotations contained within each cluster. Pyrosequencing of two loci in subsets of 89 and 90 of the 100 individuals tested on the HM27 beadchip confirmed the direction of initial methylation results. In addition, targeted DNA sequencing of three loci in 20 individuals confirmed the existence of invariant sequence at the probe target regions (Uddin et al. 2010).
Publicly accessible data on gene expression were obtained from the National Center for Biotechnology Information (NCBI) gene expression omnibus (GEO) database. Whole blood-derived gene expression levels from 40 samples were obtained for analysis from the following datasets: GDS2952, GDS2519, GDS1331, and GDS596. All samples were derived from healthy control individuals in these datasets. Commonly methylated and unmethylated probes were obtained from our data as presented in dark grey in Fig. 1. RefSeqs of the GEO data were obtained from Affymetrix NetAffx™ Analysis Center batch query as of 27 July 2009 and then matched with the RefSeqs (accession numbers) in the Illumina data for additional analysis. Raw gene expression values of commonly methylated and unmethylated probes were log base 2 transformed and normalized by median centering. The values were then averaged for each probe and a t test was performed to compare the mean expression levels between the two groups.
Fig. 1.

Number of methylated and umethylated genes according to depression status. White indicates the genes uniquely methylated or unmethylated among individuals with lifetime depression, light grey indicates the genes uniquely methylated or unmethylated among individuals without lifetime depression, and dark grey indicates the genes commonly methylated or unmethylated in both groups. Methylated genes were defined as those genes with average β values of >0.8, and unmethylated genes were defined as those genes with average β values of <0.2.
Peripheral blood mononuclear cells (PBMCs) were isolated by centrifugation of whole blood and resuspended in 6 ml of freezing medium, 1 ml of which was loaded into a packed cell volume (PCV) tube and centrifuged in the tube at 2400 RCF for 1 min. PCV tubes were then assessed for PBMC count using the TPP Easy Read Ruler (MIDSCI, USA) and following the manufacturer's recommended protocols. IL-6 was measured in serum in the same 100 individuals tested on the HM27 BeadChips, using the QuantiGlo Human IL-6 sandwich enzyme immunoassay kit (R&D Systems, USA) and following the manufacturer's recommended protocol. CRP was measured in serum in 99 of the 100 individuals (32 of 33 in the depression affected group) using the CRP Ultra Wide Range Reagent Kit (Genzyme, USA) and following the manufacturer's recommended protocols. Data were log transformed prior to analysis to improve normality.
Results
Individuals diagnosed with depression did not differ significantly from their unaffected counterparts with respect to age, sex, race, education level, medication use, smoking or drinking behavior, or PBMC count (p>0.05; Table 1). By contrast, depression-affected individuals had fewer uniquely unmethylated and methylated genes compared to depression-unaffected individuals (Fig. 1); differences between the two groups were statistically significant (χ2=30.78, 1 df, p<0.0001 for uniquely unmethylated gene comparisons and χ2=271.04, 1 df, p<0.0001 for uniquely methylated gene comparisons). Gene expression analysis of the genes commonly methylated and unmethylated in both groups suggests that, in general, methylated gene states correspond to lower gene expression levels and unmethylated gene states correspond to higher gene expression levels (Supplementary Fig. S1).
Table 1.
Demographic and behavioral characteristics of the study sample
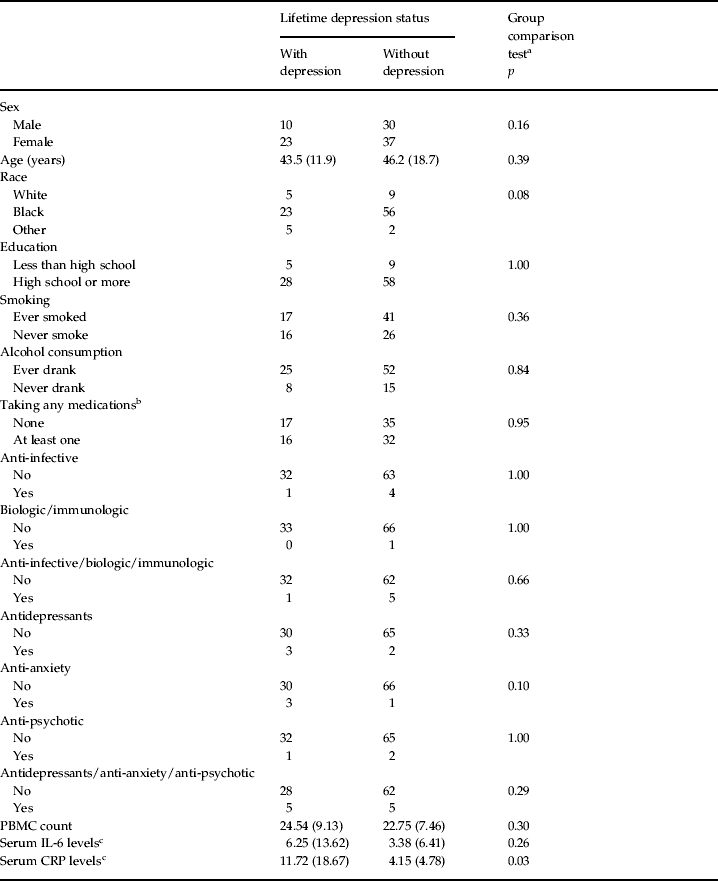
PBMC, Peripheral blood mononuclear cell; IL-6, interleukin-6; CRP, C-reactive protein.
Values given as n or mean (standard deviation).
Student's t test for age and χ2 tests for the other variables.
Medications were classified according to the Medispan® database.
Levels are reported in untransformed units.
The results for the top three FACs show that distinct biological pathways are associated with the uniquely methylated and unmethylated genes in each group (Table 2; full FAC results are available as online supplementary material, Tables S1–S4), with many clusters reflecting pathways or processes known to be altered among individuals with depression, particularly among the uniquely unmethylated gene sets. That individuals in both groups show these unique methylation signatures suggests that, for some processes (i.e. brain development, tryptophan metabolism), individuals with depression typically show higher methylation levels (and lower expression levels) in the genes associated with that FAC. Conversely, for other processes (i.e. lipoprotein, hydrolase activity), the results suggest that individuals with depression typically show lower methylation levels (and higher expression levels) in the genes associated with that FAC. Analyses of disease-related annotations among the unmethylated gene sets show FACs composed almost exclusively of psychopathology-associated disease classes in the depression-unaffected group (Table 3), suggesting again that individuals with depression possess higher methylation levels in these psychopathology-associated gene sets. No disease-related FACs (involving psychopathology or any other disease class) were identified from the uniquely unmethylated genes among individuals with depression.
Table 2.
Functional annotation cluster analyses of uniquely methylated and unmethylated genesa
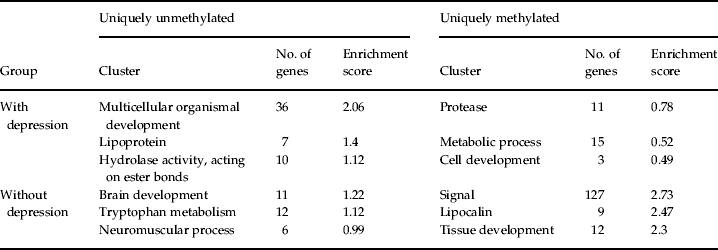
All genes are identified in terms of DAVID IDs; genes can appear in more than one cluster.
Table 3.
Disease-based functional annotation clustering results of genes uniquely unmethylated among individuals without lifetime depression
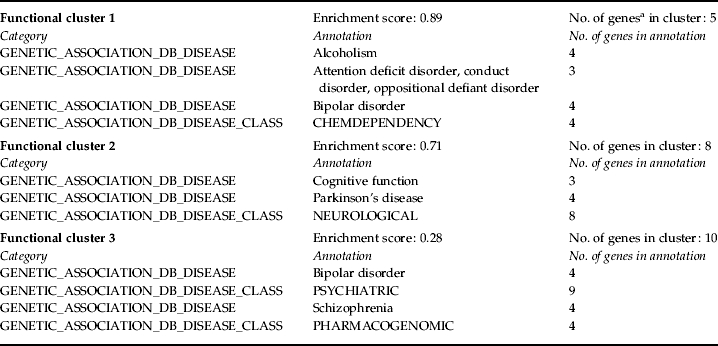
All genes are identified in terms of DAVID IDs; genes can appear in more than one cluster.
Fig. 2 shows average IL-6 and CRP levels in those with and without lifetime depression. Average IL-6 levels were higher in the depression-affected group (Welch's t=1.91, df=58, p=0.06). Average CRP levels were significantly higher in this same group (Welch's t=2.95, df=59, p<0.01). Among those with lifetime depression only, there was a significant inverse correlation between methylation and serum levels of IL-6 (Pearson r=−0.54, p=0.001), and a significant inverse correlation between methylation of IL-6 and serum levels of CRP (Pearson r=−0.48, p=0.006). No significant relationship was observed between methylation and serum levels for CRP.
Fig. 2.

Box plot of log-transformed interleukin (IL)-6 and C-reactive protein (CRP) serum levels in those with versus without lifetime depression. Shown are the log-transformed median IL-6 and CRP levels in each group (black horizontal bar) and also the range of the values, with the top and bottom whiskers representing the maximum and minimum values, respectively.
Discussion
Drawing on samples obtained from an ongoing, longitudinal epidemiologic study, our study documents, for the first time, genome-wide differences in methylation profiles among individuals with and without lifetime depression in a community-based setting. We find that genes uniquely unmethylated in each of the two groups show evidence for the involvement of inflammatory-related pathways and processes previously implicated in depression, and confirm the functional significance of these results by demonstrating elevated levels of two inflammatory markers, IL-6 and CRP, among those with lifetime depression. This functional relationship was further corroborated by the finding of an inverse correlation between methylation of IL-6 CpG and circulating IL-6 and CRP levels among those with lifetime depression.
Among individuals with lifetime depression, we observed a signal of lipoprotein-related functions in the uniquely unmethylated gene set (Table 2). In humans, studies based on peripheral blood have shown increased levels of lipid peroxidation among patients with depression (Galecki et al. 2007). Similarly, work based on gene expression microarrays has identified depression-associated differences in blood gene expression patterns for loci involved in lipid metabolism (Kalman et al. 2005). Indeed, depression has been characterized as an immune response directed against disrupted lipid membrane components and by-products of lipid peroxidation (Maes, 2008). The epigenetic signal observed here is thus consistent with previous reports of lipid-related differences associated with depression.
Among individuals without lifetime depression, the topmost FAC pertains to brain development and neurogenesis-related functions (Table 2; Table S3). Recent work focusing on the action of antidepressants in both rodents and humans suggests that impairments in neurogenesis may play a contributing role to the reduction in cell numbers and morphological plasticity associated with depression (reviewed in Manji et al. 2000a, b). In addition, the identification of tryptophan metabolism among the top three functional clusters in the depression-unaffected group is consistent with previous reports regarding the role of tryptophan, a precursor of serotonin, in depressed individuals. In experimental studies of patients whose depression is currently in remission, patients who ingest a tryptophan-deficient amino acid mixture that transiently decreases serotonin levels in the brain often experience a brief relapse of symptoms during tryptophan depletion (aan het Rot et al. 2009).
Our findings of higher IL-6 levels and significantly higher CRP levels in those with depression are also consistent with previous work conducted in both clinical and community settings (e.g. Trzonkowski et al. 2004; Ranjit et al. 2007; Gimeno et al. 2009; and reviewed in Howren et al. 2009). Unique to this study, however, is the pairing of methylation and inflammatory marker testing in the same individuals, which enabled us to infer potential functional consequences of the methylation differences that distinguished those with and without depression. IL-6 is a cytokine that plays a central role in a variety of inflammation-associated disease states, including depression (Elenkov, 2008). CRP is a protein found in the blood, the levels of which rise in response to inflammation (specifically, due to a rise in the plasma concentration of IL-6) (Pepys & Hirschfield, 2003). As noted in the introduction, a wealth of evidence suggests that inflammation may increase the risk of major depressive episodes (Maes et al. 1993c, 2009; Sluzewska et al. 1996; Maes, 1999, 2008; Dantzer et al. 2008). This increased risk has been attributed in particular to a reduction in plasma tryptophan levels previously reported among individuals with depression (Anderson et al. 1990; Maes et al. 1993b). TRP is metabolized via two main pathways, one that produces serotonin through tryptophan hydroxylase enzymatic activity, and another that produces kynurenin and kynurenic acid through the action of tryptophan 2,3-dioxygenase and indoleamine 2,3-dioxygenase (IDO) (Myint & Kim, 2003; Leonard & Myint, 2009). Notably, IDO is expressed in all organs, including the brain (Dantzer et al. 2008), and cytokines can enhance IDO activity (Hu et al. 1995; Babcock & Carlin, 2000). Thus, IDO overexpression has been proposed to result in an inflammation-induced depletion of plasma tryptophan that ultimately induces serotonin depletion in the brain of those affected by depression (the so-called ‘neurodegeneration hypothesis’ of depression; Myint & Kim, 2003). Other work, however, suggests that in the case of depression, the disorder itself may be the cause of increased inflammation (reviewed in Miller et al. 2009) and the sickness behavior that often accompanies it (Gold & Irwin, 2009). Although the direction of the inflammation/depression relationship has yet to be fully elucidated (Howren et al. 2009), lowered plasma tryptophan has been labeled an ‘inflammatory biomarker of depression’ (Maes et al. 1997; Maes, 2008). In this study, we saw evidence for unique activation of this pathway in our epigenetic results among those unaffected by depression (Table 2), suggesting relatively increased expression of related genes in this group, and consistent with the decreased activity of inflammatory markers we observed in comparison to those with depression. Taken together, these results suggest that the etiology of depression involves dysregulated biologic processes that are altered across multiple levels of organization, from molecular-level changes in methylation profiles observed in blood-derived DNA to systemic changes in pro-inflammatory cytokine signaling pathways that, although observed in the periphery, are known to be capable of affecting neurogenesis in the central nervous system (CNS) and are related to disruptions in neuroplasticity in mood-relevant brain regions (reviewed in Miller et al. 2009).
Finally, our disease-related analyses identified three clusters predominantly comprising psychopathology-associated functional annotations (Table 3). Included in these clusters (and also those in Table 2) are genes previously implicated in the etiology of depression, including monoamine oxidase A (MAOA) and solute carrier family 6 (SLC6A3), in addition to other genes belonging to gene families also previously implicated in depression [e.g. GABA A receptor genes, 5-hydroxytryptamine (serotonin) receptor genes] or other psychiatric disorders (e.g. regulator of G-protein signaling 4, RGS4).
Several limitations should be considered when interpreting these findings. First, based on the current, cross-sectional analyses, it is not possible to determine whether the observed depression-associated methylation and inflammatory marker patterns are indicative of changes due to the disorder, or whether they are instead reflective of underlying biologic vulnerabilities among depression-affected individuals that existed prior to the disorder; additional, longitudinal studies are needed to address this issue. Second, methylation levels are known to vary among tissues and cells types (Eckhardt et al. 2006). Our reliance on DNA from whole blood to assess methylation patterns, rather than specific cell types within the blood, meant that we were unable to determine blood cell-specific differences in methylation status, which would have to be accounted for when replicating the current findings in other, longitudinal cohorts. Similarly, our necessary reliance on peripheral tissues limits the inferences that can be drawn regarding pathways involving the brain. Nevertheless, a growing body of research confirms the promise of using peripheral blood to make inferences about brain-related processes (Gladkevich et al. 2004; Wrona, 2006; Le-Niculescu et al. 2009), which bodes well for the expanded use of this tissue in large epidemiologic studies such as the DNHS. Finally, given previous reports of race/ethnic differences in methylation levels at specific loci (e.g. Lee et al. 2007) and the overwhelmingly African-American heritage of individuals who provided samples for this study (79%), the results from this work may not be generalizable to other populations.
Despite these limitations, our results provide the first report of peripheral epigenomic profiles associated with depression in a community setting, and provide a first step toward integrating the functional significance of these profiles with additional, independent physiologic measures of inflammatory markers. Future work should consider epigenetic mechanisms in the search to better understand the neurobiology of depression.
Acknowledgments
This work was supported by National Institutes of Health (NIH) grants DA022720, DA022720-S1, RC1MH088283, MH078928 and MH07627. Additional support was provided by the Robert Wood Johnson Health and Society Scholars Small Grant Program and the University of Michigan OVPR Faculty Grants and Awards Program (M.U.); and by the Wayne State University Research Excellence Fund (D.E.W.). Funding for IL-6 and CRP testing was generously provided by the University of Michigan Nathan Shock Center, Grant AG013283 (A.E.A.).
Note
Supplementary material accompanies this paper on the Journal's website (http://journals.cambridge.org/psm).
Declaration of Interest
None.
References
- aan het Rot M, Mathew SJ, Charney DS. Neurobiological mechanisms in major depressive disorder. Canadian Medical Association Journal. 2009;180:305–313. doi: 10.1503/cmaj.080697. [DOI] [PMC free article] [PubMed] [Google Scholar]
- ACS. 2005–2007 American Community Survey 3-Year Estimates. U.S. Census Bureau; Washington, DC: 2009. [Google Scholar]
- Anderson IM, Parry-Billings M, Newsholme EA, Poortmans JR, Cowen PJ. Decreased plasma tryptophan concentration in major depression: relationship to melancholia and weight loss. Journal of Affective Disorders. 1990;20:185–191. doi: 10.1016/0165-0327(90)90143-v. [DOI] [PubMed] [Google Scholar]
- Andrews G, Peters L. The psychometric properties of the Composite International Diagnostic Interview. Social Psychiatry and Psychiatric Epidemiology. 1998;33:80–88. doi: 10.1007/s001270050026. [DOI] [PubMed] [Google Scholar]
- Babcock TA, Carlin JM. Transcriptional activation of indoleamine dioxygenase by interleukin 1 and tumor necrosis factor alpha in interferon-treated epithelial cells. Cytokine. 2000;12:588–594. doi: 10.1006/cyto.1999.0661. [DOI] [PubMed] [Google Scholar]
- Backdahl L, Bushell A, Beck S. Inflammatory signalling as mediator of epigenetic modulation in tissue-specific chronic inflammation. International Journal of Biochemistry and Cell Biology. 2009;41:176–184. doi: 10.1016/j.biocel.2008.08.023. [DOI] [PubMed] [Google Scholar]
- Bjornsson HT, Sigurdsson MI, Fallin MD, Irizarry RA, Aspelund T, Cui H, Yu W, Rongione MA, Ekstrom TJ, Harris TB, Launer LJ, Eiriksdottir G, Leppert MF, Sapienza C, Gudnason V, Feinberg AP. Intra-individual change over time in DNA methylation with familial clustering. Journal of the American Medical Association. 2008;299:2877–2883. doi: 10.1001/jama.299.24.2877. [DOI] [PMC free article] [PubMed] [Google Scholar]
- Brunner AL, Johnson DS, Kim SW, Valouev A, Reddy TE, Neff NF, Anton E, Medina C, Nguyen L, Chiao E, Oyolu CB, Schroth GP, Absher DM, Baker JC, Myers RM. Distinct DNA methylation patterns characterize differentiated human embryonic stem cells and developing human fetal liver. Genome Research. 2009;19:1044–1056. doi: 10.1101/gr.088773.108. [DOI] [PMC free article] [PubMed] [Google Scholar]
- Dantzer R, O'Connor JC, Freund GG, Johnson RW, Kelley KW. From inflammation to sickness and depression: when the immune system subjugates the brain. Nature Reviews Neuroscience. 2008;9:46–56. doi: 10.1038/nrn2297. [DOI] [PMC free article] [PubMed] [Google Scholar]
- Eckhardt F, Lewin J, Cortese R, Rakyan VK, Attwood J, Burger M, Burton J, Cox TV, Davies R, Down TA, Haefliger C, Horton R, Howe K, Jackson DK, Kunde J, Koenig C, Liddle J, Niblett D, Otto T, Pettett R, Seemann S, Thompson C, West T, Rogers J, Olek A, Berlin K, Beck S. DNA methylation profiling of human chromosomes 6, 20 and 22. Nature Genetics. 2006;38:1378–1385. doi: 10.1038/ng1909. [DOI] [PMC free article] [PubMed] [Google Scholar]
- Egger G, Liang G, Aparicio A, Jones PA. Epigenetics in human disease and prospects for epigenetic therapy. Nature. 2004;429:457–463. doi: 10.1038/nature02625. [DOI] [PubMed] [Google Scholar]
- Elenkov IJ. Neurohormonal-cytokine interactions: implications for inflammation, common human diseases and well-being. Neurochemistry International. 2008;52:40–51. doi: 10.1016/j.neuint.2007.06.037. [DOI] [PubMed] [Google Scholar]
- Galecki P, Kedziora J, Florkowski A, Galecka E. Lipid peroxidation and copper-zinc superoxide dismutase activity in patients treated with fluoxetine during the first episode of depression [in Polish] Psychiatria Polska. 2007;41:615–624. [PubMed] [Google Scholar]
- Gimeno D, Kivimaki M, Brunner EJ, Elovainio M, De Vogli R, Steptoe A, Kumari M, Lowe GD, Rumley A, Marmot MG, Ferrie JE. Associations of C-reactive protein and interleukin-6 with cognitive symptoms of depression: 12-year follow-up of the Whitehall II study. Psychological Medicine. 2009;39:413–423. doi: 10.1017/S0033291708003723. [DOI] [PMC free article] [PubMed] [Google Scholar]
- Gladkevich A, Kauffman HF, Korf J. Lymphocytes as a neural probe: potential for studying psychiatric disorders. Progress in Neuropsychopharmacology and Biological Psychiatry. 2004;28:559–576. doi: 10.1016/j.pnpbp.2004.01.009. [DOI] [PubMed] [Google Scholar]
- Gold SM, Irwin MR. Depression and immunity: inflammation and depressive symptoms in multiple sclerosis. Immunology and Allergy Clinics of North America. 2009;29:309–320. doi: 10.1016/j.iac.2009.02.008. [DOI] [PMC free article] [PubMed] [Google Scholar]
- Howren MB, Lamkin DM, Suls J. Associations of depression with C-reactive protein, IL-1, and IL-6: a meta-analysis. Psychosomatic Medicine. 2009;71:171–186. doi: 10.1097/PSY.0b013e3181907c1b. [DOI] [PubMed] [Google Scholar]
- Hu B, Hissong BD, Carlin JM. Interleukin-1 enhances indoleamine 2,3-dioxygenase activity by increasing specific mRNA expression in human mononuclear phagocytes. Journal of Interferon and Cytokine Research. 1995;15:617–624. doi: 10.1089/jir.1995.15.617. [DOI] [PubMed] [Google Scholar]
- Huang DW, Sherman BT, Lempicki RA. Systematic and integrative analysis of large gene lists using DAVID bioinformatics resources. Nature Protocols. 2009;4:44–57. doi: 10.1038/nprot.2008.211. [DOI] [PubMed] [Google Scholar]
- Irwin MR, Miller AH. Depressive disorders and immunity: 20 years of progress and discovery. Brain Behavior and Immunity. 2007;21:374–383. doi: 10.1016/j.bbi.2007.01.010. [DOI] [PubMed] [Google Scholar]
- Kalman J, Palotas A, Juhasz A, Rimanoczy A, Hugyecz M, Kovacs Z, Galsi G, Szabo Z, Pakaski M, Feher LZ, Janka Z, Puskas LG. Impact of venlafaxine on gene expression profile in lymphocytes of the elderly with major depression – evolution of antidepressants and the role of the ‘neuro-immune’ system. Neurochemical Research. 2005;30:1429–1438. doi: 10.1007/s11064-005-8513-9. [DOI] [PubMed] [Google Scholar]
- Kang HJ, Adams DH, Simen A, Simen BB, Rajkowska G, Stockmeier CA, Overholser JC, Meltzer HY, Jurjus GJ, Konick LC, Newton SS, Duman RS. Gene expression profiling in postmortem prefrontal cortex of major depressive disorder. Journal of Neuroscience. 2007;27:13329–13340. doi: 10.1523/JNEUROSCI.4083-07.2007. [DOI] [PMC free article] [PubMed] [Google Scholar]
- Kiecolt-Glaser JK, Glaser R. Depression and immune function: central pathways to morbidity and mortality. Journal of Psychosomatic Research. 2002;53:873–876. doi: 10.1016/s0022-3999(02)00309-4. [DOI] [PubMed] [Google Scholar]
- Kim JK, Samaranayake M, Pradhan S. Epigenetic mechanisms in mammals. Cellular and Molecular Life Sciences. 2009;66:596–612. doi: 10.1007/s00018-008-8432-4. [DOI] [PMC free article] [PubMed] [Google Scholar]
- Kinnally EL, Capitanio JP, Leibel R, Deng L, Leduc C, Haghighi F, Mann JJ. Epigenetic regulation of serotonin transporter expression and behavior in infant rhesus macaques. Genes, Brain and Behavior. 2010;6:575–582. doi: 10.1111/j.1601-183X.2010.00588.x. [DOI] [PMC free article] [PubMed] [Google Scholar]
- Kroenke K, Spitzer RL, Williams JB. The PHQ-9: validity of a brief depression severity measure. Journal of General Internal Medicine. 2001;16:606–613. doi: 10.1046/j.1525-1497.2001.016009606.x. [DOI] [PMC free article] [PubMed] [Google Scholar]
- Kronfol Z, Remick DG. Cytokines and the brain: implications for clinical psychiatry. American Journal of Psychiatry. 2000;157:683–694. doi: 10.1176/appi.ajp.157.5.683. [DOI] [PubMed] [Google Scholar]
- Lee JS, Lo PK, Fackler MJ, Argani P, Zhang Z, Garrett-Meyer E, Sukumar S. A comparative study of Korean with Caucasian breast cancer reveals frequency of methylation in multiple genes correlates with breast cancer in young, ER, PR-negative breast cancer in Korean women. Cancer Biology and Therapy. 2007;6:1114–1120. doi: 10.4161/cbt.6.7.4331. [DOI] [PubMed] [Google Scholar]
- Le-Niculescu H, Kurian SM, Yehyawi N, Dike C, Patel SD, Edenberg HJ, Tsuang MT, Salomon DR, Nurnberger JI Jr., Niculescu AB. Identifying blood biomarkers for mood disorders using convergent functional genomics. Molecular Psychiatry. 2009;14:156–174. doi: 10.1038/mp.2008.11. [DOI] [PubMed] [Google Scholar]
- Leonard BE, Myint A. The psychoneuroimmunology of depression. Human Psychopharmacology. 2009;24:165–175. doi: 10.1002/hup.1011. [DOI] [PubMed] [Google Scholar]
- Maes M. Major depression and activation of the inflammatory response system. Advances in Experimental Medicine and Biology. 1999;461:25–46. doi: 10.1007/978-0-585-37970-8_2. [DOI] [PubMed] [Google Scholar]
- Maes M. The cytokine hypothesis of depression: inflammation, oxidative & nitrosative stress (IO&NS) and leaky gut as new targets for adjunctive treatments in depression. Neuroendocrinology Letters. 2008;29:287–291. [PubMed] [Google Scholar]
- Maes M Bosmans E Meltzer HY Scharpe S Suy E 1993aInterleukin-1 beta: a putative mediator of HPA axis hyperactivity in major depression? American Journal of Psychiatry 1501189–1193. [DOI] [PubMed] [Google Scholar]
- Maes M, Meltzer HY, Bosmans E, Bergmans R, Vandoolaeghe E, Ranjan R, Desnyder R. Increased plasma concentrations of interleukin-6, soluble interleukin-6, soluble interleukin-2 and transferrin receptor in major depression. Journal of Affective Disorders. 1995;34:301–309. doi: 10.1016/0165-0327(95)00028-l. [DOI] [PubMed] [Google Scholar]
- Maes M Meltzer HY Scharpe S Bosmans E Suy E De Meester I Calabrese J Cosyns P 1993bRelationships between lower plasma L-tryptophan levels and immune-inflammatory variables in depression Psychiatry Research 49151–165. [DOI] [PubMed] [Google Scholar]
- Maes M Scharpe S Meltzer HY Bosmans E Suy E Calabrese J Cosyns P 1993cRelationships between interleukin-6 activity, acute phase proteins, and function of the hypothalamic-pituitary-adrenal axis in severe depression Psychiatry Research 4911–27. [DOI] [PubMed] [Google Scholar]
- Maes M, Verkerk R, Vandoolaeghe E, Van Hunsel F, Neels H, Wauters A, Demedts P, Scharpe S. Serotonin-immune interactions in major depression: lower serum tryptophan as a marker of an immune-inflammatory response. European Archives of Psychiatry and Clinical Neuroscience. 1997;247:154–161. doi: 10.1007/BF03033069. [DOI] [PubMed] [Google Scholar]
- Maes M, Yirmyia R, Noraberg J, Brene S, Hibbeln J, Perini G, Kubera M, Bob P, Lerer B, Maj M. The inflammatory & neurodegenerative (I&ND) hypothesis of depression: leads for future research and new drug developments in depression. Metabolic Brain Disease. 2009;24:27–53. doi: 10.1007/s11011-008-9118-1. [DOI] [PubMed] [Google Scholar]
- Manji HK Moore GJ Chen G 2000aClinical and preclinical evidence for the neurotrophic effects of mood stabilizers: implications for the pathophysiology and treatment of manic-depressive illness Biological Psychiatry 48740–754. [DOI] [PubMed] [Google Scholar]
- Manji HK Moore GJ Rajkowska G Chen G 2000bNeuroplasticity and cellular resilience in mood disorders Molecular Psychiatry 5578–593. [DOI] [PubMed] [Google Scholar]
- Mill J, Tang T, Kaminsky Z, Khare T, Yazdanpanah S, Bouchard L, Jia P, Assadzadeh A, Flanagan J, Schumacher A, Wang SC, Petronis A. Epigenomic profiling reveals DNA-methylation changes associated with major psychosis. American Journal of Human Genetics. 2008;82:696–711. doi: 10.1016/j.ajhg.2008.01.008. [DOI] [PMC free article] [PubMed] [Google Scholar]
- Miller AH, Maletic V, Raison CL. Inflammation and its discontents: the role of cytokines in the pathophysiology of major depression. Biological Psychiatry. 2009;65:732–741. doi: 10.1016/j.biopsych.2008.11.029. [DOI] [PMC free article] [PubMed] [Google Scholar]
- Myint AM, Kim YK. Cytokine-serotonin interaction through IDO: a neurodegeneration hypothesis of depression. Medical Hypotheses. 2003;61:519–525. doi: 10.1016/s0306-9877(03)00207-x. [DOI] [PubMed] [Google Scholar]
- Oberlander TF, Weinberg J, Papsdorf M, Grunau R, Misri S, Devlin AM. Prenatal exposure to maternal depression, neonatal methylation of human glucocorticoid receptor gene (NR3C1) and infant cortisol stress responses. Epigenetics. 2008;3:97. doi: 10.4161/epi.3.2.6034. [DOI] [PubMed] [Google Scholar]
- Olsson CA, Foley DL, Parkinson-Bates M, Byrnes G, McKenzie M, Patton GC, Morley R, Anney RJ, Craig JM, Saffery R. Prospects for epigenetic research within cohort studies of psychological disorder: a pilot investigation of a peripheral cell marker of epigenetic risk for depression. Biological Psychology. 2010;83:159–165. doi: 10.1016/j.biopsycho.2009.12.003. [DOI] [PubMed] [Google Scholar]
- Pepys MB, Hirschfield GM. C-reactive protein: a critical update. Journal of Clinical Investigation. 2003;111:1805–1812. doi: 10.1172/JCI18921. [DOI] [PMC free article] [PubMed] [Google Scholar]
- Petronis A. Epigenetics as a unifying principle in the aetiology of complex traits and diseases. Nature. 2010;465:721–727. doi: 10.1038/nature09230. [DOI] [PubMed] [Google Scholar]
- Philibert RA, Sandhu H, Hollenbeck N, Gunter T, Adams W, Madan A. The relationship of 5HTT (SLC6A4) methylation and genotype on mRNA expression and liability to major depression and alcohol dependence in subjects from the Iowa Adoption Studies. American Journal of Medical Genetics. Part B, Neuropsychiatric Genetics. 2008;147B:543–549. doi: 10.1002/ajmg.b.30657. [DOI] [PMC free article] [PubMed] [Google Scholar]
- Pike BL, Greiner TC, Wang X, Weisenburger DD, Hsu YH, Renaud G, Wolfsberg TG, Kim M, Weisenberger DJ, Siegmund KD, Ye W, Groshen S, Mehrian-Shai R, Delabie J, Chan WC, Laird PW, Hacia JG. DNA methylation profiles in diffuse large B-cell lymphoma and their relationship to gene expression status. Leukemia. 2008;22:1035–1043. doi: 10.1038/leu.2008.18. [DOI] [PMC free article] [PubMed] [Google Scholar]
- Ptak C, Petronis A. Epigenetic approaches to psychiatric disorders. Dialogues in Clinical Neuroscience. 2010;12:25–35. doi: 10.31887/DCNS.2010.12.1/cptak. [DOI] [PMC free article] [PubMed] [Google Scholar]
- Ranjit N, Diez-Roux AV, Shea S, Cushman M, Seeman T, Jackson SA, Ni H. Psychosocial factors and inflammation in the multi-ethnic study of atherosclerosis. Archives of Internal Medicine. 2007;167:174–181. doi: 10.1001/archinte.167.2.174. [DOI] [PubMed] [Google Scholar]
- Schiepers OJ, Wichers MC, Maes M. Cytokines and major depression. Progress in Neuropsychopharmacology and Biological Psychiatry. 2005;29:201–217. doi: 10.1016/j.pnpbp.2004.11.003. [DOI] [PubMed] [Google Scholar]
- Sluzewska A, Rybakowski J, Bosmans E, Sobieska M, Berghmans R, Maes M, Wiktorowicz K. Indicators of immune activation in major depression. Psychiatry Research. 1996;64:161–167. doi: 10.1016/s0165-1781(96)02783-7. [DOI] [PubMed] [Google Scholar]
- Stenvinkel P, Karimi M, Johansson S, Axelsson J, Suliman M, Lindholm B, Heimburger O, Barany P, Alvestrand A, Nordfors L, Qureshi AR, Ekstrom TJ, Schalling M. Impact of inflammation on epigenetic DNA methylation – a novel risk factor for cardiovascular disease? Journal of Internal Medicine. 2007;261:488–499. doi: 10.1111/j.1365-2796.2007.01777.x. [DOI] [PubMed] [Google Scholar]
- Trzonkowski P, Mysliwska J, Godlewska B, Szmit E, Lukaszuk K, Wieckiewicz J, Brydak L, Machala M, Landowski J, Mysliwski A. Immune consequences of the spontaneous pro-inflammatory status in depressed elderly patients. Brain, Behavior, and Immunity. 2004;18:135–148. doi: 10.1016/S0889-1591(03)00111-9. [DOI] [PubMed] [Google Scholar]
- Uddin M, Aiello AE, Wildman DE, Koenen KC, Pawelec G, de Los Santos R, Goldmann E, Galea S. Epigenetic and immune function profiles associated with posttraumatic stress disorder. Proceedings of the National Academy of Sciences USA. 2010;107:9470–9475. doi: 10.1073/pnas.0910794107. [DOI] [PMC free article] [PubMed] [Google Scholar]
- Valinluck V, Sowers LC. Endogenous cytosine damage products alter the site selectivity of human DNA maintenance methyltransferase DNMT1. Cancer Research. 2007;67:946–950. doi: 10.1158/0008-5472.CAN-06-3123. [DOI] [PubMed] [Google Scholar]
- Weaver IC, Cervoni N, Champagne FA, D'Alessio AC, Sharma S, Seckl JR, Dymov S, Szyf M, Meaney MJ. Epigenetic programming by maternal behavior. Nature Neuroscience. 2004;7:847–854. doi: 10.1038/nn1276. [DOI] [PubMed] [Google Scholar]
- Weaver IC, Champagne FA, Brown SE, Dymov S, Sharma S, Meaney MJ, Szyf M. Reversal of maternal programming of stress responses in adult offspring through methyl supplementation: altering epigenetic marking later in life. Journal of Neuroscience. 2005;25:11045–11054. doi: 10.1523/JNEUROSCI.3652-05.2005. [DOI] [PMC free article] [PubMed] [Google Scholar]
- Wrona D. Neural-immune interactions: an integrative view of the bidirectional relationship between the brain and immune systems. Journal of Neuroimmunology. 2006;172:38–58. doi: 10.1016/j.jneuroim.2005.10.017. [DOI] [PubMed] [Google Scholar]