Abstract
Purpose
To compare 6 new three-dimensional (3D) magnetic resonance (MR) methods for evaluating knee cartilage at 3.0T.
Materials and Methods
We compared: Fast-spin-echo Cube (FSE-Cube), Vastly undersampled isotropic projection reconstruction balanced steady-state free precession (VIPR-bSSFP), Iterative decomposition of water and fat with echo asymmetry and least-squares estimation combined with spoiled gradient echo (IDEAL-SPGR) and gradient echo (IDEAL-GRASS), Multi-echo in steady-state acquisition (MENSA), and Coherent Oscillatory State Acquisition for Manipulation of Image Contrast (COSMIC).
Five-minute sequences were performed twice on 10 healthy volunteers, and once on 5 osteoarthritis (OA) patients. Signal-to-noise ratio (SNR) and contrast-to-noise ratio (CNR) were measured from the volunteers. Images of the 5 volunteers and the 5 OA patients were ranked on tissue contrast, articular surface clarity, reformat quality, and lesion conspicuity. FSE-Cube and VIPR-bSSFP were compared to IDEAL-SPGR for cartilage volume measurements.
Results
FSE-Cube had top rankings for lesion conspicuity, overall SNR, and CNR (P < .02). VIPR-bSSFP had top rankings in tissue contrast, and articular surface clarity. VIPR and FSE-Cube tied for best in reformatting ability. FSE-Cube and VIPR-bSSFP compared favorably to IDEAL-SPGR in accuracy and precision of cartilage volume measurements.
Conclusion
FSE-Cube and VIPR-bSSFP produce high image quality with accurate volume measurement of knee cartilage.
Keywords: magnetic resonance imaging, cartilage, knee, FSE-Cube, IDEAL, VIPR-bSSFP
Introduction
With the growth of the aging population, osteoarthritis (OA) has become a public health challenge, affecting over 27 million people (1) and ranking as the second leading cause of chronic disability in the USA (2). Magnetic resonance imaging (MRI) has emerged as the top modality to image OA, due to its excellent tissue contrast and lack of ionizing radiation (3). Diagnosis of OA in the knee joint using MRI is most often characterized by diffuse or focal thinning of the hyaline cartilage (4). The 3 most popular MRI methods used to evaluate the articular cartilage of the knee joint have been two-dimensional fast spin-echo (2D-FSE), three-dimensional spoiled gradient-echo (3D-SPGR), and three-dimensional balanced steady-state free precession (3D-bSSFP).
MR knee protocols used in clinical practice and OA research studies typically use a combination of 2D-FSE sequences repeated in multiple planes for evaluating internal derangements and high-resolution 3D-SPGR for evaluating articular cartilage. 3D-bSSFP (5), and their variants such as fluctuating equilibrium MR (6), have also been shown to have high diagnostic performance for detecting cartilage defects within the knee joint (7). Yet each of these sequences has its limitations. The 2D-FSE images are limited by anistropic voxels, blurring of short T2 structures, and reduced magnetization transfer effect (8). 3D-SPGR (9) has a relatively long imaging time of 5–10 minutes and relative T1-weighting with dark synovial fluid that has traditionally been favored for cartilage thickness measurements. However, sequences that also have successfully evaluated cartilage morphology, such as dual-echo steady state (DESS) (10,11), have bright synovial fluid that highlights cartilaginous fissures and surface defects (12). The main challenge of bSSFP and its variants has been preventing banding artifact in areas of main field inhomogeneity (13).
Due to the limitations of currently used techniques, various new MR pulse sequences have been developed to evaluate the articular cartilage of the knee joint. FSE-Cube is a three-dimensional FSE acquisition with 2D-accelerated auto-calibrated parallel imaging and extended echo train acquisition (14). FSE-Cube uses refocused flip angle modulation and ky–kz centric view ordering each shot to constrain the T2 decay that led to blurring on short echo time images. Vastly undersampled isotropic projection reconstruction balanced steady-state free precession (VIPR-bSSFP) (15) has a 3D radial k-space trajectory that produces fat-water separation images with mixed T2/T1 contrast and high isotropic resolution. Iterative decomposition of water and fat with echo asymmetry and least-squares estimation (IDEAL) (16) is a chemical-shift based water-fat separation technique that is robust to B0 and B1 field inhomogeneities. IDEAL can be combined with either SPGR (IDEAL-SPGR) (17) for T1-weighted contrast or with unspoiled gradient recalled-echo acquired in the steady-state (IDEAL-GRASS) (18) for images with bright synovial fluid. Multi-echo in the steady-state acquisition (MENSA) (19), also known as DESS, is a technique that averages 2 echoes acquired within the same repetition time (TR) for increased fluid signal. Coherent Oscillatory State Acquisition for the Manipulation of Image Contrast (COSMIC) (20) is a balanced coherent sequence that utilizes segmented multi-shot centric acquisition to achieve mixed T2/T1-weighted contrast.
Optimally, imaging of OA would employ a single isotropic three-dimensional MR sequence that can rapidly evaluate the articular cartilage in addition to other joint structures such as ligaments and menisci. This sequence would produce high resolution images with bright fluid for detection of cartilage surface pathology (12) while maintaining high cartilage signal for volume segmentation. In this study, we quantitatively and qualitatively compare 6 new three-dimensional cartilage imaging magnetic resonance (MR) pulse sequences for evaluating the articular cartilage of the knee at 3.0T.
Materials and Methods
GE Healthcare (Waukesha, WI, USA) provided the equipment (MR scanner and coils) used in our study. The authors who are not employees of GE Healthcare had control of inclusion of any data and information that might present a conflict of interest for those authors who are employees of GE Healthcare.
Volunteers and Imaging
Institutional review board approval and informed consent were obtained for this prospective Health Insurance Portability and Accountability Act-compliant study. To test the use of the MR pulse sequences in healthy individuals, MR imaging was performed twice on one knee of 10 asymptomatic volunteers (6 males and 4 females with age range between 26 and 38 years and average age of 31.2 years) who had no history of prior knee pain or surgery. To test the use of the sequences in individuals with articular cartilage degeneration, MR imaging was performed once on the knee of 5 patients (3 males and 2 females with age range of 55 to 61 years and average age of 58.2 years) with OA. The diagnosis of OA was based upon clinical symptoms of knee pain and stiffness for more than 6 months and evidence of osteophyte formation and joint space loss on knee radiographs.
All images were acquired with the same 3.0T MR unit (Signa Excite HDx v14.0; GE Healthcare, Waukesha, WI, USA) with high-performance gradients (maximum gradient strength of 40mT/m and maximum slew rate of 150mT/m/sec) using a commercially available transmit-receive 8-channel phased-array extremity coil (Precision Eight TX/TR High Resolution Knee Array; Invivo, Orlando, FA, USA). Acquisition parameters were similar across all 6 imaging sequences (Table 1). All pulse sequences had a 5-minute scan time, 15-cm field of view, voxel volumes ranging from 0.18mm3 to 0.26mm3, and a sagittal plane of acquisition. Spectral inversion recovery pulses were used to suppress fat signal in FSE-Cube images, while a modified linear combination technique was used for fat-water separation in VIPR-bSSFP imaging. ASSET (Array Spatial Sensitivity Encoding Technique) parallel imaging was used with MENSA, IDEAL-GRASS, IDEAL-SGPR, and COSMIC. Autocalibrating reconstruction for Cartesian sampling (ARC) parallel imaging (21) was used with FSE-Cube.
Table 1.
Acquisition Parameters for MR Sequences
| Imaging Parameters |
FSE- Cube |
MENSA | IDEAL- GRASS |
IDEAL- SPGR |
COSMIC | VIPR- bSSFP |
|---|---|---|---|---|---|---|
| TR/TE (ms) | 2217/23.6 | 16.7/5.7 | 12.4/5.3 | 12.4/5.3 | 4.6/1.3 | 3.6/0.3 |
| Flip Angle | 90° | 30° | 50° | 14° | 35° | 15° |
| Bandwidth (kHz) | 31.2 | 31.2 | 31.2 | 31.2 | 83.3 | 125 |
| Field of View (cm) | 15 | 15 | 15 | 15 | 15 | 15 |
| Matrix | 256 × 256 | 256 × 256 | 384 × 224 | 384 × 224 | 256 × 256 | 384 × 384 |
| Slice Thickness (mm) | 0.7 | 0.7 | 1.0 | 1.0 | 0.7 | 1.2* |
| Voxel Volume (mm3) | 0.24 | 0.24 | 0.26 | 0.26 | 0.24 | 0.18* |
| Scan Time (min) | 5 | 5 | 5 | 5 | 5 | 5 |
Three-slice averages in multiple planes were used to obtain 0.39×0.39 in-plane resolution and 1.2mm sections.
FSE-Cube = fast spin-echo Cube,
MENSA = multi-echo in the steady-state acquisition,
IDEAL-GRASS = iterative decomposition of water and fat with echo asymmetry and least-squares estimation combined with unspoiled gradient recalled-echo acquired in the steady-state,
IDEAL-SPGR = iterative decomposition of water and fat with echo asymmetry and least-squares estimation combined with spoiled gradient-echo,
COSMIC = coherent oscillatory state acquisition for the manipulation of image contrast,
VIPR-bSSFP = vastly undersampled isotropic projection reconstruction balanced steady-state free precession,
TR: repetition time,
TE: echo time.
Image Evaluation
Qualitative Assessment of Image Quality
Image evaluation was performed with an image processing software program (OsiriX, version 2.7.5, The OsiriX Foundation, Geneva, Switzerland). Three fellowship-trained musculoskeletal radiologists (authors X.X.X., X.X.X., and X.X.X. with 8, 10, and 16 years of clinical experience) independently performed side-by-side comparisons of all 6 sequences obtained during the MR examinations of 5 volunteers randomly chosen from the pool of 10 asymptomatic volunteers and the MR examinations of all 5 patients with knee OA. The radiologists ranked the sequences from 1 to 6, with 1 indicating the best sequence, based upon the following 4 qualitative measures of image quality: overall tissue contrast, clarity of articular surface, quality of reformats, and cartilage lesion conspicuity.
Quantitative Assessment of Image Quality
The quantitative measures were mean cartilage, fluid, muscle, and bone signal-to-noise ratio (SNR) and fluid-cartilage, bone-cartilage, and muscle-cartilage contrast-to-noise ratio (CNR) from all of the healthy volunteers. Muscle and bone SNR were measured by a research assistant with 2 years of experience in image analysis using the double acquisition difference method previously described with parallel imaging (22). Cartilage and fluid SNR was measured by one of the authors (X.X.X.) with 2 years of experience in image analysis. To avoid errors due to subject motion, cartilage and fluid SNR were estimated from 5 regions of interest (ROI) systematically placed throughout the image sets to better account for the spatial variation of noise distribution in parallel imaging and the multi-channel coil. The signal ROI and noise ROI were on average 4mm and 9mm in diameter, respectively. The SNR was calculated by dividing the mean signal by the mean standard deviation of background noise, and the CNR calculated as the absolute value of the difference between the corresponding SNR values. All SNR and CNR values were normalized to voxel size in order to account for differences in voxel size between sequences.
Cartilage Volume Measurements
FSE-Cube and VIPR-bSSFP were the top sequences overall on quantitative and qualitative measures of image quality, prompting these test sequences to be compared to the reference sequence for cartilage morphology, IDEAL-SPGR, for their ability in measuring cartilage volume. The femoral, tibial, and patellar cartilage of the 10 asymptomatic volunteers were manually segmented over a 2-month period by one author (X.X.X.) To assess interobserver variability, the femoral cartilage of 5 randomly chosen asymptomatic volunteers was segmented by another author (X.X.X.) with less than a year of experience in cartilage image analysis. To assess intraobserver variability, the femoral cartilage of one randomly chosen asymptomatic volunteer was segmented 3 separate times by both authors. Cartilage segmentation was supervised by a fellowship-trained musculoskeletal radiologist (X.X.X.) with 12 years of clinical experience
Statistical Analysis
Statistical analysis was performed by using the computer program STATA Release 9.2 (StataCorp LLP, College Station, TX, USA). Differences between sequences in SNR and CNR were pairwise compared using a Sample t-test. Exact binomial tests were used to compare differences in the rankings of the sequences. Accuracy of each of the 2 test sequences for cartilage volume measurement was assessed relative to the reference sequence by calculating the concordance correlation coefficient (CCC), 95% confidence interval, the Bland-Altman 95% limits of agreement, and the mean and standard deviation of the difference between the 2 sequences when the test sequence’s measured volume was subtracted from the reference sequence’s volume. Precision was evaluated by interobserver and intraobserver variabilities. The overall intraclass correlation coefficient (ICC) was calculated by a mixed-effects regression of measured femoral cartilage volume on sequence type with random effects of observer and volunteer. The ICC reported by sequence type was calculated by a random-effects regression of observer and volunteer. For both interobserver and intraobserver variabilities, the mean coefficients of variation (COV) were also calculated. For the CCC, the P-value was the probability that the true value for the correlation is equal to zero. For all other statistical analyses, a P-value less than 0.05 indicated statistical significance.
Results
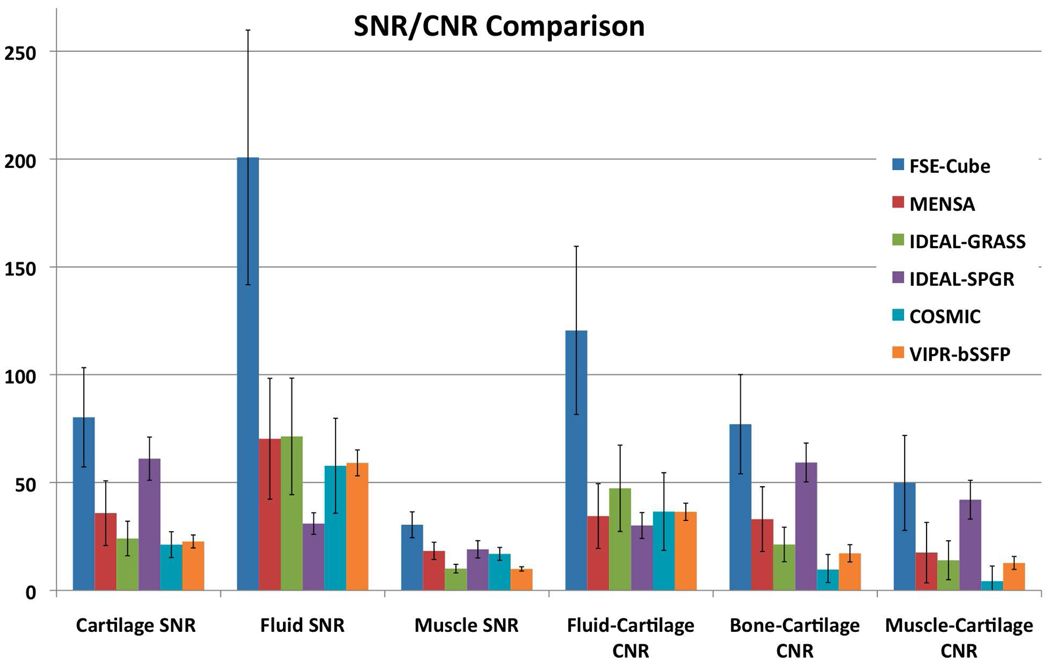
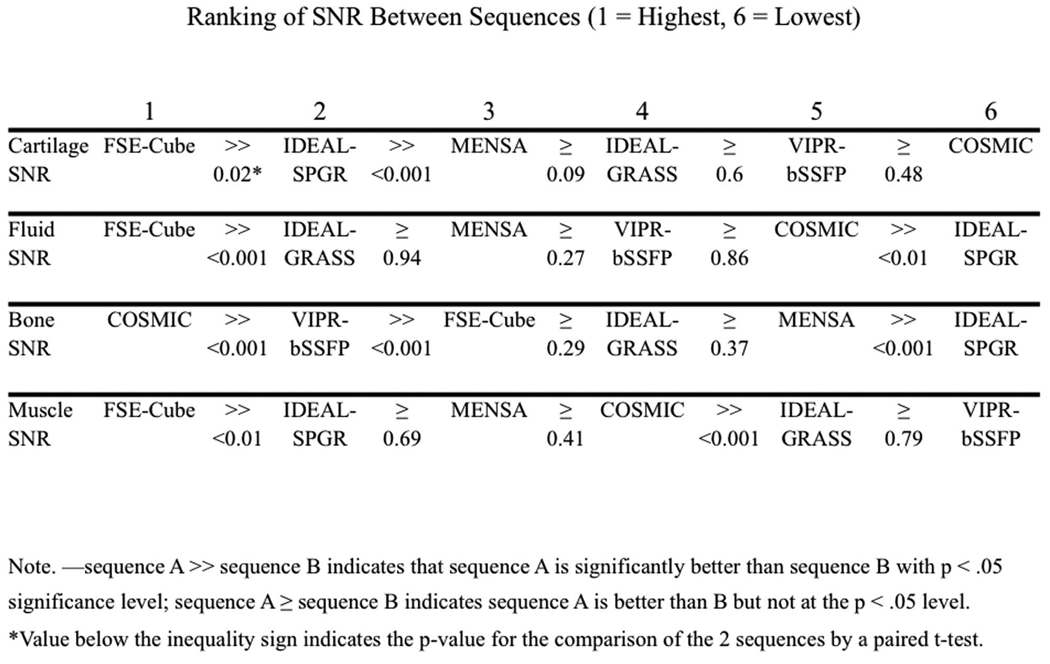
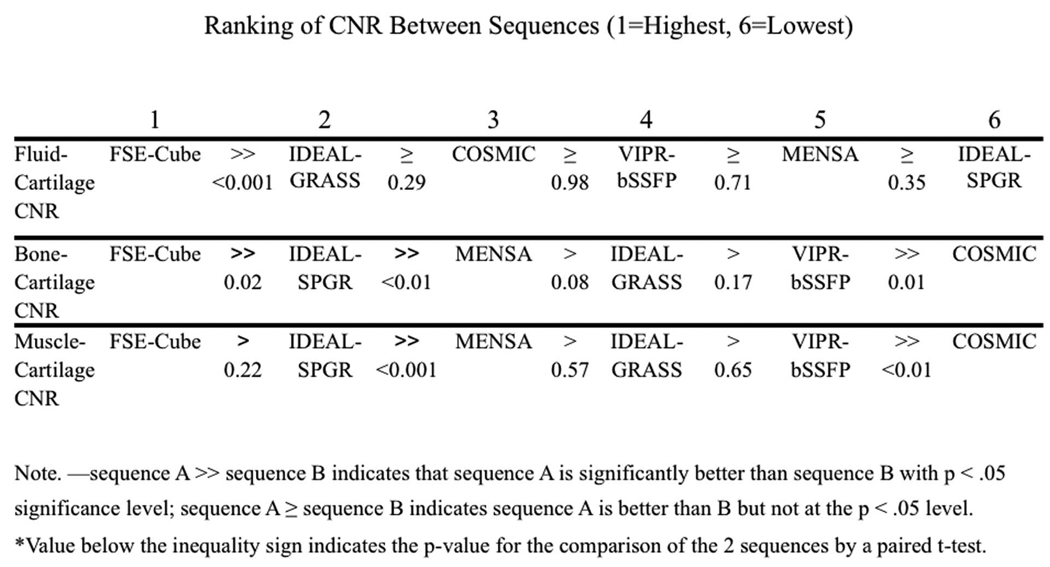
Figure 1 displays the ranks of the sequences for the quantitative measures. FSE-Cube had the highest cartilage SNR (80.23±22.60), which was significantly higher than all other sequences (P<0.02). IDEAL-SPGR had the second-highest cartilage SNR (61.06±9.38), which was significantly greater (P<0.001) than the statistically comparable (P>0.08) cartilage SNR values of MENSA, IDEAL-GRASS, VIPR-bSSFP, and COSMIC. FSE-Cube (200.78±58.83) also had the highest fluid SNR that was significantly greater (P<0.001) than the other sequences. IDEAL-SPGR had the lowest fluid SNR (30.98±4.74) that was significantly lower (P<0.01) than the comparable (P>0.2) values of IDEAL-GRASS, MENSA, VIPR, and COSMIC. COSMIC had the highest bone SNR (11.55±2.80) that was significantly greater (P<0.01) than all other sequences, particularly the lowest bone SNR of IDEAL-SPGR (1.78±0.35). FSE-Cube had the highest muscle SNR (30.42±6.36) that was significantly higher than the rest of the sequences (P<0.03). IDEAL-GRASS (10.09±1.81) and VIPR-bSSFP (9.95±1.05) had the lowest muscle SNR values. FSE-Cube had the highest fluid-cartilage CNR (120.56±39.21) that was significantly greater (P<0.001) than the statistically comparable (P>0.2) CNR values of all other sequences. For bone-cartilage CNR and muscle-cartilage CNR, FSE-Cube had the highest values and IDEAL-SPGR the second-highest values. FSE-Cube had significantly greater bone-cartilage and muscle-cartilage CNR values than all other sequences (P<0.02), except for being statistically equivalent with IDEAL-SPGR for muscle-cartilage CNR (P>0.2).
Figure 1.
SNR and CNR comparison among the 6 different sequences in all healthy volunteers. (a) FSE-Cube had the statistically highest SNR and CNR (all P<0.02), except for bone SNR for which IDEAL-SPGR had the best fat suppression, and for muscle-cartilage CNR for which FSE-Cube was not greater at a significant level than IDEAL-SPGR (P>0.2). Paired t-test P-values and rankings of subsequently lower (b) SNR and (c) CNR values for the 6 sequences. IDEAL-SPGR had the second-highest cartilage SNR, but also the lowest fluid-cartilage CNR and the lowest fluid SNR that was statistically less than all other sequences. High fluid-cartilage CNR is desirable, as it aids in the detection of cartilage surface pathology.
Table 2 shows the ranks of the sequences for the qualitative measures. VIPR-bSSFP had the best tissue contrast that was significantly better (P<0.04) than FSE-Cube, COSMIC, and the last-ranking IDEAL-SPGR. VIPR-bSSFP ranked highest for clarity of articular surface, with VIPR-bSSFP being statistically superior (P<0.03) to FSE-Cube, MENSA, and the last-ranking IDEAL-SPGR. IDEAL-GRASS ranked second for clarity of articular sequence, and was statistically comparable to VIPR-bSSFP (P>0.7). FSE-Cube and VIPR-bSSFP were equally ranked for best reformatting ability, with their scores significantly greater (all P<0.005) than the tied second-ranking MENSA and COSMIC and tied third-ranking IDEAL-GRASS and IDEAL-SPGR. FSE-Cube was the top-ranking sequence for lesion conspicuity, though its score was not statistically superior (P>0.06) to any of the other sequences. VIPR-bSSFP was ranked as second, and IDEAL-SPGR as worst for lesion conspicuity, with no statistical significance (P>0.3) between subsequently ranked sequences.
Table 2.
Average Sequence Ranking† for Qualitative Measures of Image Quality for All Reviewers Combined
| FSE-Cube | MENSA | IDEAL- GRASS |
IDEAL- SPGR |
COSMIC | VIPR- bSSFP |
|
|---|---|---|---|---|---|---|
| Overall Tissue Contrast | 2.98* (3) | 3.10 (4) | 2.50 (2) | 6.00* (6) | 4.15* (5) | 2.27* (1) |
| Clarity of Articular Surface | 3.75* (4) | 4.07* (5) | 3.08 (2) | 4.87* (6) | 3.15 (3) | 2.08* (1) |
| Quality of Reformats | 1.50* (1) | 3.50* (2) | 5.50* (3) | 5.50* (3) | 3.50* (2) | 1.50* (1) |
| Cartilage Lesion Conspicuity | 1.83 (1) | 3.53 (5) | 3.40 (3) | 5.93 (6) | 3.40 (3) | 2.90 (2) |
Data are the average sequence ranking; numbers in parentheses are the ordinal rankings of the sequences with 1 being the best sequence and 6 being the worst sequence.
Statistically significant difference (P<0.05) between best-ranked sequence and other sequences.
Pooling across qualitative and quantitative measures, FSE-Cube scored as the best sequence in 8 of the 11 categories. VIPR-bSSFP was the second-best sequence, scoring as the top sequence in 3 categories. Accuracy and precision of FSE-Cube and VIPR-bSSFP in cartilage morphology were calculated in comparison to IDEAL-SPGR. The overall CCCs of FSE-Cube (0.998; 95% confidence interval: 0.997, 0.999; P<0.001) and VIPR-bSSFP (0.999; 95% confidence interval: 0.997, 0.999; P<0.001) demonstrate the high accuracy of both FSE-Cube and VIPR-bSSFP in measuring cartilage volumes (Figure 2a). Figure 2b displays the similar volume measurements produced by all 3 sequences in the femoral cartilage of the healthy volunteers. The overall mean differences in measured volume between the test and reference sequences were −0.02±0.24mL for FSE-Cube and 0.01±0.23mL for VIPR-bSSFP (Figure 2a).
Figure 2.
Comparison between test sequence, FSE-Cube or VIPR-bSSFP, with reference sequence, IDEAL-SPGR, of segmented volumes of all healthy volunteer knees. (a) Both FSE-Cube and VIPR-bSSFP have the potential to replace IDEAL-SPGR for cartilage volume measurement, as statistical analysis for reproducibility found both test sequences to have high CCCs and low variability in 95% Bland-Altman limits of agreement. (b) An example of the similar volume measurements produced by the 3 sequences in the femoral cartilage.
For precision, the variability in differences was low, with the greatest standard deviations across the knee regions being ±0.36 mL in the femur for FSE-Cube, and ±0.29 mL in the tibia for VIPR-bSSFP. The Bland-Altman 95% limits of agreement indicated that 95% of the overall volume measurement differences are (−0.49, 0.54 mL) for FSE-Cube, and (−0.47, 0.44 mL) for VIPR-bSSFP. Precision was very high, with femoral ICCs of 0.996 for IDEAL-SPGR, 0.994 for FSE-Cube, and 0.976 for VIPR-bSSFP. Interobserver reproducibility was also high, with low interobserver COVS of 0.7% for IDEAL-SPGR, 1.0% for FSE-Cube, and 2.4% for VIPR-bSSFP. Intraobserver variability was low, with intraobserver COVs of 1.0% for IDEAL-SPGR, 1.4% for FSE-Cube, and 1.2% for VIPR-bSSFP (Table 3).
Table 3.
Comparison of IDEAL-SPGR, FSE-Cube, and VIPR-bSSFP in Reproducibility of Volumetric Quantification
| IDEAL-SPGR | FSE-Cube | VIPR-bSSFP | Overall | |
|---|---|---|---|---|
| Femoral ICC | 0.996 | 0.994 | 0.976 | 0.98 |
| Interobserver COV (%) | 0.7 | 1.0 | 2.4 | 1.9 |
| Intraobserver COV (%) | 1.0 | 1.4 | 1.2 | 1.4 |
ICC = intraclass correlation coefficient,
COV = coefficient of variation.
Discussion
This was the first study that compared 6 promising, newly developed three-dimensional cartilage imaging MR pulse sequences in the same cohorts of asymptomatic volunteers and patients with knee OA. Overall, FSE-Cube followed by VIPR-bSSFP ranked highest across the quantitative and qualitative measures of image quality.
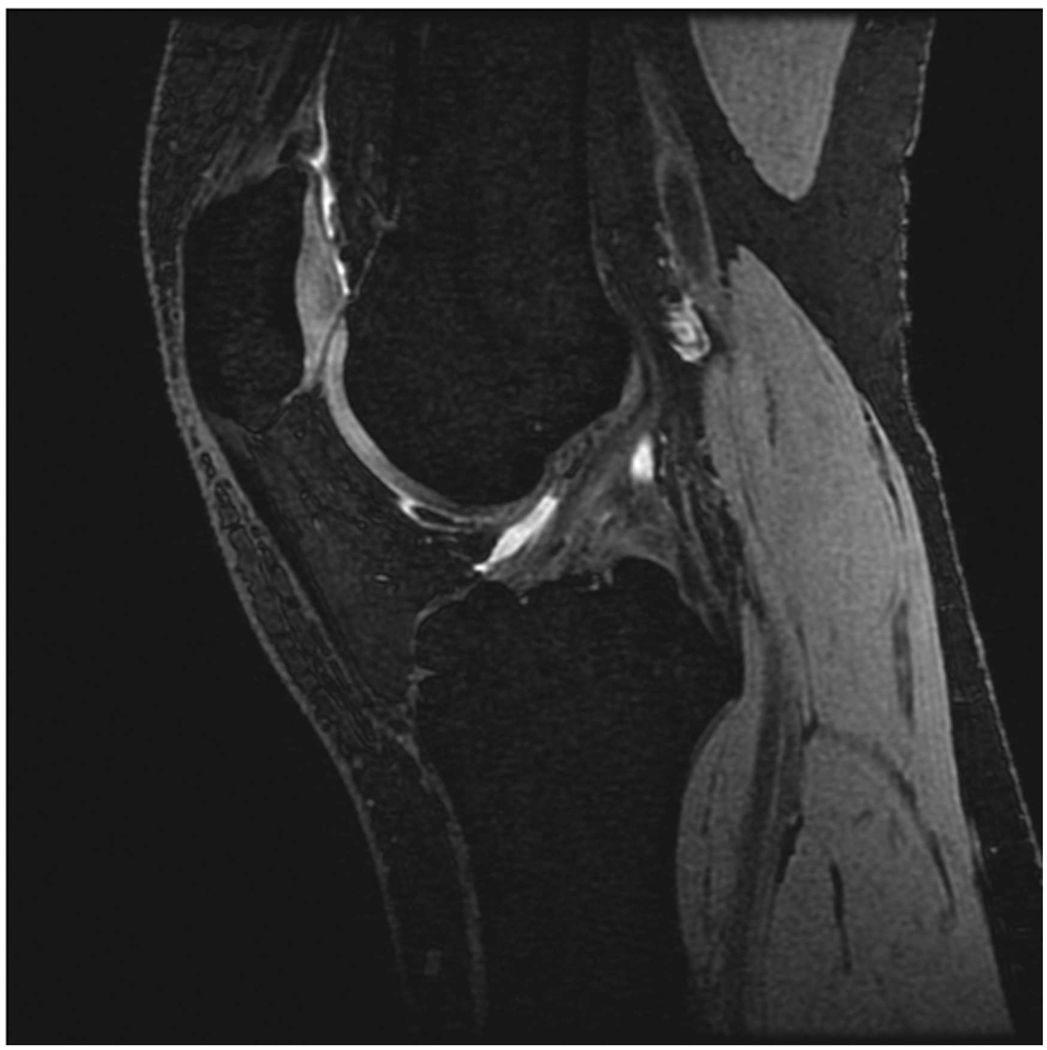
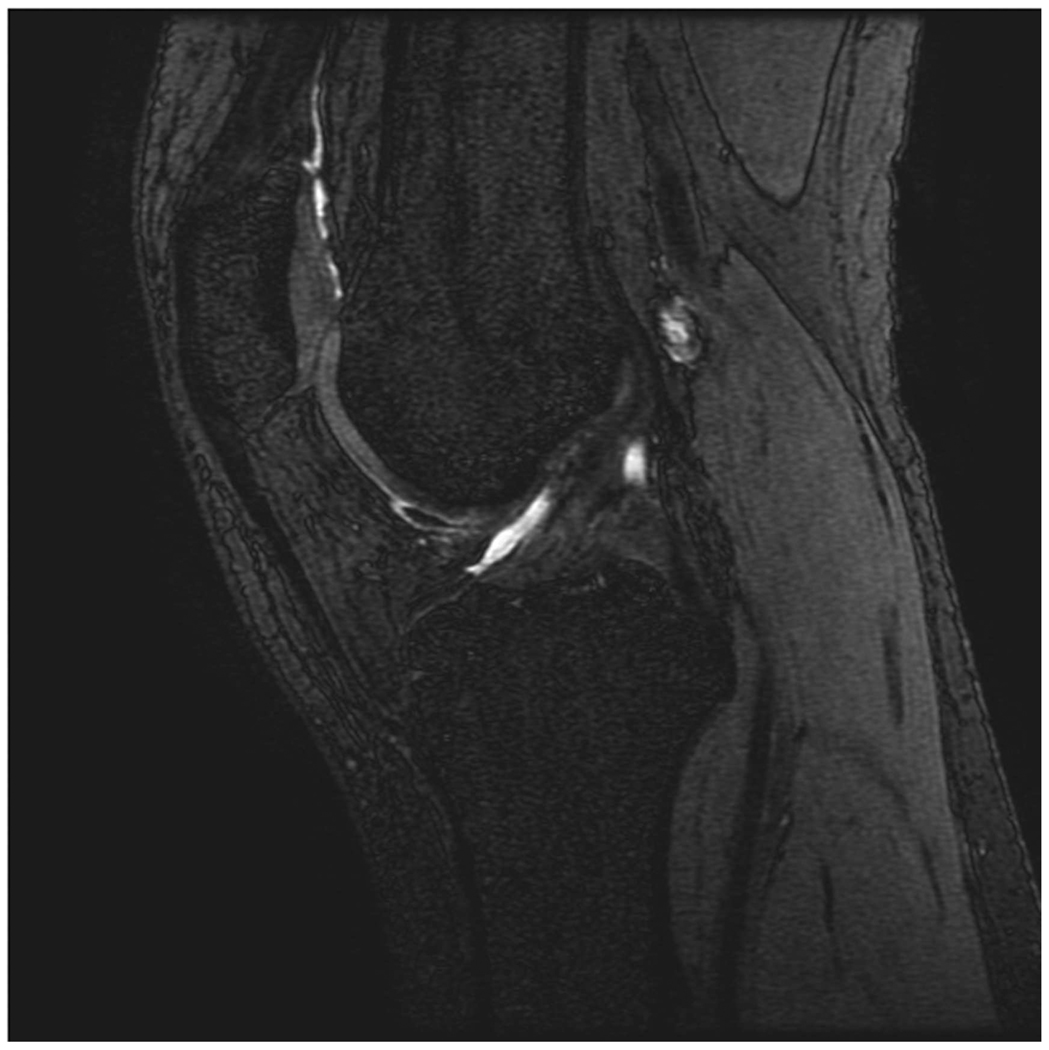
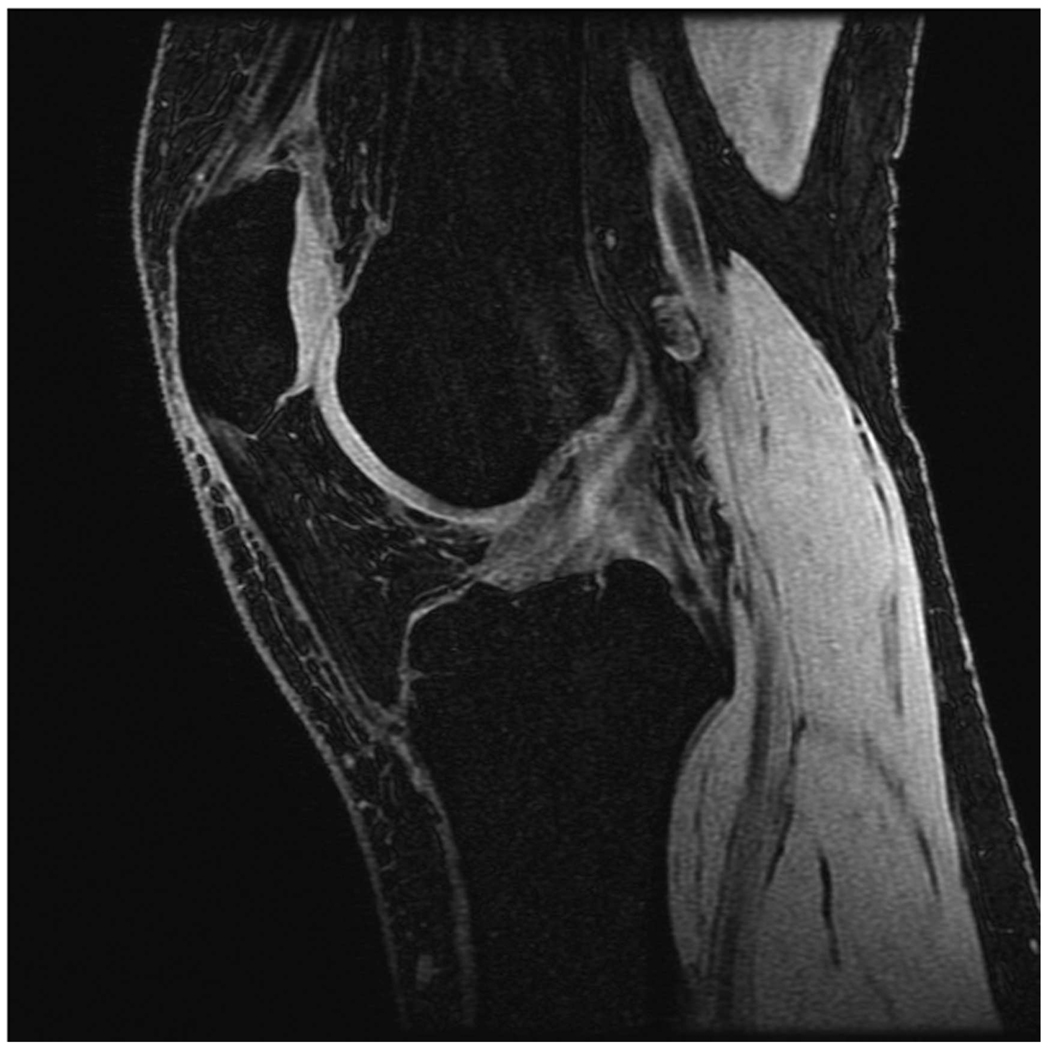
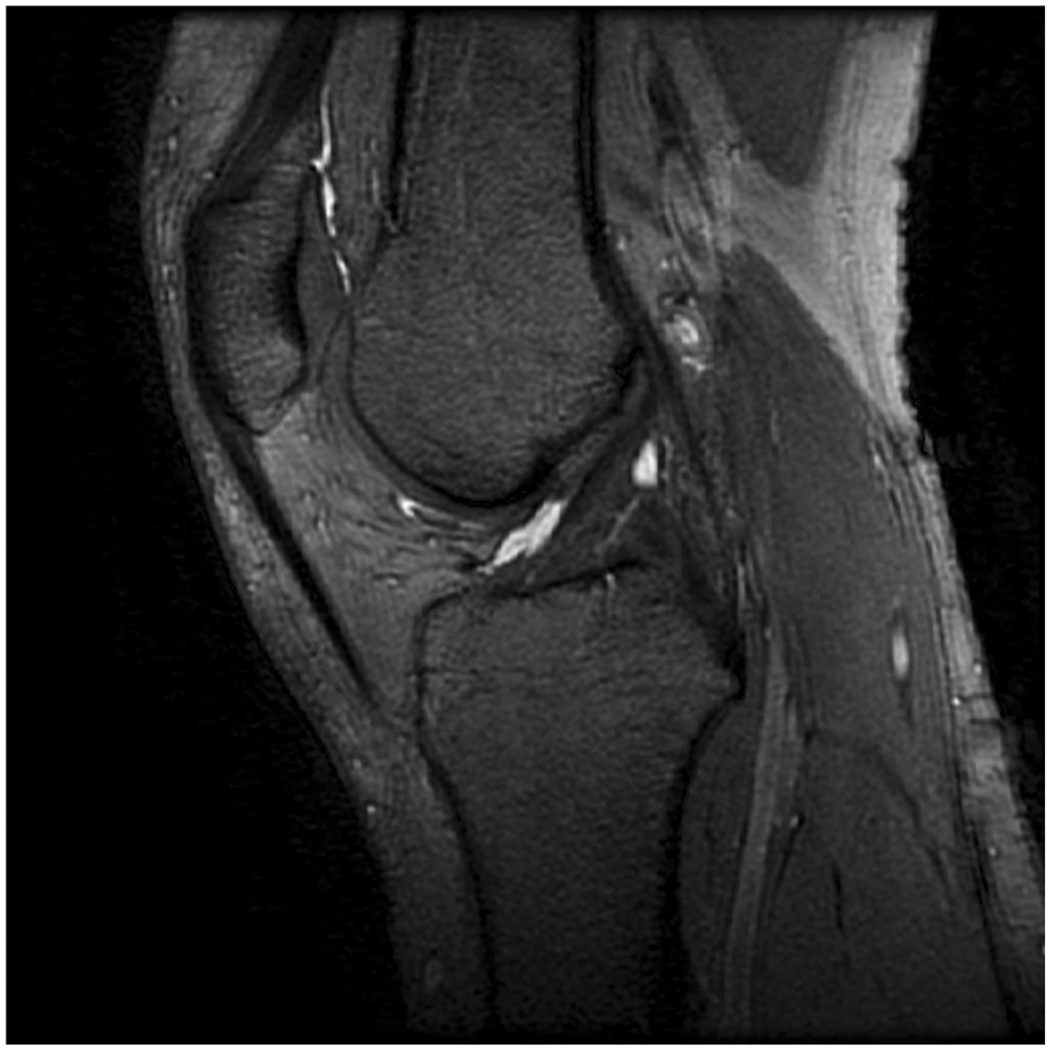
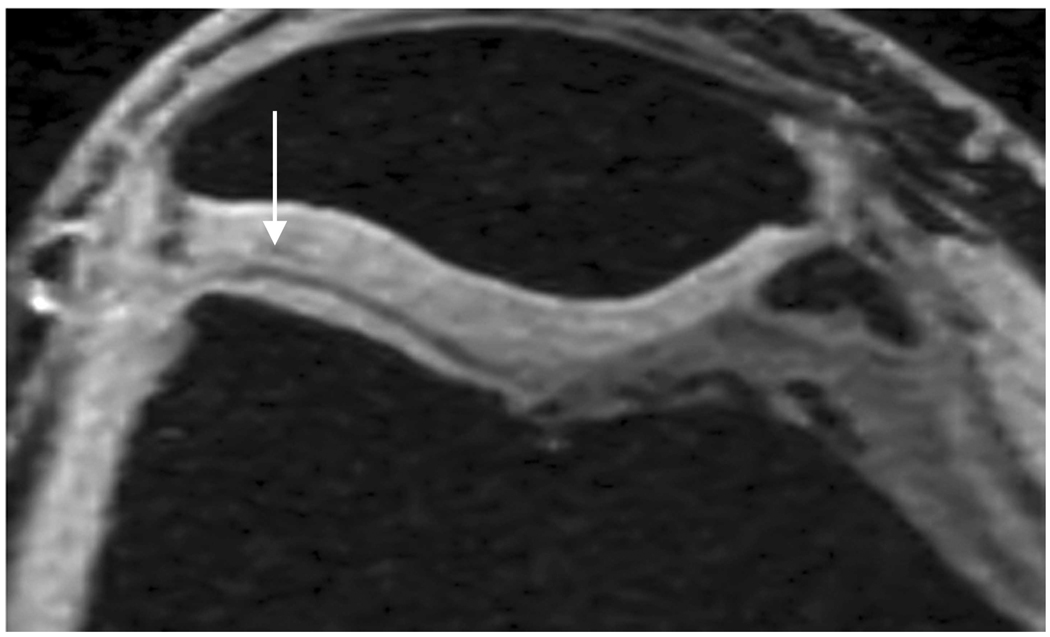
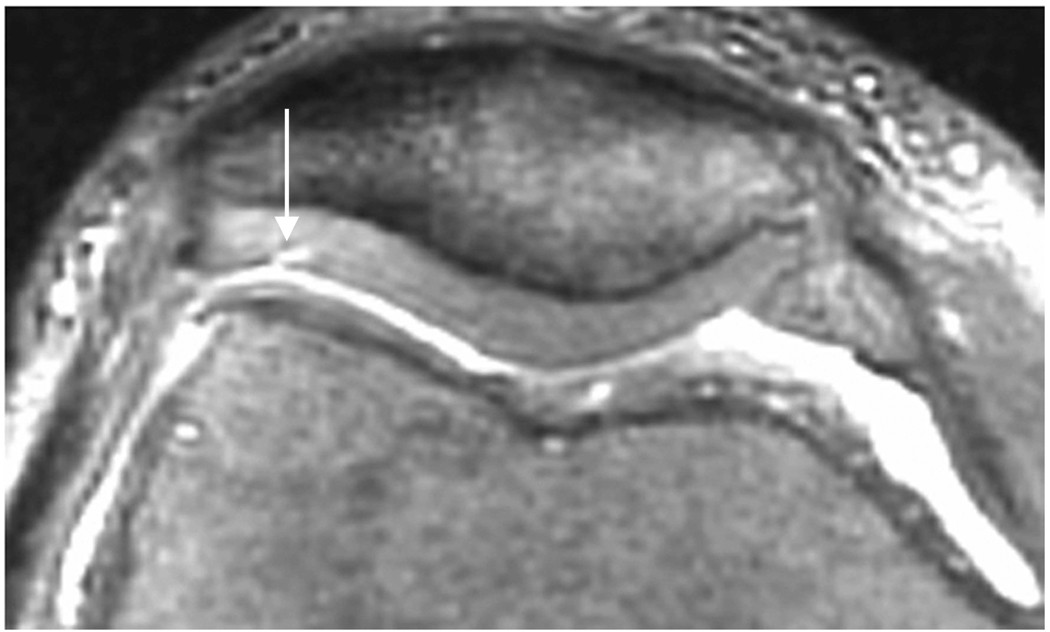
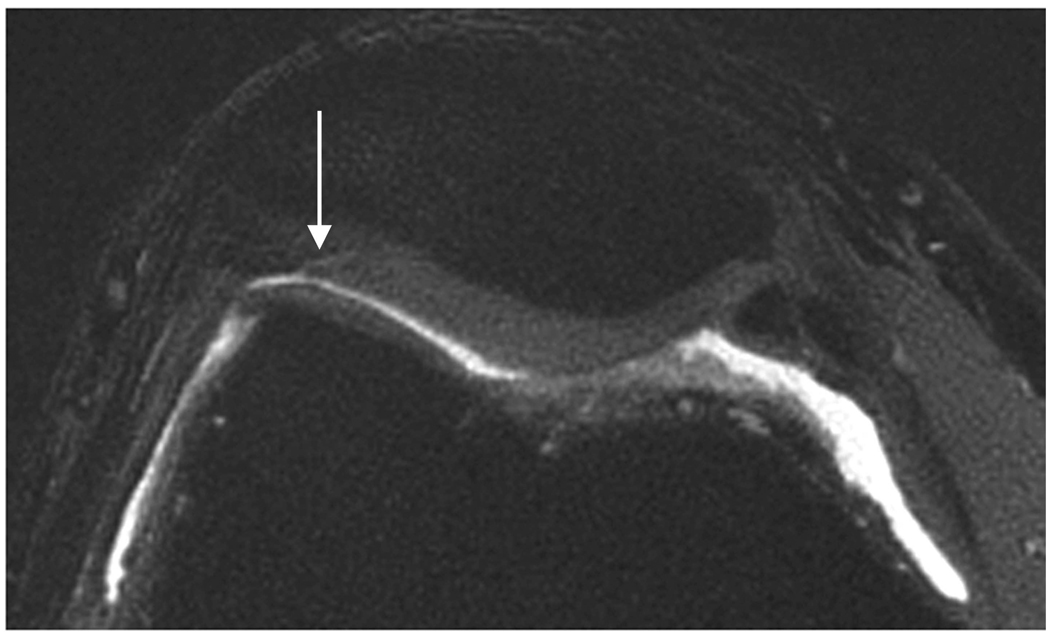
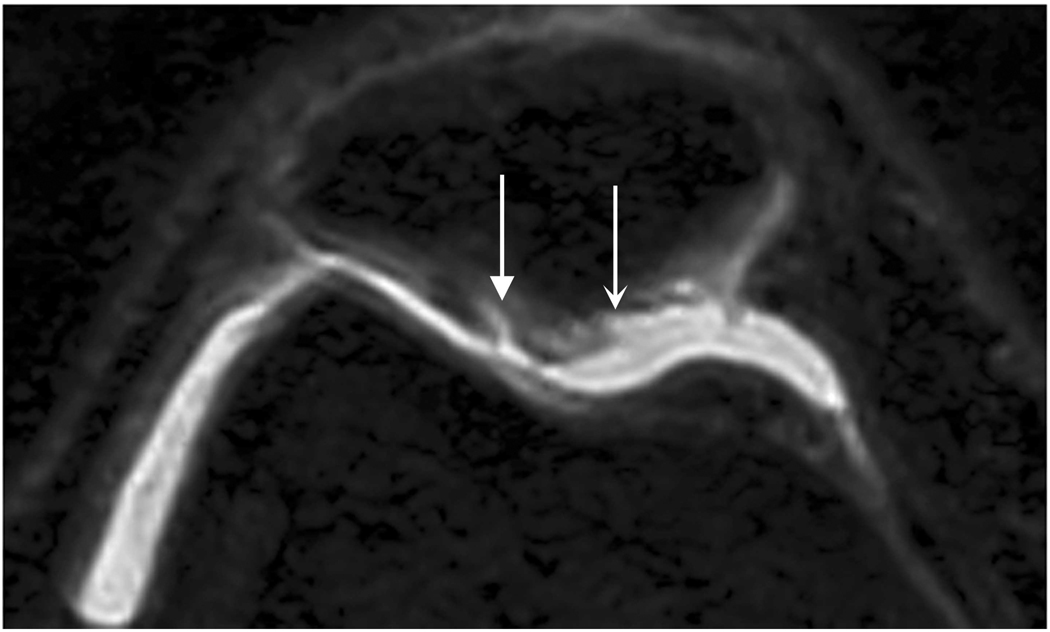
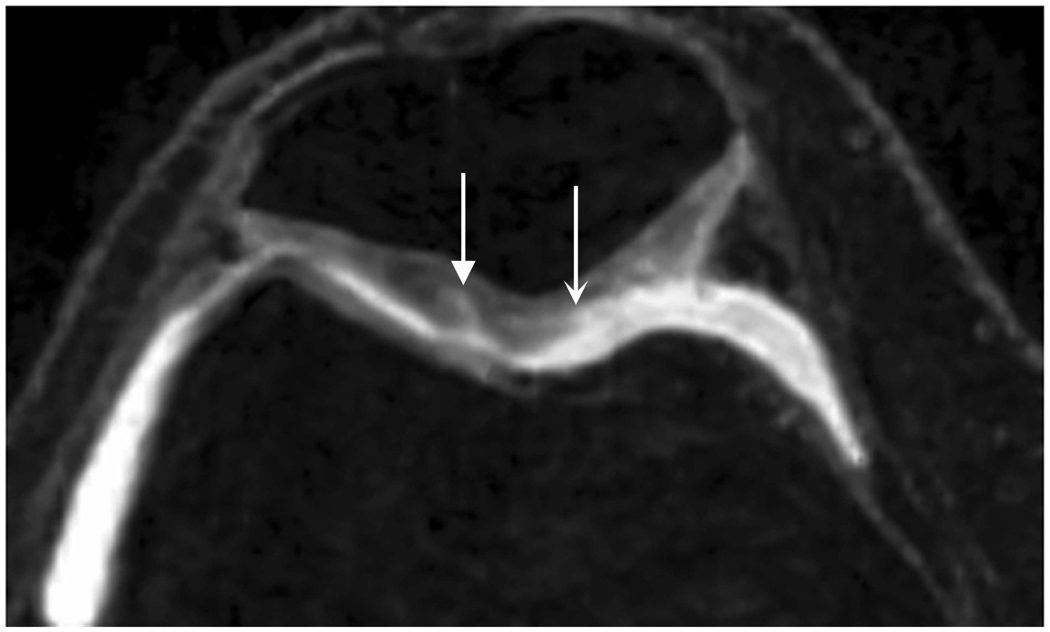
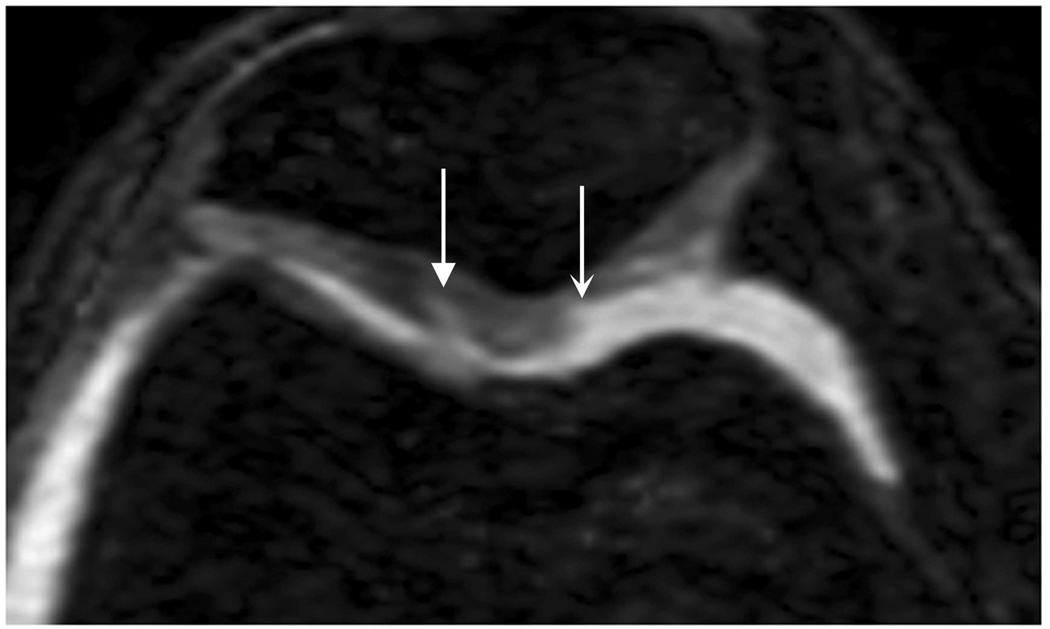
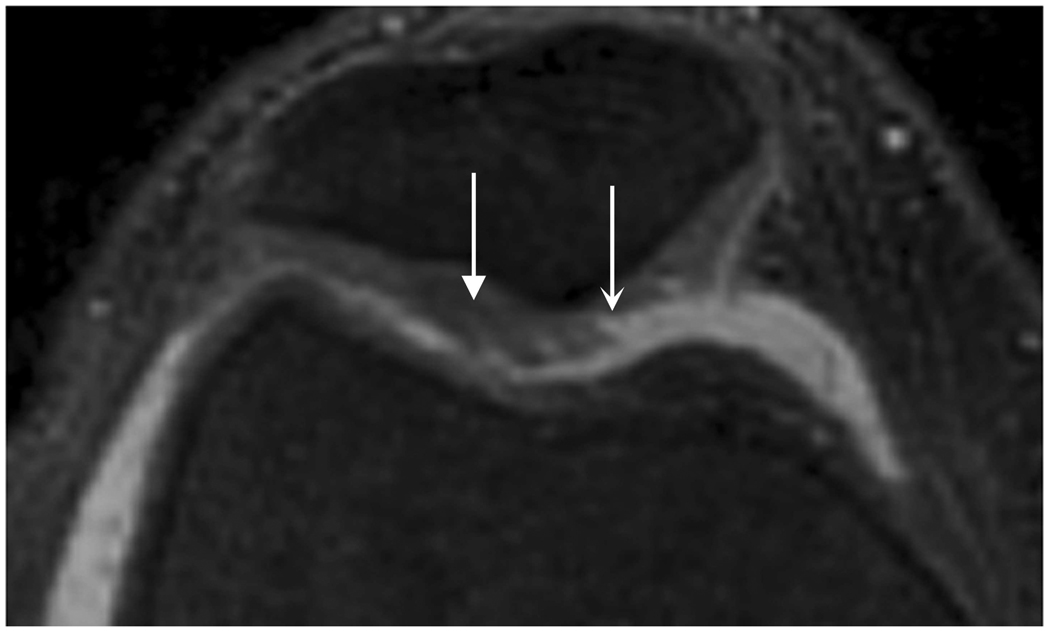
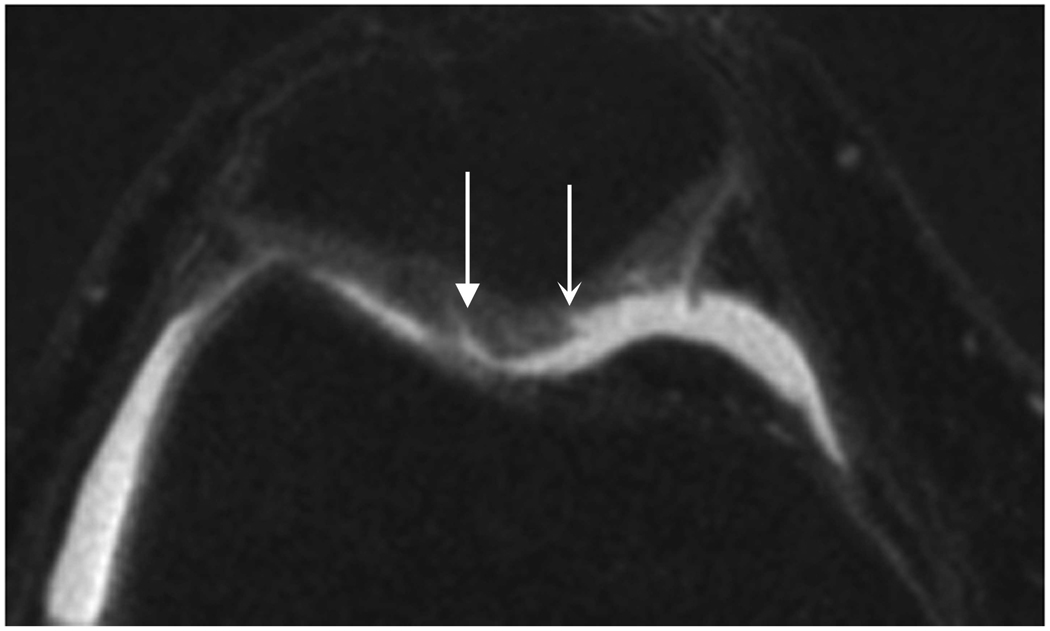
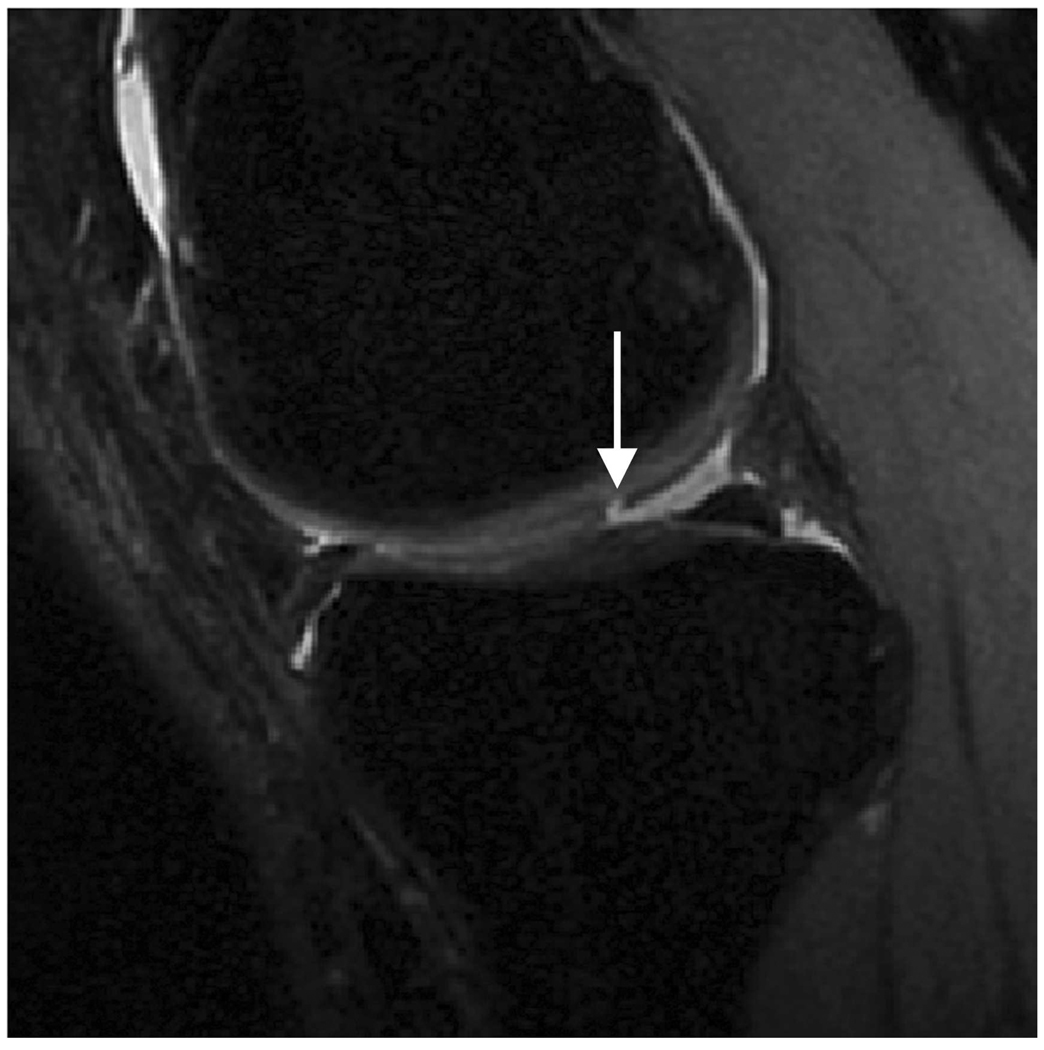
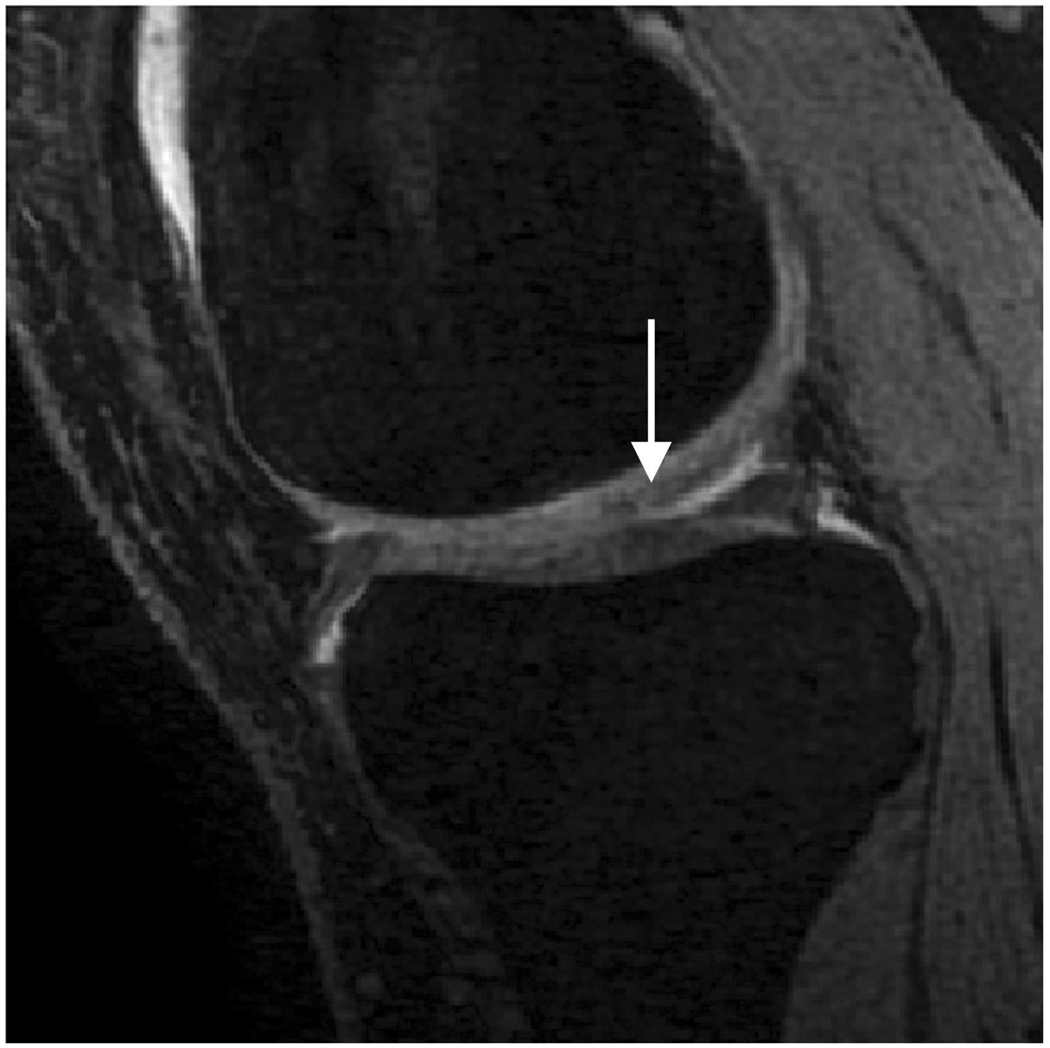
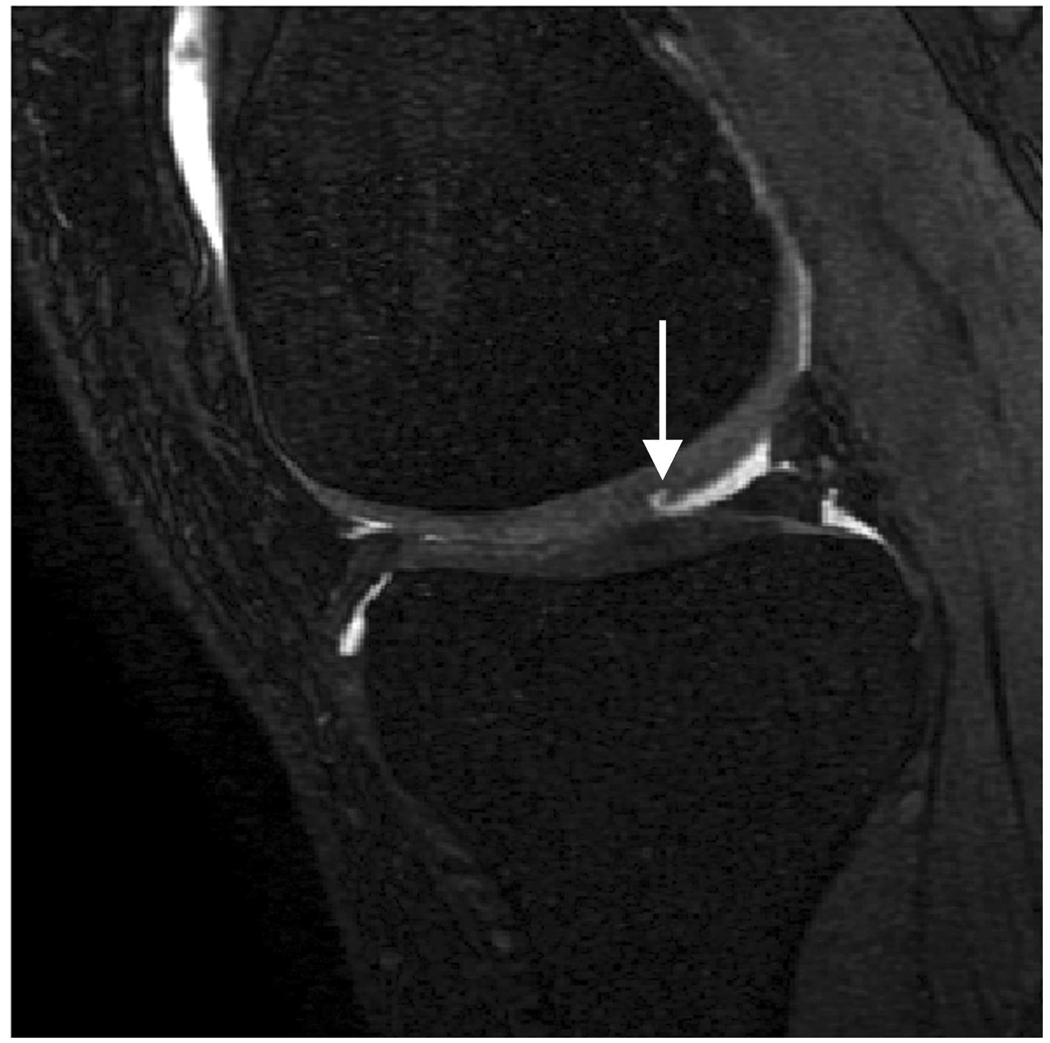
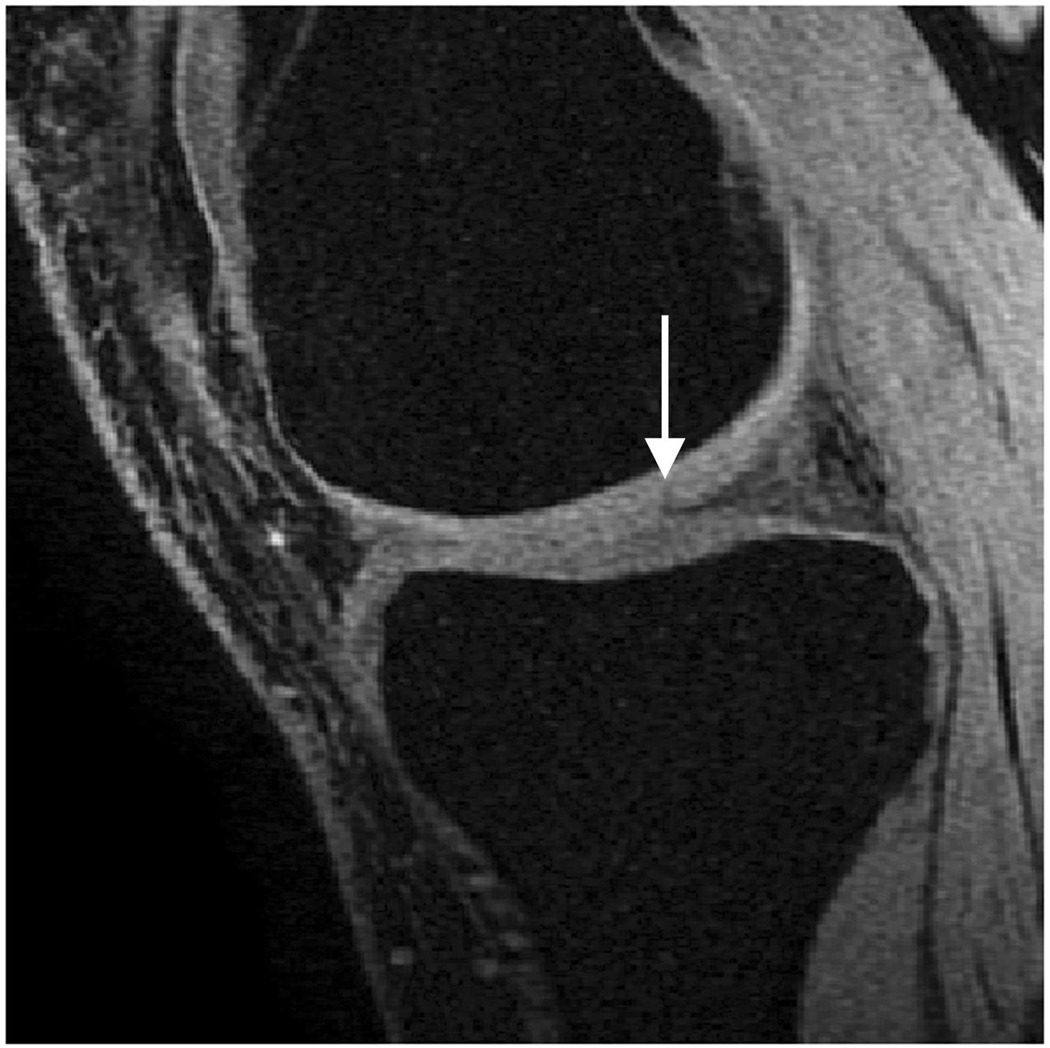
3D-FSE-Cube retains the advantages of 2D-FSE while also addressing its limitations. FSE-Cube maintains the proton density contrast of 2D-FSE characterized by bright synovial fluid and intermediate cartilage signal (Figure 3). This contrast is conducive to the detection of cartilage defects, demonstrated by the top-rankings of FSE-Cube for both fluid-cartilage CNR and cartilage lesion conspicuity. As seen in Figures 4–6, the bright fluid of FSE-Cube highlights the cartilaginous fissures and partial-thickness defects in patients with knee OA (12), as opposed to the dark fluid of T1-weighted IDEAL-SPGR that makes this detection more difficult. While the synovial fluid is bright, the high signal of both cartilage and muscle is preserved. The top-ranking cartilage and muscle SNRs of FSE-Cube are most likely due to its reduced magnetization transfer effect and reduced TE from ARC parallel imaging (23). The top-ranked bone-cartilage CNR and muscle-cartilage CNR of FSE-Cube may also be helpful in distinguishing the boundaries of cartilage for volume segmentation.
Figure 3.
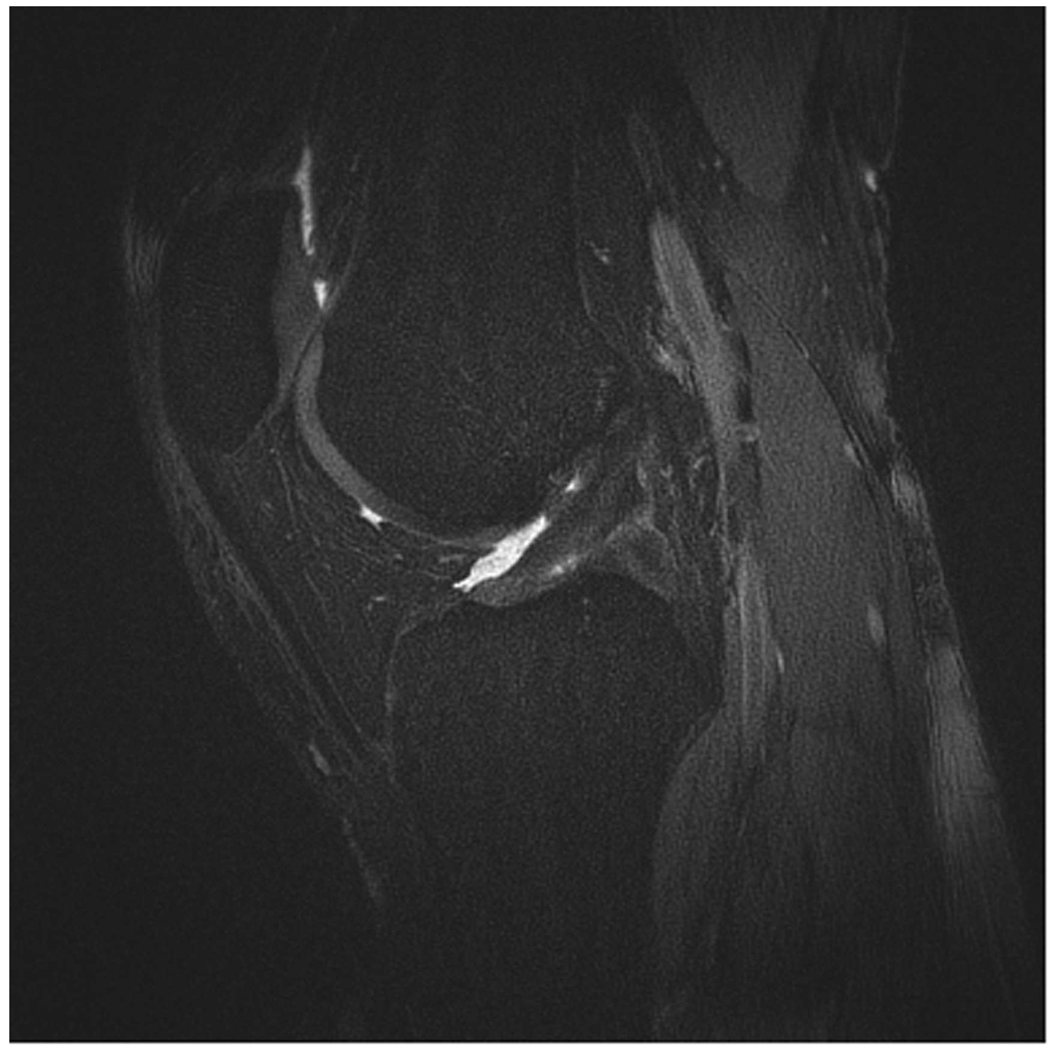
Sagittal MR images in healthy volunteer. (a) FSE-Cube (TR/TE, 2217/23.6 msec; flip angle, 90°), (b) MENSA (16.7/5.7; 30°), (c) IDEAL-GRASS (12.4/5.3; 14°), (d) IDEAL-SPGR (12.4/5.3; 14°), (e) COSMIC (4.6/1.3; 35°), and (f) VIPR-bSSFP (3.6/0.3; 15°) images. T1-weighted IDEAL-SPGR has dark synovial fluid near the femoral-tibial joint (d, wedge-shaped arrow) and the patellar-femoral joint (d, curved arrow), while the other sequences have higher T2 weighting and bright synovial fluid clearly delineating adjacent cartilage.
Figure 4.
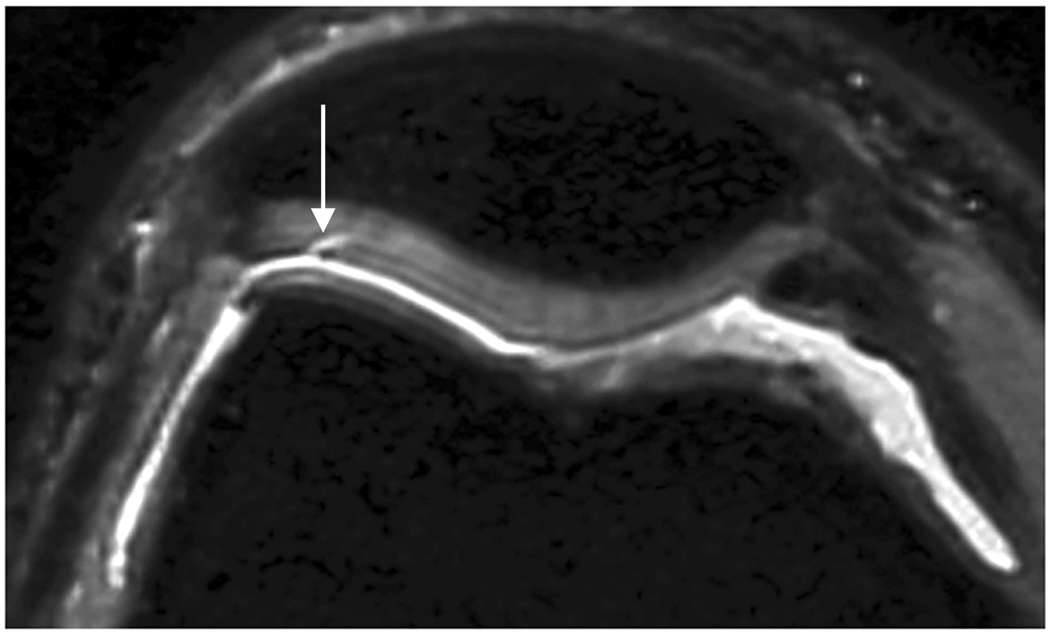
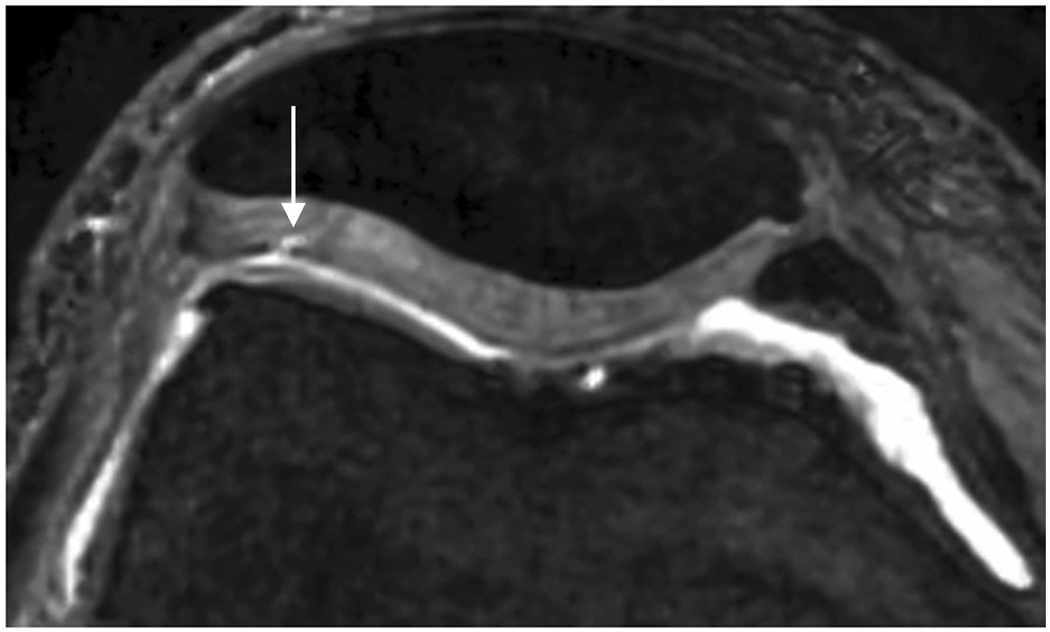
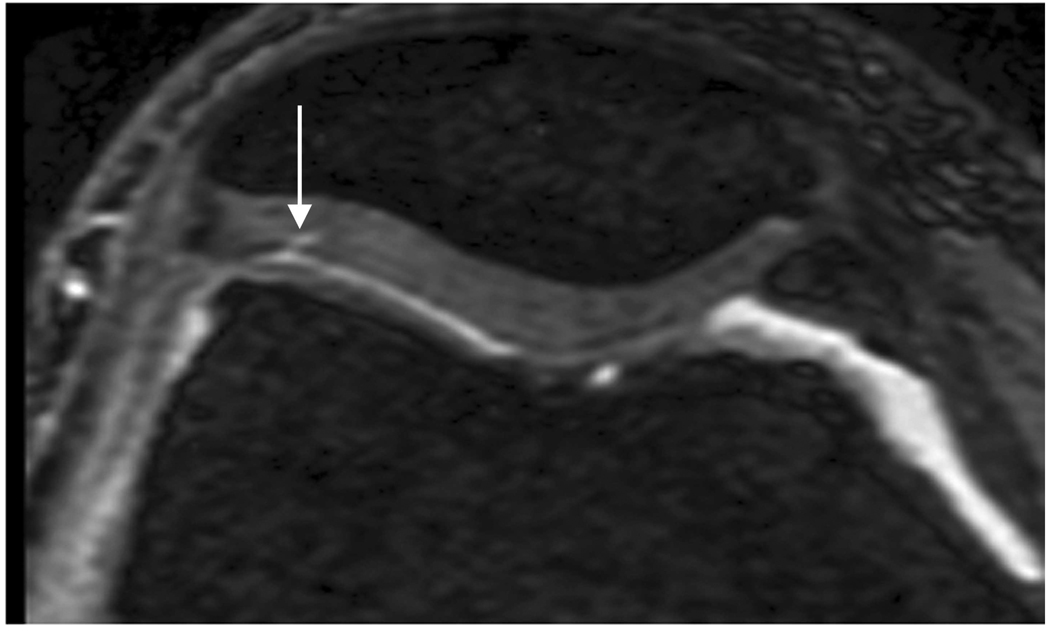
Axial MR image reformations in osteoarthritic patient. Bright synovial fluid highlights superficial cartilage fissure on lateral patellar facet (arrows) in (a) FSE-Cube, (b) MENSA, (c) IDEAL-GRASS, (e) COSMIC, and (f) VIPR-bSSFP images, but is not present in (d) IDEAL-SPGR image.
Figure 6.
Axial MR image reformations show superficial cartilage fissure on lateral patellar facet (wedge-shaped arrows) and partial-thickness cartilage defects on medial patellar facet (curved arrows) in osteoarthritic patient by (a) FSE-Cube, (b) MENSA, (c) IDEAL-GRASS, (d) IDEAL-SPGR, (e) COSMIC, and (f) VIPR-bSSFP sequences.
FSE-Cube may also save scan time, as its multi-planar reformats can make multiple 2D-FSE acquisitions unnecessary. These reformats, as shown in Figures 4 and 6, were rated as the best along with VIPR-bSSFP. FSE-Cube can also be used to evaluate other joint structures in addition to articular cartilage. A recent study with arthroscopic correlation found the 5-minute 3D-FSE-Cube scan to have similar diagnostic performance of ligament, meniscal, and cartilage defects of the knee as a routine 25-minute protocol of multiple 2D-FSE acquisitions (24). However, one disadvantage of FSE-Cube is image blurring due to acquisition of high spatial frequencies late in the echo train. Image blurring was likely the cause of the relatively low ranks given to FSE-Cube on the subjective criterion of articular surface clarity.
VIPR-bSSFP performed second-best overall, ranking as the best sequence for clarity of articular surface and overall tissue contrast. These top rankings are most likely due to the contrast between the cartilage and the bright fluid, produced by VIPR-bSSFP’s mixed T2/T1 contrast. In addition, none of the VIPR-bSSFP images had banding artifact, a main challenge to bSSFP techniques in areas of B0 field inhomogeneity (25). VIPR-bSSFP prevents signal dropout in the presence of field inhomogeneity by having a very short TR that broadens the passband. VIPR-bSSFP also has excellent reformats, tied for the top ranking with FSE-Cube, because its radial k-space acquisition is inherently isotropic (15).
Besides FSE-Cube and VIPR-bSSFP, COSMIC is the only other sequence to have a best ranking. However, the highest bone SNR of COSMIC means that it has poor fat suppression. COSMIC has been previously applied to myelographic imaging of the cervical spine (20).
MENSA, IDEAL-SPGR, and IDEAL-GRASS performed moderately well. MENSA ranked in the middle for fluid SNR, with a statistically greater fluid SNR than that of IDEAL-SPGR, due to its averaging of 2 echoes in each TR to produce high fluid signal (10,26). IDEAL-SPGR had the second-highest cartilage SNR, as a result of the T1-weighting of SPGR, in addition to the optimal placement of echoes in IDEAL to maximize SNR performance (27). The second-highest rankings of IDEAL-GRASS for overall tissue contrast and clarity of articular surface probably result from high contrast at the bright fluid-darker cartilage interface, as well as the IDEAL water-fat separation method that provides robust fat suppression. This study did not test IDEAL for its advantage in field inhomogeneities, since the knee is positioned at the center of scanning where B0 is most homogeneous. However, IDEAL would be advantageous for imaging knees with metallic implants due to the robustness of IDEAL to metal-induced inhomogeneity, and for other joints such as the ankle.
In addition to being promising based on qualitative and quantitative measures, FSE-Cube and VIPR-bSSFP have the potential to assess cartilage volume accurately and precisely. Measurements of reproducibility, such as the CCC, were very high across all knee regions, indicating the similar performance of FSE-Cube or VIPR-bSSFP to the reference standard IDEAL-SPGR (28) in measuring cartilage volume. Volume differences between each of the test sequences and IDEAL-SPGR had low 95% Bland-Altman Limits of Agreement, showing that FSE-Cube and VIPR-bSSFP were accurate in their volume measurements. For measures of precision, FSE-Cube and VIPR-bSSFP yielded ICCs, intraobserver reproducibilities, and interobserver reproducibilities similar to that produced by IDEAL-SPGR in this study and those reported for FS-SPGR in comparable studies (29–31).
Our study had several limitations. The difference method for measuring SNR may not give accurate results in small pockets of fluid and thin cartilage, due to image misregistration from patient motion between scans. Hence, fluid and cartilage SNRs were estimated by the conventional SNR method modified to better account for the spatial distribution of noise in parallel imaging and multi-channel coils. Another limitation is that cartilage volume was segmented from images of healthy volunteers, instead of symptomatic patients which may have more complex segmentation. This study is an initial investigation of the use of FSE-Cube and VIPR-bSSFP in quantitative cartilage morphology, and future studies of osteoarthritic cartilage will be needed to evaluate these methods in OA patients. Lastly, axial reformats were used to evaluate cartilage lesion conspicuity. As a consequence, anisotropic acquisitions, such as that of IDEAL-SPGR and IDEAL-GRASS, had poorer reformatting ability that may have made them more likely to be ranked worse for cartilage lesion conspicuity. A future study can explore the use of 2D parallel imaging with IDEAL, COSMIC, and MENSA in place of ASSET parallel imaging to improve the lower spatial resolution that affected the reformatting ability of these sequences.
In conclusion, FSE-Cube and VIPR-bSSFP have the highest ranks for quantitative and qualitative image quality of 6 new three-dimensional sequences for evaluating the articular cartilage of the knee joint. FSE-Cube has high cartilage and fluid SNR, and high fluid-cartilage and bone-cartilage CNR that are statistically superior to IDEAL-SPGR. FSE-Cube and VIPR-bSSFP also have similar accuracy and precision as IDEAL-SPGR for measuring cartilage volume. FSE-Cube and VIPR-bSSFP show great promise for providing rapid, multi-planar evaluation of articular cartilage, and either may provide a single MR pulse sequence well suited for comprehensive knee joint assessment in clinical practice and OA research studies.
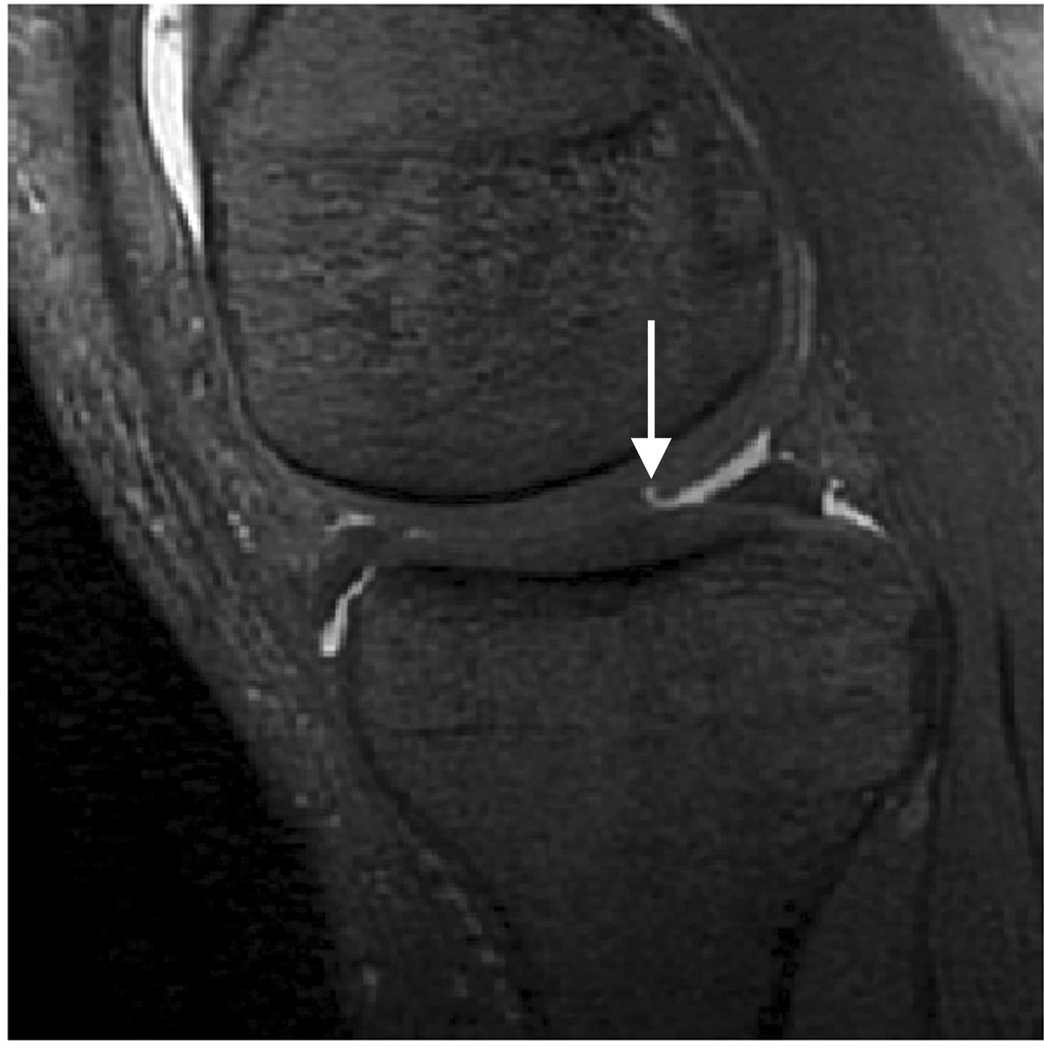
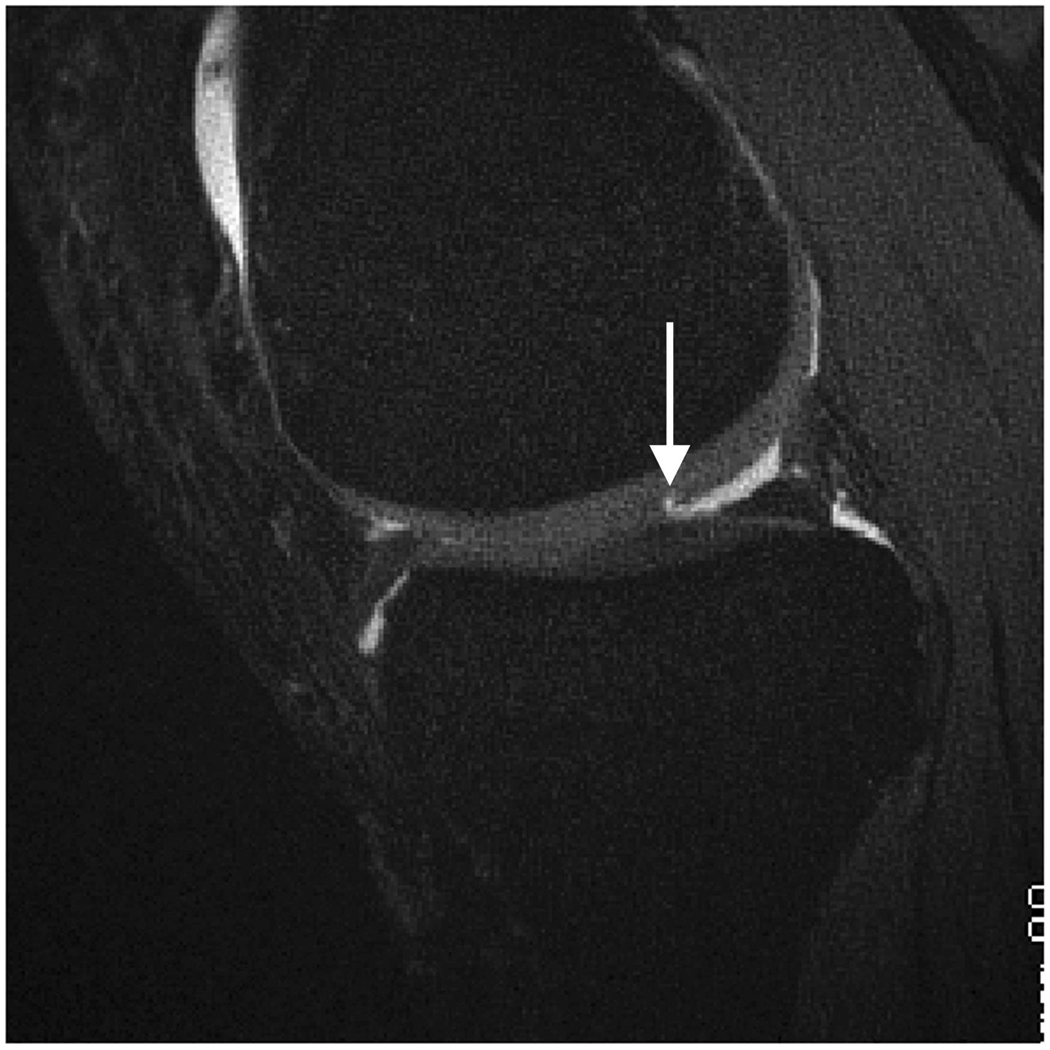
Figure 5.
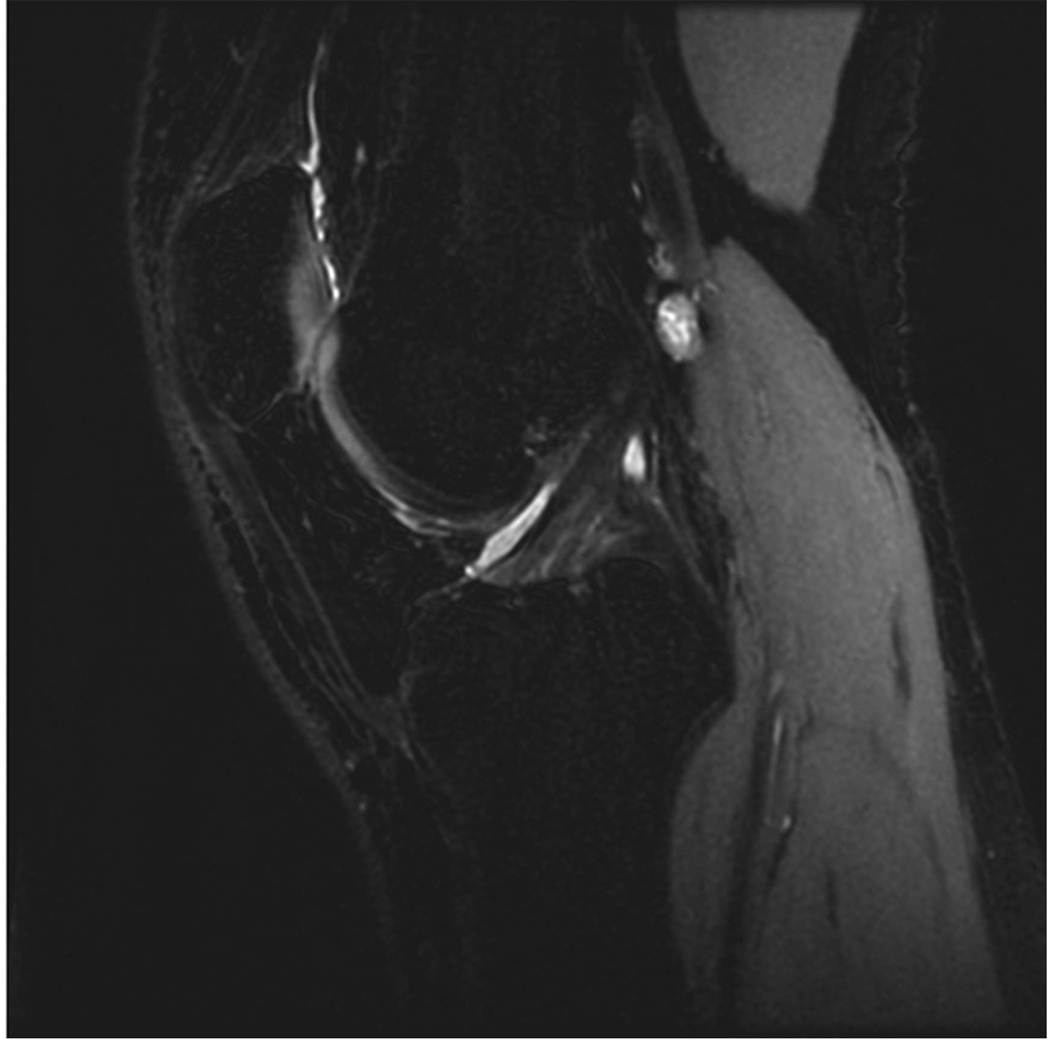
Sagittal MR images show superficial cartilage fissure on medial femoral condyle (arrows) in osteoarthritic patient by (a) FSE-Cube, (b) MENSA, (c) IDEAL-GRASS, (d) IDEAL-SPGR, (e) COSMIC, and (f) VIPR-bSSFP sequences.
Acknowledgments
Contract grant sponsor: National Institutes of Health; Contract grant numbers: 1R01-EB002524; 1R01-EB005790.
References
- 1.Lawrence RC, Felson DT, Helmick CG, et al. Estimates of the prevalence of arthritis and other rheumatic conditions in the United States. Part II. Arthritis Rheum. 2008;58(1):26–35. doi: 10.1002/art.23176. [DOI] [PMC free article] [PubMed] [Google Scholar]
- 2.Arden N, Nevitt MC. Osteoarthritis: epidemiology. Best Pract Res Clin Rheumatol. 2006;20(1):3–25. doi: 10.1016/j.berh.2005.09.007. [DOI] [PubMed] [Google Scholar]
- 3.Disler DG, Recht MP, McCauley TR. MR imaging of articular cartilage. Skeletal Radiol. 2000;29(7):367–377. doi: 10.1007/s002560000222. [DOI] [PubMed] [Google Scholar]
- 4.Peterfy CG, Gold G, Eckstein F, Cicuttini F, Dardzinski B, Stevens R. MRI protocols for whole-organ assessment of the knee in osteoarthritis. Osteoarthritis Cartilage. 2006;14 Suppl A:A95–A111. doi: 10.1016/j.joca.2006.02.029. [DOI] [PubMed] [Google Scholar]
- 5.Duc SR, Pfirrmann CW, Koch PP, Zanetti M, Hodler J. Internal knee derangement assessed with 3-minute three-dimensional isovoxel true FISP MR sequence: preliminary study. Radiology. 2008;246(2):526–535. doi: 10.1148/radiol.2462062092. [DOI] [PubMed] [Google Scholar]
- 6.Gold GE, Hargreaves BA, Vasanawala SS, et al. Articular cartilage of the knee: evaluation with fluctuating equilibrium MR imaging--initial experience in healthy volunteers. Radiology. 2006;238(2):712–718. doi: 10.1148/radiol.2381042183. [DOI] [PubMed] [Google Scholar]
- 7.Vasnawala SS, Pauly JM, Nishimura DG, Gold GE. MR imaging of knee cartilage with FEMR. Skeletal Radiol. 2002;31(10):574–580. doi: 10.1007/s00256-002-0562-4. [DOI] [PubMed] [Google Scholar]
- 8.Watanabe A, Boesch C, Obata T, Anderson SE. Effect of multislice acquisition on T1 and T2 measurements of articular cartilage at 3T. J Magn Reson Imaging. 2007;26(1):109–117. doi: 10.1002/jmri.20962. [DOI] [PubMed] [Google Scholar]
- 9.Disler DG, McCauley TR, Kelman CG, et al. Fat-suppressed three-dimensional spoiled gradient-echo MR imaging of hyaline cartilage defects in the knee: comparison with standard MR imaging and arthroscopy. AJR Am J Roentgenol. 1996;167(1):127–132. doi: 10.2214/ajr.167.1.8659356. [DOI] [PubMed] [Google Scholar]
- 10.Hardy PA, Recht MP, Piraino D, Thomasson D. Optimization of a dual echo in the steady state (DESS) free-precession sequence for imaging cartilage. J Magn Reson Imaging. 1996;6(2):329–335. doi: 10.1002/jmri.1880060212. [DOI] [PubMed] [Google Scholar]
- 11.Peterfy CG, Schneider E, Nevitt M. The osteoarthritis initiative: report on the design rationale for the magnetic resonance imaging protocol for the knee. Osteoarthritis Cartilage. 2008;16(12):1433–1441. doi: 10.1016/j.joca.2008.06.016. [DOI] [PMC free article] [PubMed] [Google Scholar]
- 12.Mosher TJ, Pruett SW. Magnetic resonance imaging of superficial cartilage lesions: role of contrast in lesion detection. J Magn Reson Imaging. 1999;10(2):178–182. doi: 10.1002/(sici)1522-2586(199908)10:2<178::aid-jmri11>3.0.co;2-w. [DOI] [PubMed] [Google Scholar]
- 13.Hargreaves BA, Gold GE, Beaulieu CF, Vasanawala SS, Nishimura DG, Pauly JM. Comparison of new sequences for high-resolution cartilage imaging. Magn Reson Med. 2003;49(4):700–709. doi: 10.1002/mrm.10424. [DOI] [PubMed] [Google Scholar]
- 14.Busse RF, Hariharan H, Vu A, Brittain JH. Fast spin echo sequences with very long echo trains: design of variable refocusing flip angle schedules and generation of clinical T2 contrast. Magn Reson Med. 2006;55(5):1030–1037. doi: 10.1002/mrm.20863. [DOI] [PubMed] [Google Scholar]
- 15.Kijowski R, Lu A, Block W, Grist T. Evaluation of the articular cartilage of the knee joint with vastly undersampled isotropic projection reconstruction steady-state free precession imaging. J Magn Reson Imaging. 2006;24(1):168–175. doi: 10.1002/jmri.20596. [DOI] [PubMed] [Google Scholar]
- 16.Yu H, Reeder SB, Shimakawa A, Brittain JH, Pelc NJ. Field map estimation with a region growing scheme for iterative 3-point water-fat decomposition. Magn Reson Med. 2005;54(4):1032–1039. doi: 10.1002/mrm.20654. [DOI] [PubMed] [Google Scholar]
- 17.Reeder SB, McKenzie CA, Pineda AR, et al. Water-fat separation with IDEAL gradient-echo imaging. J Magn Reson Imaging. 2007;25(3):644–652. doi: 10.1002/jmri.20831. [DOI] [PubMed] [Google Scholar]
- 18.Kijowski R, Passov L, Shimakawa A, Yu H, Reeder S. Unspoiled Gradient Recalled-Echo Acquired in the Steady-State (GRASS) with IDEAL fat-suppression for high resolution cartilage imaging at 3T. Proceedings of the 15th Annual Meeting of ISMRM; Berlin, Germany. 2007. (Abstract 3819). [Google Scholar]
- 19.Redpath TW, Jones RA. FADE--a new fast imaging sequence. Magn Reson Med. 1988;6(2):224–234. doi: 10.1002/mrm.1910060211. [DOI] [PubMed] [Google Scholar]
- 20.Huang TL, Ogino S, Bittersohl B, Vu AT, Lang PK, Yoshioka H. Quantitative and Qualitative Evaluation of Coherent Oscillatory State Acquisition for the Manipulation of Image Contrast (COSMIC) in Cervical Spine Myelographic Magnetic Resonance Imaging. Skeletal Radiol; Society of Skeletal Radiology 2008 Annual Meeting; La Quinta, CA, USA. 2008. p. 377. (Abstract 13). [Google Scholar]
- 21.Beatty PJ, Brau AC, Chang S, et al. A method for autocalibrating 2-D accelerated volumetric parallel imaging with clinically practical reconstruction times. Proceedings of the 15th Annual Meeting of ISMRM; Berlin, Germany. 2007. (Abstract 1749). [Google Scholar]
- 22.Reeder SB, Wintersperger BJ, Dietrich O, et al. Practical approaches to the evaluation of signal-to-noise ratio performance with parallel imaging: application with cardiac imaging and a 32-channel cardiac coil. Magn Reson Med. 2005;54(3):748–754. doi: 10.1002/mrm.20636. [DOI] [PubMed] [Google Scholar]
- 23.Gold GE, Busse RF, Beehler C, et al. Isotropic MRI of the knee with 3D fast spin-echo extended echo-train acquisition (XETA): initial experience. AJR Am J Roentgenol. 2007;188(5):1287–1293. doi: 10.2214/AJR.06.1208. [DOI] [PubMed] [Google Scholar]
- 24.Kijowski R, Davis KW, Woods MA, et al. Knee joint: comprehensive assessment with 3D isotropic resolution fast spin-echo MR imaging--diagnostic performance compared with that of conventional MR imaging at 3.0 T. Radiology. 2009;252(2):486–495. doi: 10.1148/radiol.2523090028. [DOI] [PMC free article] [PubMed] [Google Scholar]
- 25.Gold GE, Hargreaves BA, Reeder SB, et al. Balanced SSFP imaging of the musculoskeletal system. J Magn Reson Imaging. 2007;25(2):270–278. doi: 10.1002/jmri.20819. [DOI] [PubMed] [Google Scholar]
- 26.Ruehm S, Zanetti M, Romero J, Hodler J. MRI of patellar articular cartilage: evaluation of an optimized gradient echo sequence (3D-DESS) J Magn Reson Imaging. 1998;8(6):1246–1251. doi: 10.1002/jmri.1880080611. [DOI] [PubMed] [Google Scholar]
- 27.Pineda AR, Reeder SB, Wen Z, Pelc NJ. Cramer-Rao bounds for three-point decomposition of water and fat. Magn Reson Med. 2005;54(3):625–635. doi: 10.1002/mrm.20623. [DOI] [PubMed] [Google Scholar]
- 28.Eckstein F, Schnier M, Haubner M, et al. Accuracy of cartilage volume and thickness measurements with magnetic resonance imaging. Clin Orthop Relat Res. 1998;(352):137–148. [PubMed] [Google Scholar]
- 29.Cicuttini F, Forbes A, Asbeutah A, Morris K, Stuckey S. Comparison and reproducibility of fast and conventional spoiled gradient-echo magnetic resonance sequences in the determination of knee cartilage volume. J Orthop Res. 2000;18(4):580–584. doi: 10.1002/jor.1100180410. [DOI] [PubMed] [Google Scholar]
- 30.Cicuttini F, Forbes A, Morris K, Darling S, Bailey M, Stuckey S. Gender differences in knee cartilage volume as measured by magnetic resonance imaging. Osteoarthritis Cartilage. 1999;7(3):265–271. doi: 10.1053/joca.1998.0200. [DOI] [PubMed] [Google Scholar]
- 31.Eckstein F, Westhoff J, Sittek H, et al. In vivo reproducibility of three-dimensional cartilage volume and thickness measurements with MR imaging. AJR Am J Roentgenol. 1998;170(3):593–597. doi: 10.2214/ajr.170.3.9490936. [DOI] [PubMed] [Google Scholar]


