

Abstract
We study the problem of segmenting specific white matter structures of interest from Diffusion Tensor (DT-MR) images of the human brain. This is an important requirement in many Neuroimaging studies: for instance, to evaluate whether a brain structure exhibits group level differences as a function of disease in a set of images. Typically, interactive expert guided segmentation has been the method of choice for such applications, but this is tedious for large datasets common today. To address this problem, we endow an image segmentation algorithm with “advice” encoding some global characteristics of the region(s) we want to extract. This is accomplished by constructing (using expert-segmented images) an epitome of a specific region – as a histogram over a bag of ‘words’ (e.g., suitable feature descriptors). Now, given such a representation, the problem reduces to segmenting a new brain image with additional constraints that enforce consistency between the segmented foreground and the pre-specified histogram over features. We present combinatorial approximation algorithms to incorporate such domain specific constraints for Markov Random Field (MRF) segmentation. Making use of recent results on image co-segmentation, we derive effective solution strategies for our problem. We provide an analysis of solution quality, and present promising experimental evidence showing that many structures of interest in Neuroscience can be extracted reliably from 3-D brain image volumes using our algorithm.
1 Introduction
Diffusion Tensor Imaging (DTI or DT-MR) is an imaging modality that facilitates measurement of the diffusion of water molecules in tissues. DTI has turned out to be especially useful in Neuroimaging because the inherent microstructure and connectivity networks in the brain can be estimated from such data [1]. The primary motivation is to investigate how specific components (i.e., structures) of the brain network topology respond to disease and treatment [2], and how these are affected as a result of external factors such as trauma. An important challenge here is to reliably extract (i.e., segment) specific structures of interest from DT-MR image volumes, so that these regions can then be analyzed to evaluate variations between clinically disparate groups. This paper focuses on efficient algorithms for this application – that is, 3-D image segmentation with side constraints to preserve fidelity of the extracted foreground with a given epitome of the brain region of interest.
DTI data are represented as a 3 × 3 positive semidefinite tensor at each image voxel. These images provide information about connection pathways in the brain, and neuroscientists focus on the analysis of white-matter regions (these are known to encompass the ‘brain axonal networks’). In general, standard segmentation methods yield reasonable results in separating white matter (WM) from gray-matter (GM), see [3]. While some of these algorithms make use of the tensor field directly [4], others utilize ‘maps’ of certain scalar-valued anisotropy measures calculated from tensors to partition WM/GM regions [5], see Fig. 1. But different pathways play different functional roles; hence it is more meaningful to evaluate group differences in a population at the level of specific white matter structures (e.g., corpus callosum, fornix, cingulum bundle). Part of the reason is that even significant volume differences in small structures may be overwhelmed in a pair-wise t-test using volume measures of the entire white matter (obtained via WM/GM segmentation [6]). To analyze variations in specific regions, we require segmentation of such structures as a first step.
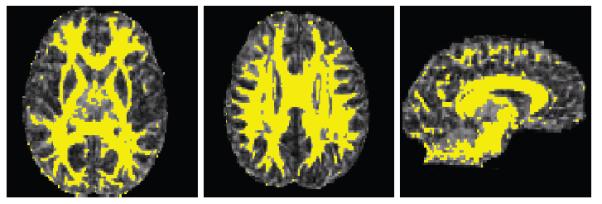
Figure 1.

Specific white matter structures such as Corpus Callosum, Interior Capsules, and Cingulum Bundle are shown in 3D (left), within the entire white matter (center), and overlaid on a Fractional Anisotropy (FA) image slice (right). Our objective is to segment such structures from DTI images. Note that FA is a scalar anisotropy measure often used directly for WM/GM segmentation, since anisotropy is higher in white matter.
Unsupervised segmentation of specific regions of interest from DTI is difficult. Even interactive segmentation (based on gray-level fractional anisotropy maps) leads to unsatisfactory results unless guided by a neuroanatomical expert – that is, specialized knowledge of the global appearance of the structure is essential in this process. Further, this is tedious for large datasets. One alternative is to use a set of already segmented images to facilitate processing of new data. Fortunately, since many studies use hand indicated regions for group analysis [7], such data is readily available. However, directly applying off the shelf toolboxes to learn a classifier (from such segmented images) does not work well. Part of the reason is that the local spatial context at each tensor voxel, while useful, is not sufficiently discriminative. In fact, the likelihood of a voxel to be assigned as part of the foreground (structure of interest) depends on whether the set of all foreground voxels (in entirety) match an ‘appearance model’ of the structure, in addition to being perceptually homogeneous. One strategy to model the first requirement is to extract features, generate a codebook dictionary of feature descriptors, and ask that distribution over the codebook (for foreground voxels) be consistent with the distribution induced by the expert-segmented foreground (on the same codebook). Putting this together with the homogeneity requirement serves to define the problem: segment a given DTI image (using MRFs, normalized cuts), while ensuring that the extracted foreground matches a known appearance model (over a bag of codebook features). The goal is related to recent work on simultaneous segmentation of two images called Cosegmentation [8, 9, 10, 11].
In the following sections, we formalize the problem and then present efficient segmentation methods. The key contributions of this paper are: (i) We propose a new algorithm for epitome-based graph-cuts segmentation, one which permits introduction of a bias to favor solutions that match a given epitome for regions of interest. (ii) We present an application to segmentation of specific structures in Diffusion Tensor Images of the human brain and provide experimental evidence that many structures of interest in Neuroscience can be extracted reliably from large 3-D DTI images. (iii) Our analysis provides a guarantee of a constant factor approximation ratio of 4. For a deterministic round-up strategy to obtain integral solutions, this approximation is provably tight.
2 Preliminaries
We provide a short overview of how image segmentation is expressed as finding the maximum likelihood solution to a Conditional or Markov Random Field function. Later, we extend the model to include an additional bias (or regularizer) so that the configurations that are consistent with an epitome of a structure of interest turn out to be more likely (than other possibly lower energy solutions).
2.1 Markov Random Fields (MRF)
Markov Random Field based image segmentation approaches are quite popular in computer vision [12, 13] and neuroimaging [14]. A random field is assumed over the image lattice consisting of discrete random variables, x = {x1, ⋯ , xn}. Each xj ∈ x, j ∈ {1, ⋯ , n} takes a value from a finite label set, ℒ = {ℒ1, ⋯ ,ℒm}. The set 𝒩j = {i|j ~ i} lists the neighbors of xj on the adjacency lattice, denoted as (j ~ i). A configuration of the MRF is an assignment of each xj to a label in ℒ. Labels represent distinct image segments; each configuration gives a segmentation, and the desired segmentation is the least energy MRF configuration. The energy is expressed as a sum of (1) individual data log-likelihood terms (cost of assigning xj to ℒk ∈ ℒ) and (2) pairwise smoothness prior (favor voxels with similar appearance to be assigned! to the same label) [12,15,16]:
| (1) |
| (2) |
| (3) |
where wjk is a unary term encoding the probability of j being assigned to ℒk ∈ ℒ, and cij is the pairwise smoothness prior (e.g., Generalized Potts model). The variable zij = 1 indicates that voxels i and j are assigned to different labels and x provides the assignment of voxel to labels (i.e., segments or regions). The problem is NP-hard but good approximation algorithms (including combinatorial methods) are known [16,15,17,12]. Special cases (e.g., when c is convex) are known to be poly-time solvable [15]. Next, we discuss an interesting extension of MRF segmentation, namely Cosegmentation, which deals with the simultaneous segmentation of multiple images.
2.2 From Cosegmentation toward Epitome-based MRFs
Cosegmentation uses the observation that while global histograms of images of the same object (in different backgrounds) may differ, the histogram(s) of the respective foreground regions in the image pair (based on certain invariant features) remain relatively stable. Therefore, one may perform a concurrent segmentation of the images with a global constraint that enforces consistency between histograms of only the foreground voxels. We first construct a codebook of features ℱ (e.g., using RGB intensities) for images ℐ(1) and ℐ(2); the histograms on this dictionary are:
such that if voxel j ∈ ℐ(u) is most similar to codeword ℱb, where u ∈ {1, 2}. If x(1) and x(2)) denote the segmentation solutions, and assigns voxel j of ℐ(1) to the foreground, a measure of consistency between the foreground regions (after segmentation) is given by:
| (4) |
where Ψ (·, ·) is a suitable similarity (or distance) function and , a count of the number of voxels in ℐ(u) (from ℱb) assigned to the foreground for u ∈ {1,2}. Using (4) to regularize the segmentation objective (1) biases the model to favor solutions where the foregrounds match (w.r.t. the codebook ℱ), leading to more consistent segmentations.
The form of Ψ(·, ·) above has a significant impact on the hardness of the problem, and different ideas have been explored [8, 9, 10]. For example, the approach in [8] uses the l1 norm to measure (and penalize) the variation, and requires a Trust Region based method for optimization. The sum of squared differences (SSD) function in [9] leads to partially optimal (half integral) solutions but requires solving a large linear program – infeasible for the image sizes we consider (which are orders of magnitude larger). Recently, [10] substituted Ψ(·, ·) with a so-called reward on histogram similarity. This does lead to a polynomial time solvable model, but requires the similarity function to be quite discriminative (otherwise offering a reward might be counter-productive in this setting).
3 Optimization Model
We start by using the sum of squared differences (SSD) as in [9] to bias the objective function and incorporate epitome awareness within the MRF energy in (1). However, unlike [9], where one seeks a segmentation of both images, here we are provided the second histogram – the epitome (representation) of the specific region of interest. Clearly, this significantly simplifies the resultant Linear Program. Unfortunately, it remains computationally intractable for high resolution 3-D image volumes (2562 × 128) we consider here (the images are much larger than what is solvable by state of the art LP software, as in [9]). We propose a solution based on a combinatorial method, using ideas from some recent papers on Quadratic Pseudoboolean functions and their applications [18,19]. This allows us to apply our technique on large scale image volumes, and obtain accurate results quite efficiently. Further, our analysis shows that we can obtain good constant-factor approximations (these are tight under mild conditions). We discuss our formulation next.
We first express the objective in (1) with an additional regularization term to penalize histogram dissimilarity using the sum of squared differences. This gives the following simple expression,
Since the epitome (histogram) is provided, the second argument of Ψ(·, ·) in (4) is replaced with ℋ̂ and x(1) represents the solution vector for image ℐ(1). In addition, the term wj0 (and wj1) denote the unary cost of assigning voxel j to the background (and foreground), and λ is a user-specified tunable parameter to control the influence of the histogram variation. This yields
| (5) |
The last term in (5) is constant. So, the model reduces to
| (6) |
Observe that (6) can be expressed as a special case of the general form, λ(x1, ⋯ xn) = ∑S⊂U ϕS ∏j∈S xj where U = {1, ⋯ , n}, x = (x1, ⋯ , xn) ∈ ℬn is a binary vector, S is a subset of U, and ϕS denotes the coefficient of S. Such a function Γ : ℬn → ℛ is called a pseudo-Boolean function [18]. If the cardinality of S is no more than two, the corresponding form is
These functions are called Quadratic Pseudo-Boolean functions (QPB). In general if the objective permits a representation as a QPB, an upper (or lower) bound can be derived using roof (or floor) duality [18], recently utilized in several papers [19, 20, 21]. Notice that the function in (6) is a QPB because it has at most two variables in each term in the expansion. An advantage of the model derived above is that (pending some additional adjustments) we will be able to leverage an extensive existing combinatorial machinery to solve the problem. We discuss these issues in more detail next.
4 Reparameterization and Graph Construction
Now we discuss a graph construction to optimize the above energy function by computing a maximum flow/minimum cut. We represent each variable as a pair of literals, xj and x̄j, which corresponds to a pair of nodes in a graph 𝒢. Edges are added to 𝒢 based on various terms in the corresponding QPB. The min-cut computed on 𝒢 will determine the assignments of variables to 1 (or 0), i.e., foreground/background assignment. Depending on how the nodes for a pair of literals are partitioned, we either get “persistent” integral solutions (same as in optimal) and/or obtain variables assigned (half integral) values and need additional rounding to obtain a {0,1} solution.
We will first reparameterize the coefficients in our objective as a vector denoted by Φ. More specifically, we express the energy by collecting the unary and pairwise costs in (6) as the coefficients of the linear and quadratic variables. For a voxel j, we denote the unary coefficient as Φj and for a pair of voxels (i ,j) we give their corresponding coefficients as Φij. For presentation, we show spatial adjacency as i ~ j, and if i and j share a bin in the histogram we denote it as i ≅ j, i.e., ∃b : ℋb(i) = ℋb(j) = 1. The definition of the pairwise costs will include the following scenarios:
| (7) |
The above cases enumerate three possible relationships between a pair of voxels (i, j): (i) (i, j) are spatial neighbors but not bin neighbors; (ii) (i, j) are bin neighbors, but not spatial neighbors; (iii) (i, j) are bin neighbors and spatial neighbors. In addition, the cost is also a function of label assignments to (i, j). Note that we assume i ≠ j above since if i = j, we can absorb those costs in the unary terms (because xi · xi = xi). We define the unary costs for each voxel j next.
| (8) |
With the reparameterization given as Φ = [Φj Φij]T done, we follow the recipe in [18, 22] to construct a graph (briefly summarized below). For each voxel j ∈ ℐ, we introduce two nodes, vj and v̄j. Hence, the size of the graph is 2|ℐ|. We also have two special nodes s and t which denote the source and sink respectively. We connect each node to the source and/or the sink based on the unary costs, assuming that the source (and sink) partitions correspond to foreground (and background). The source is connected to the node vj with weight, , and to node v̄j with weight . Nodes vj and v̄j are in turn connected to the sink with costs and respectively. These edges, if saturated in a max-flow, count towards the node's unary cost. Edges between node pairs (except source and sink) give pairwise terms of the energy. These edge weights (see Table1) quantify all possible relationships of pairwise voxels and label assignments (Fig. 2). A maximum flow/minimum cut procedure on this graph gives a solution to our problem. After the cut, each node (for a voxel) is connected either to the source set or to the sink set. Using this membership, we can obtain a final solution (i.e., labeling) as follows.
| (9) |
Table 1.
Illustration of edge weights introduced in the graph for voxel pairs
| Voxel pairs (i, j) | i ~ j, i ≇ j | i ≁ j, i ≅ j | i ~ j, i ≅ j |
|---|---|---|---|
| (vi → vj), (v̄j → v̄i) | 0 | ||
| (vj → vi), (v̄i → v̄j) | 0 | ||
| (v̄j → vi), (v̄i → vj) | 0 |
Figure 2.

A graph to optimize (6). Nodes in the left box represents vj; nodes in the right box represent v̄j. Colors indicate spatial neighbors (orange) or bin neighbors (green).
A property of the solution obtained by (9) is that the variables assigned {0,1} values are “persistent“, i.e., they are the same in the optimal integral solution to (6). This means that the solution from the algorithm above is partially optimal [18, 20]. We now only need to find an assignment for the variables (to 0 or 1) by rounding. The rounding strategy and analysis is presented next.
5 Rounding and Approximation analysis
In general, any reasonable heuristic can be used to round -valued variables to 0 or 1 (e.g., we can solve for and obtain a segmentation for only the -valued variables without the additional bias). Our experiments later make use of such a heuristic. The approximation analysis below, however, is based on a more conservative scheme of rounding all -valued variables up to 1. We only summarize our main results here, the longer version of the paper includes details.
A 2-approximation for the objective function (without the epitome bias) is known [16, 12]. The rounding above gives a constant factor approximation.
Theorem 1 The rounding strategy described above gives a feasible solution to Problem (6). This solution is a factor 4 approximation to (6). Further, the approximation ratio is tight for this rounding.
6 Experimental Results
Overview
We now empirically evaluate our algorithm for extracting specific structures of interest from DTI data, focusing on (1) Corpus Callosum (CC), and (2) Interior Capsule (IC) as representative examples. Our experiments were designed to answer the following main questions: (i) Can the model reliably and accurately identify the structures of interest? Note that general-purpose white matter segmentation methods do not extract specific regions (which is often obtained via intensive interactive methods instead). Solutions from our algorithm, if satisfactory, can be used directly for analysis or as a warm-start for user-guided segmentations for additional refinement, (ii) Does segmentation with a bias for fidelity with epitomes offer advantages over training a classifier on the same features? Clearly, the latter scheme will work nicely if the similarity between foreground/background voxels is sufficiently discriminative. Our experiments provide evidence that epitomes indeed offer advantages, (iii) Finally, we evaluate the advantages of our method in terms of relative effort expended by a user performing interactive extraction of CC and IC from 3-D volumes.
Data and Setup
We acquired 25 Diffusion Tensor brain images in 12 non-collinear diffusion encoding directions (and one b = 0 reference image) with diffusion weighting factor of b = 1000s/mm2. Standard image processing included correcting for eddy current related distortion, distortion from field inhomogeneities (using field maps), and head motion. From this data, the tensor elements were estimated using standard toolboxes (Camino [23]). The images were then hand-segmented (slice by slice) by experts to serve as the gold standard segmentation. Within a leave one out cross validation scheme, we split our set into training (24 images) and test set (hold out image). Epitomes were constructed using training data (by averaging tensor volumes and generating feature codeword dictionaries), and then specific structures in the hold out image were segmented using our model. Codewords used for the epitome also served to train a SVM classifier (on training data), which was then used to label voxels as foreground (part of structure of interest) or background, in the hold-out image. We present the mean of segmentation accuracy over 25 realizations.
WM/GM DTI segmentation
To briefly elaborate on (i) above, we note that most existing DTI segmentation algorithms in the literature [24] focus on segmenting the entire white-matter (WM) from gray-matter (GM) where as the focus here is to extract specific structure within the WM pathways, to facilitate the type of analysis being pursued in neuroscience studies [25, 2]. Fig. 3 shows results of a DTI image WM segmentation. Such methods segment WM well but are not designed to identify different components within the WM. Certain recent works [26] have reported success in identifying structures such as the cingulum bundle if a good population specific atlas is available (here, one initializes the segmentation by a sophisticated registration procedure).
Figure 3.
WM/GM segmentation (without epitomes) from standard toolkits, overlaid on FA maps (axial, sagittal views shown).
Dictionary Generation
A suitable codebook of features (i.e., ℱ from §2.2) is essential to modulate the segmentation (with an uninformative histogram, the process degenerates to a ordinary segmentation without epitomes). Results from our preliminary experiments suggested that the codeword generation must be informed by the properties/characteristics of Diffusion Tensor images. While general purpose feature extractors or interest-point detectors from Vision cannot be directly applied to tensor data, our simple scheme below is derived from these ideas. Briefly, by first setting up a neighborhood region around each voxel, we evaluate the local orientation context and shape information from the principal eigen vectors and eigen values of tensors at each neighboring voxel. Similar to Histogram of Oriented Gradients or SIFT, each neighboring voxel casts a vote for the primary eigen vector orientation (weighted by its eigen value), which encodes the distribution of tensor orientations in a local neighborhood around the voxel, as a feature vector. These feature vectors are then clustered, and each voxel is ‘assigned’ to its closest codeword/feature to give ℋ(u). Certain adjustments are needed for structurally sparse regions close to periphery of the brain surface, where we use all primary eigen vectors in a (larger) neighborhood window. This dictionary generation is not rotationally invariant since the orientation of the eigen-vectors are used. Our literature review suggests that there is no 'accepted' strategy for feature extraction from tensor-valued images. While the problem is interesting, the procedure here yields reasonable results for our purpose. We acknowledge that improvements may be possible using more sophisticated approaches.
Implementation Details
Our implementation in C++ was interfaced with a QPB solver [22,18]. We used a distance measure proposed in DTI-TK [23] which is popular in the neuroimaging literature, to obtain a similarity measure between tensors. The unary terms for the MRF component were calculated as the least DTI-TK metric distance between the voxel and a set of labels (generated by sampling from foreground in the training data). Pairwise smoothness terms were calculated using a spatial neighborhood of 18 neighbors. The parameter λ was set to 10 for all runs.
6.1 Results: User guided interactive segmentation, Segmentation with Epitomes and SVMs
User study for interactive segmentation
To assess the amount of effort expended in obtaining a good segmentation of the regions of interest in an interactive manner, we set up a user study with two users who were familiar with (but not experts in) neuroanatomy. The users were presented with the ground truth solution for each image. The user provided “scribbles“ denoting foreground/background regions, which were incorporated into the segmentation via must-link/cannot-link constraints. Ignoring the time required for segmentation, typically 20-40 seeds were needed for each 2-D slice/image to obtain results close to ground-truth segmentations, which required ~ 60s of user participation per 3-4 slices. Representative results are presented in Figs. 4-5 (column 5).
Figure 4.

A segmentation of the Corpus Callosum overlaid on FA maps. Rows refer to axial and sagittal views. Columns: (1) Tensors. (2) Ground truth. (3) Our solutions. (4) SVM results. (5) User-guided segmentation.
Figure 5.

A segmentation of the Interior Capsules overlaid on FA maps. Rows correspond to axial views. Columns: (1) Tensors. (2) Ground truth. (3) Our Solutions. (4) SVM results. (5) User-guided segmentation.
Results from SVM and our model
For comparison, we trained a SVM classifier on the same set of voxel-codewords used for the epitomes. For training, feature vectors for foreground/background voxels from the training images were used, and the learnt function was used to classify voxels in the hold-out image. Representative results are presented in Figs. 4-5, overlaid on 2-D slices of Fractional Anisotropy. We see good consistency between our solutions and the ground truth in Figs. 4-5 where as the SVM results seem to oversegment, undersegment or pick up erroneous regions with similar contextual appearance to some voxels in the epitome. It is true that such a classification experiment with better (more discriminative) features will likely perform better; however, it is not clear how to reliably extract good quality features from tensor valued images. The results also suggest that our model exploits the epitome of such features rather well within a segmentation criterion.
Quantitative Summary
For quantitative evaluations, we computed the Dice Similarity coefficient between the segmentation solutions 𝒜 and the expert segmentation ℬ, given as . On CC and IC, the similarity coefficient of our solutions were 0.62 ± 0.04 and 0.57 ± 0.05 respectively. The corresponding values for the SVM segmentation were 0.28 ± 0.06 and 0.15 ± 0.02 respectively. Hence, the null hypothesis using a two sample t-test can be rejected at α = 0.01 (significance level). The running time of our algorithm was comparable to the running times of SVM using Shogun (a subset of voxels were used for training). It took ~ 2 mins for our algorithm to solve the network flow on the graph, and < 4 mins to read in the images and construct the graph. While the segmentation results from the user-guided interactive segmentation are marginally better than ours, the user study above indicates that a significant level of interaction is required, which is already difficult for large 3-D volumes and becomes impractical for neuroimaging studies with tens of image volumes.
7 Discussion and Conclusions
We present a new combinatorial algorithm for segmenting specific structures from DTI images. Our goal is to segment the structure while maintaining consistency with an epitome of the structure, generated from expert segmented images (note that this is different from top-down segmentation approaches [27], and algorithms which use a parametric prior [28, 11]). We see that direct application of max-margin methods does not yield satisfactory results, and inclusion of a segmentation-specific objective function seems essential. Our derived model can be optimized using a network flow procedure. We also prove a 4 factor approximation ratio, which is tight for the proposed rounding mechanism. We present experimental evaluations on a number of large scale image volumes which shows that the approach works well, and is also computationally efficient (2-3 mins). Empirical improvements seem possible by designing better methods of feature extraction from tensor-valued images. The model may serve to incorporate epitomes for general segmentation problems on other images as well. In summary, our approach shows that many structures of interest in neuroimaging can be accurately extracted from DTI data.
Footnotes
Supported by AG034315 (Singh), MH62015 (Alexander), UW ICTR (1UL1RR025011), and UW ADRC (AG033514). Hinrichs and Adluru are supported by UW-CIBM funding (via NLM 5T15LM007359). Thanks to Richie Davidson for assistance with the data, and Anne Bartosic and Chad Ennis for ground truth indications. The authors thank Lopamudra Mukherjee, Moo K. Chung, and Chuck Dyer for discussions and suggestions.
References
- 1.Burns J, Job D, Bastin ME, et al. Structural disconnectivity in schizophrenia: a diffusion tensor magnetic resonance imaging study. The British J. of Psychiatry. 2003;182(5):439–443. [PubMed] [Google Scholar]
- 2.Pfefferbaum A, Sullivan E. Microstructural but not macrostructural disruption of white matter in women with chronic alcoholism. Neuroimage. 2002;15(3):708–718. doi: 10.1006/nimg.2001.1018. [DOI] [PubMed] [Google Scholar]
- 3.Liu T, Li H, Wong K, et al. Brain tissue segmentation based on DTI data. Neuroimage. 2007;38:114–123. doi: 10.1016/j.neuroimage.2007.07.002. [DOI] [PMC free article] [PubMed] [Google Scholar]
- 4.Wang Z, Vemuri B. DTI segmentation using an information theoretic tensor dissimilarity measure. Trans. on Med. Imaging. 2005;24:1267–1277. doi: 10.1109/TMI.2005.854516. [DOI] [PubMed] [Google Scholar]
- 5.Yushkevich PA, Zhang H, Simon TJ, Gee JC. Structure-specific statistical mapping of white matter tracts using the continuous medial representation. Proc. of MMBIA. 2007 doi: 10.1016/j.neuroimage.2008.01.013. [DOI] [PMC free article] [PubMed] [Google Scholar]
- 6.Lawes N, Barrick T, Murugam V, et al. Atlas based segmentation of white matter tracts of the human brain using diffusion tensor tractography and comparison with classical dissection. Neuroimage. 2008;39:62–79. doi: 10.1016/j.neuroimage.2007.06.041. [DOI] [PubMed] [Google Scholar]
- 7.Goodlett CB, Fletcher TP, Gilmore JH, Gerig G. Group analysis of DTI fiber tract statistics with application to neurodevelopment. Neuroimage. 2009;45(1):S133–S142. doi: 10.1016/j.neuroimage.2008.10.060. [DOI] [PMC free article] [PubMed] [Google Scholar]
- 8.Rother C, Minka T, Blake A, Kolmogorov V. Cosegmentation of image pairs by histogram matching: Incorporating a global constraint into MRFs. Comp. Vision and Pattern Recog. 2006 [Google Scholar]
- 9.Mukherjee L, Singh V, Dyer C. Half-integrality based algorithms for cosegmentation of images. Comp. Vision and Pattern Recog. 2009 [PMC free article] [PubMed] [Google Scholar]
- 10.Hochbaum D, Singh V. An efficient algorithm for co-segmentation. Intl. Conf. on Comp. Vis. 2009 [Google Scholar]
- 11.Batra D, Kowdle A, Parikh D, et al. icoseg: Interactive co-segmentation with intelligent scribble guidance. Comp. Vision and Patter Recog. 2010 [Google Scholar]
- 12.Boykov Y, Veksler O, Zabih R. Fast approximate energy minimization via graph cuts. Trans. on Pattern Anal. and Machine Intel. 2001;23(11):1222–1239. [Google Scholar]
- 13.Kolmogorov V, Boykov Y, Rother C. Applications of parametric maxflow in Computer Vision. Intl. Conf. on Comp. Vision. 2007 [Google Scholar]
- 14.Weldeselassie YT, Hamarneh G. DT -MRI segmentation using graph cuts. Medical Imaging: Image Processing, volume 6512 of Proc. SPIE. 2007 [Google Scholar]
- 15.Hochbaum D. An efficient algorithm for image segmentation, markov random fields and related problems. J. of the ACM. 2001;48(4):686–701. [Google Scholar]
- 16.Kleinberg J, Tardos E. Approximation algorithms for classification problems with pairwise relationships: Metric partitioning and markov random fields. J. of the ACM. 2002;49(5):616–639. [Google Scholar]
- 17.Ishikawa H. Exact optimization for markov random fields with convex priors. Trans. on Pattern Anal. and Machine Intel. 2003;25(10):1333–1336. [Google Scholar]
- 18.Boros E, Hammer P. Pseudo-Boolean optimization. Disc. Appl. Math. 2002;123:155–225. [Google Scholar]
- 19.Rother C, Kolmogorov V, Lempitsky V, Szummer M. Optimizing binary mrfs via extended roof duality. Comp. Vision and Pattern Recog. 2007 [Google Scholar]
- 20.Kohli P, Shekhovtsov A, Rother C, Kolmogorov V, et al. On partial optimality in multi-label MRFs. Intl. Conf. on Machine learning. 2008 [Google Scholar]
- 21.Raj A, Singh G, Zabih R. MRFs for MRIs: Bayesian reconstruction of MR images via graph cuts. Comp. Vision and Pattern Recog. 2006 [Google Scholar]
- 22.Kolmogorov V, Rother C. Minimizing nonsubmodular functions with graph cuts-a review. Trans. on Pattern Anal. and Machine Intel. 2007;29(7):1274. doi: 10.1109/TPAMI.2007.1031. [DOI] [PubMed] [Google Scholar]
- 23.Zhang H, Yushkevich PA, Alexander DC, Gee JC. Deformable registration of diffusion tensor MR images with explicit orientation optimization. Medical Image Analysis. 2006;10:764–785. doi: 10.1016/j.media.2006.06.004. [DOI] [PubMed] [Google Scholar]
- 24.Rousson M, Lenglet C, Deriche R. Level set and region based surface propagation for diffusion tensor MRI segmentation. Proc. of CVAMIA-MMBIA, volume 3117 of LNCS. 2004:123–134. [Google Scholar]
- 25.Smith SM, Jenkinson M, Johansen-Berg H, et al. Tract-based spatial statistics: Voxelwise analysis of multi-subject diffusion data. 2006;31:1487–1505. doi: 10.1016/j.neuroimage.2006.02.024. [DOI] [PubMed] [Google Scholar]
- 26.Awate S, Zhang H, Gee J. A fuzzy, nonparametric segmentation framework for DTI and MRI analysis with applications to DTI tract extraction. Trans. on Med. Imaging. 2007;26(11):1525–1536. doi: 10.1109/TMI.2007.907301. [DOI] [PubMed] [Google Scholar]
- 27.Borenstein E, Sharon E, Ullman S. Combining top-down and bottom-up segmentation. Comp. Vision and Pattern Recognition Workshop. 2004 [Google Scholar]
- 28.Jingyu C, Qiong Y, Fang W, et al. Transductive object cutout. Comp. Vision and Pattern Recog. 2008 [Google Scholar]