Abstract
A four-parameter equation, the lagged normal density curve, has been used to describe: (1) arterial indicator dilution curves recorded from normal men and (2) the transfer function between sampling sites at the femoral and dorsalis pedis arteries of these men. Analog computer methods for the generation of this model and for an iterative method of calculating the convolution integral using any input function or transfer function are described.
The dispersion of indicator in flowing liquids has been observed to occur in a more or less random fashion; there is, for the indicator, some frequency distribution of tranversal times about the mean time of traversal between any two points. In oil pipe lines1 and in aqueous solutions in tubes of various sizes2 the frequency distributions were found to be distinctly different from what would be expected for laminar flow. In general they were very similar to normal density functions (Gaussian distribution). Sheppard3 used a one-dimensional random walk equation to describe the dispersion of indicator in artificial systems but found that this model did not predict the dispersion that occurs in the circulation.
The mathematical model presented here describes circulatory dispersion as two probability processes: 1) a random distribution of transit times about some average value (tc); and 2) a single washout process with a time constant, τ. This is expressed as:
| (1) |
where C(t) is the concentration of the indicator at time t and σ is the standard deviation of the randomizing process. The boundary condition is C(0) = 0. mi = amount of indicator injected (mg.); Q = flow (liter/sec); therefor, mi/Q is the area of the curve.
The randomizing process might be considered to represent the effects of turbulence and of the pulsations in flow velocity which may range from forward velocities of approximately 10 to 60 cm. per second during each cardiac cycle in the aorta. The exponential process can represent washout from a ventricular mixing chamber and, perhaps, similar phenomena in eddies at branches in the arterial tree.
There are two approaches that can be used to test the applicabiliy of the model. In the first approach, it is assumed that the injection of indicator is instantaneous, that the indicator labels a thin cross-section of the stream at the site of injection, and that the distortion caused by the sampling system can be ignored. With this approach, the parameters of the model are successively modified until an optimal match is obtained between the recorded curve and the model solution. This approach is more meaningful if the recorder curve is first corrected for distortion due to the sampling system. Recording indicator dilution curves, via identical sampling systems at the input and output of the segment under study, is the best approach. It is then possible to determine the dispersion process which distorts the upstream curve to the form of the downstream curve.
Methods
Indicator dilution curves were recorded simultaneously from the femoral and dorsalis pedis arteries after injection of indocyanine green into the superior vena cava or thoracic aorta of normal men14. Analog magnetic-tapea recordings were made of the output of the two densitometersb through which blood was drawn at a constant rate of 10 ml. per minute from each of the arterial sampling sites.
Mathematical Analog to Individual Indicator Dilution Curves
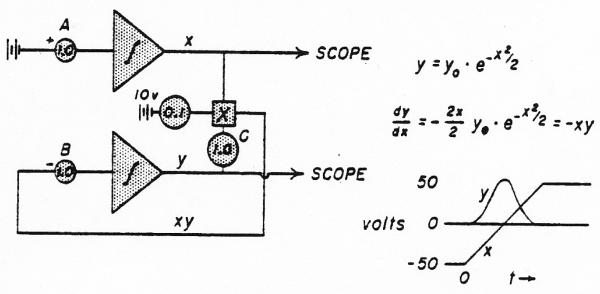
The analog computer solution for the normal density curve is given in Fig. 1. The standard deviation, σ, of the Gaussian distribution is 0.165 times the duration of ramp x as it rises from −50 to +50 volts. This is adjusted by potentiometer A. The amplitude of the curve was adjusted by changing the gain through potentiometers B or C. For the sake of simplicity, the normalizing factor, , was not used in the denominator of the equation. The mean time, tc, of the Gaussian distribution occurs when x = 0 (midpoint of the ramp).
Fig. 1.
Analog computer solution for a normal density curve. The stippled triangle with its contained integral sign represents an operational amplifier set up to perform integration. The beginning of the integration is triggered by a controlling relay circuit.
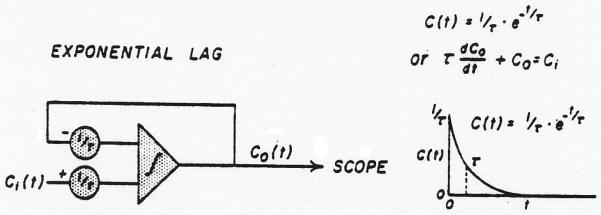
The washout process is superimposed on the random process by using the normal density curve (y) as input (Ci) to a single lag network (Fig. 2). This process does not change the area under the curve but lowers the peak and prolongs the tail giving the skewed curve of Eq. 1.
Fig. 2.
Analog computer solution for an exponential lag. The time constant, t, is adjusted in both potentiometers simultaneously to preserve unit gain through the system. When y of figure 1 is used as Ci(t), then Co(t) is a lagged normal density curve. The curve is drawn for the solution when Ci(t) = 1/τ for t < O and Ci(t) = O for t > O.
The matching of the model with the recorded curves was executed by the following means. Each indicator dilution curve was rerecorded onto a loop of magnetic tape 6 to 8 feet long. A 1-volt pulse was recorded on another channel to precede the appearance time on the dye curve by a few seconds. With each passage of the tape, the pulse, amplified 20 times, triggered a relay which initiated a ramp (with a variable slope) in a sawtooth generator.* When the ramp voltage exceeded a selected value, a pulse, initiated from a pulse generator*, triggered the relays† which started the sweep of the oscilloscope† and the computation and generation of the lagged normal density curve by the network of operational amplifiers† and multiplier†. The slope of the ramp was adjusted so that the computed and theoretical curves and the recorded curve were displayed simultaneously on the oscilloscope. By running the tape at 60 inches per second and performing the solution of the equation at high integrating rates, the recorded and theoretical curves could be displayed and compared as often as once every second while adjusting the parameters of the solution. When a good match was obtained, the theoretical and actual curves were recorded‡ together.
Analog to the Dispersing Function of the Arterial Segment Between the Two Sampling Sites
Equation 1 describes the frequency distribution of transit times, h(t), in the bloodsteam between the femoral artery at the inguinal ligament and the dorsalis pedis artery on the dorsum of the foot. In doing so, it was assumed that Duhamel's principle of superposition applies: that the distribution, h(t), is via a system that can be described by a system of linear differential equations. There is doubt about this point4, which is reasonable in view of the many complexities of a branched elastic arterial tree with pulsatile flow. However, if the dispersing process or transfer function, h(t), were found to be unchanged for differently shaped curves of indicator dilution through the segment when the physiologic situation was not changing, this would be evidence that, in at least an approximate fashion, the system is linear.
The dispersing function was determined by fitting the model to the experimental data. Following injection of dye into the superior vena cava or thoracic aorta, indicator dilution curves were recorded from the femoral and dorsalis pedis arteries, via identical sampling systems. When the sampling systems are identical, the dispersing process that acts on the undistorted femoral arterial dye curve (as it existed at the tip of the sampling catheter) to produce the undistorted dorsalis pedis arterial curve is exactly the same process as that acting on the recorded femoral curve to produce the recorded dorsalis pedis curve. The input to the arterial segment (the dilution curve recorded at the femoral artery) was distorted by convolution with a dispersing function using a lagged normal density curve with arbitrary trial parameters; the resultant theoretical output curve was compared to the actual recorded output from the segment (the curve recorded at the dorsalis pedis artery). The parameters of the trial function were then adjusted and the convolution repeated until the theoretical and actual output curves were very similar. The trial equation was then taken to represent the dispersing function of the segment.
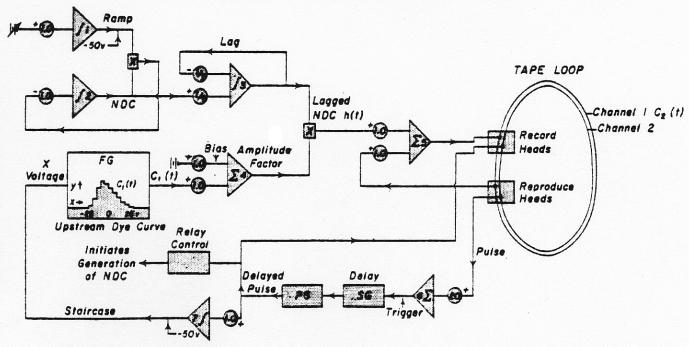
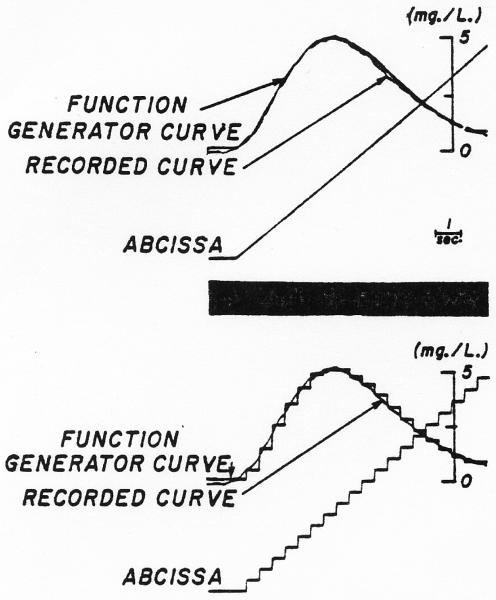
The analog computer method (Fig. 3) used was an iterative procedure utilizing a tape loop as a memory unit. The curve from the femoral artery was copied from the magnetic tape into a function generator* where it was approximated by 10 straight-line segments of variable slope and length and the angles smoothed into curves (Fig. 4, upper panel); a ramp from −50 to 50 volts was used as the abscissa. After completion of the approximation, the ramp could be replaced by a staircase (Fig. 4, lower panel) in order to break the input curve into segments (either twenty 5-volt steps or fifty 2-volt steps were used). The trial dispersing function, the lagged normal density curve h(tf), was generated repeatedly as before (operational amplifiers 1, 2, and 3 or figure 3). A 1-volt pulse was recorded on channel 2 of the tape loop before beginning the convolution. With the loop running continuously, the pulse was used (through operational amplifier 6) to trigger a delay unit (a ramp†) which in turn generated a new pulse which was later than the initial pulse by exactly the duration of the interval between steps in the function generator (usually equivalent to 0.25 second, real time). The new pulse increased (through operational amplifier 7) the x-axis voltage of the function generator by one step and the pulse was rerecorded on channel 2. The y-axis voltage of the function generator at that step (biased by operational amplifier 4 to set zero concentration to zero voltage) provided the amplitude factor for the dispersing process. The voltage on tape channel 1 (zero prior to the first pass) was added to the lagged normal density curve and rerecorded on channel 1.
Fig. 3.
Analog computer schema for the calculation of the convolution integral. Integrating amplifiers are labelled with an integration symbol, summing amplifiers with a capital sigma. Each h(t-iΔt) is multiplied by an amplitude factor (ampl. 4) representing the average concentration of the input (femoral) curve during the time interval, ti - Δt to ti. The sum of the series of delayed and amplified h(t)'s was recorded as C2(t) on tape channel 1. The parameters σ and τ of h(t) were readjusted and the series repeated until C2(t) approximated the curve recorded from the dorsalis pedis artery. See text.
Fig. 4.
Simulation of a dye dilution curve in the function generator. Upper panel: With a ramp as the x-axis voltage, the dye curve was approximated by 10 straight lines and the junctions smoothed. Lower panel: With the same settings of the function generator as determined for the upper panel, the ramp was replaced by the staircase illustrated so that the histogram approximated the dye curve.
In Fig. 4, the y-axis voltage of the function generator was zero for the first five steps (of 20) along the x axis and therefore it would not be until the sixth cycle of the loop that a curve would be recorded on channel 1. Thereafter, with each cycle of the loop, a normal density curve, delayed a constant unit of time behind the previous one and appropriately multiplied by the amplitude of the indicator concentration at that time (y value in function generator), was added to the sum of the curves building up on channel 1. The process may be described mathematically by:
| (2) |
where C2(t) is the output curve, i = the step number, n = the total number of steps, C1(i) is the input curve approximated by the histogram in the function generator, Δt is the duration of the steps of the histogram, and h(t–iΔt) is the lagged normal density curve appropriately delayed and is a continuous function. The result, C2(t), was compared with the actual curve recorded from the dorsalis pedis artery.
Testing the Use of a Magnetic Tape Loop as a Memory Unit
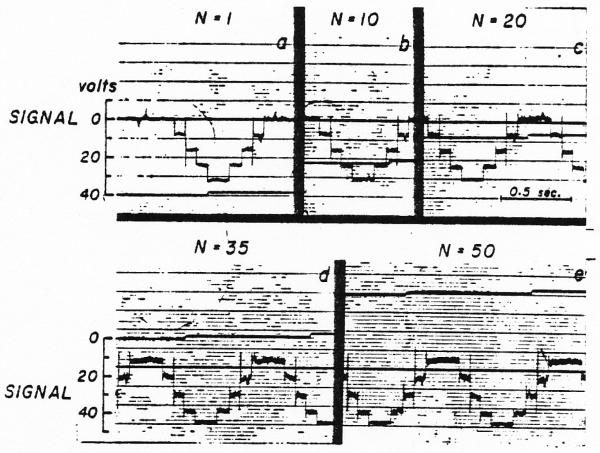
In performing the convolution, the data recorded on tape channel 1 must pass through the record and reproduce amplifiers of the magnetic tape system and through operational amplifier 5 (Fig. 3) with each cycle of the loop. Since this occurs 20 to 50 times, it is necessary that there be a gain of exactly 1.0 through these three amplifiers and that there be no bias voltage added (or subtracted) each time. In order to test the system, an arbitrarily chosen wave form was recorded on channel 1 and then, with the upper input to amplifier 5 removed, the iterative procedure was performed on this wave form. If the system were noise free and had a gain of 1.0, then the wave form would be unchanged through many cycles of the loop. The results of such a test are shown in Fig. 5 for a series of steps through 50 cycles. The first pass showed a significant amount of noise and this increased gradually throughout the test. Although the voltage difference between the base line and the top step remained nearly constant (the increase in gain was [34/32 − 1]/50 = 0.12 per cent per pass), there was a shift in the base line due to an undesired constant voltage being added repeatedly. Typically, these tests indicate either a slight change of gain or the introduction of a small bias voltage. In the test illustrated, this bias voltage raised the base line by 4 volts in 50 passes, a bias of about 80 millivolts superimposed on the 32-volt signal.
Fig. 5.
Test of the tape loop summation method. a. Curve recorded on the tape loop after one passage from the tape through the reproduce amplifier of the tape system, the summing amplifier (ampl. 5 of Fig. 3), and the record amplifier of the tape, b, c, d, and e. Records of the same curve after 10, 20, 35 and 50 passes through the same amplifiers. The noise is markedly increased but the gain in amplitude is slight (increased from 32 to 34 volt). The persistence of the sharp spikes attests to the high-frequency response of the system.
During the convolution of some dye curves, a square wave was also recorded on channel 1 at a point on the loop where the accumulated concentration values would always be zero. The deformation of the square wave served as a test of the system during the operation.
Example of the Convolution Process
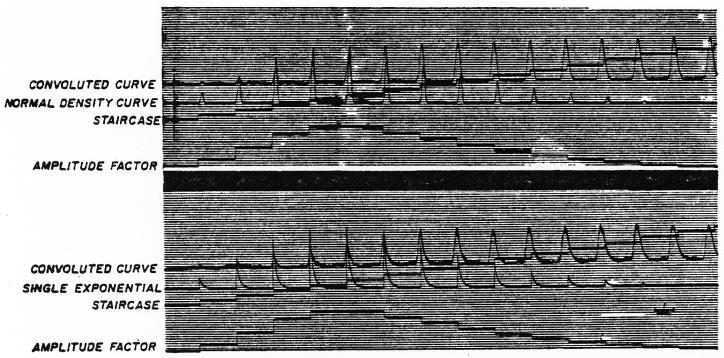
Continuous recordings of the output of selected operational amplifiers during the convolution are shown in Fig. 6.
Fig. 6.
Analog computation of the convolution integral by the method of Fig. 3. Upper panel. The normal density curve or symmetric randomizing process is used as the transfer function for the purposes of demonstration and is represented by the sequence of normal density curves as h(t). The input curve, C1(t) of Fig. 3, is represented in elongated form as the amplitude factor, which is the output of ampl. 4 of Fig. 3. The staircase (output of ampl. 7 of Fig. 3) is the x-axis voltage of the function generator and indicates each step of the convolution process. The convolution integral or convoluted curve [output of ampl. 5 recorded on the tape loop as C2(t)] is completed when the amplitude factor falls to zero. Lower panel. The convoluted curve, C2(t), was computed by the same method and input curve, C1(t), as above but with a single exponential lag as the transfer function. Because only 20 iterations were used, the convoluted curve shows the sharp peaks of the summed exponentials.
The increasing delay between the appearance time of the accumulating output curve and each new amplified h(t) may be seen. In me upper panel, the transfer function, h(t), was a normal density curve. The schema used tion,h(t), was a normal density curve. The schema used was that of Fig. 3 but bypassing amplifier 3. The resultant output curve (convoluted curve) changed in form with each summation but was fairly smooth; the final curve was similar in shape to the input curve (shown as amplitude factor in Fig. 6) but was less peaked and more spread out when compared on an appropriate scale.
This analog computer technic may be used for any transfer function that can be generated analytically or set up in a function generator. A single exponential (washout) process is illustrated in the lower panel of Fig. 6. This was generated in amplifier 3 (excluding 1 and 2) by making the initial condition, h(0), a positive value and adjusting the feedback potentiometer of amplifier 3 to me appropriate time constant. The output curve of the convolution is somewhat jagged since it is the sum of a series of sharply peaked curves. However, if the interval between steps were very small, the peaks would be close together and produce the smooth line expected theoretically. The practical limitation is that the smaller the interval chosen, the greater the number of iterations required and the greater the problems of amplification, bias, and noise.
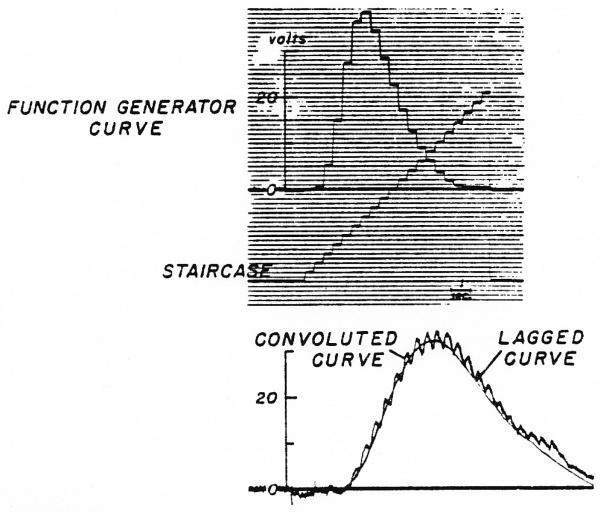
Since the normal density curve is a nonlinear equation, there is not a more direct method for using it as a transfer function in an analog computer. However, the exponential process, represented by the lag circuit (Fig. 2), is very readily applied direcdy. The two methods of computation of the output curve obtained from the same arbitrary function are compared in Fig. 7. The input curve in the upper panel was transformed by a single exponential lag (τ = 0.33 sec.) by me method of Fig. 3 and Fig. 6 (lower panel) to compute the “convoluted curve” and by the method of Fig. 2 to produce the “lagged curve.” The “convoluted curve” is jagged because the number of steps (20) in the iterative process was so small that the sharp peaks of the exponential curves representing h(t) are visibly separate. The two methods are seen to give comparable results.
Fig. 7.
Comparison of two methods of computing an ouput curve when the transfer function was a simple exponential lag. Upper panel. Input curve, C1, set up in function generator with staircase as abscissal voltage. Lower panel. Lagged curve obtained when C1 was input to the lag circuit of Fig. 2. Convoluted curve was produced as in lower panel of Fig. 6.
Distortion of Curves by the Sampling Systems
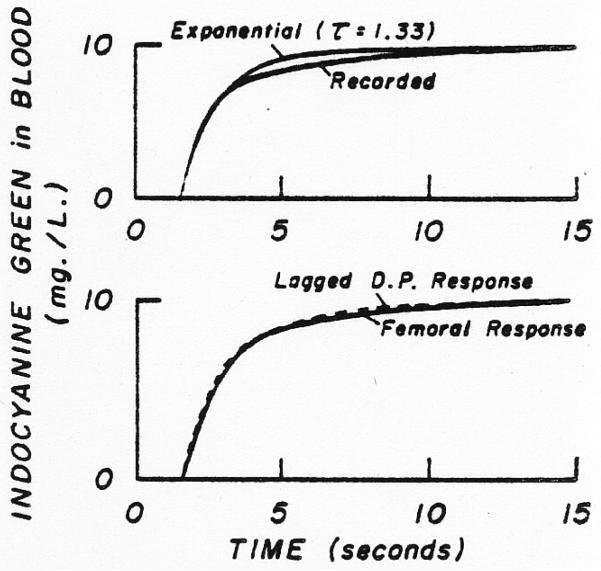
If both sampling systems produced the same distortion, then no correction would be needed in order to ascertain the transfer function between the sites. In certain experiments, with equal constant withdrawal rates of 10 ml. per minute, the response of the femoral system to a step change in dye concentration at the catheter tip was slower than that of the dorsalis pedis system (by the method of Fox and co-workers)5. The responses can be approximated roughly by a single exponential lag (Fig. 8). A practical method for correcting for the difference between the sampling system responses is to lag the response of the faster system by a single exponential so that the output (circuit of Fig. 2) matches the response of the slower femoral system (Fig. 8, lower panel). Thus, in such cases, for the determination of the transfer function, h(t), the convolution was performed using the recorded femoral curve as the input and comparing the output to the dorsalis pedis curve lagged by the single exponential.
Fig. 8.
Response of the sampling system to a step change in dye concentration at the tip of the catheter. Upper panel. The actual response recorded following the sudden change from blood containing no dye to that containing lOmg./L. indocyanine green is only moderately well approximated by an exponential rise (τ = 1.33 sec.) beginning after 1.55 sec. Lower panel. The response of the sampling system at the dorsalis pedis artery (D.P.) is lagged by a single exponential (τ = 0.59 sec.) to approximate the response obtained through the femoral artery sampling system (see Fig. 2). In addition, the dorsalis pedis response is delayed 0.2 sec. to account for the difference between the appearance times.
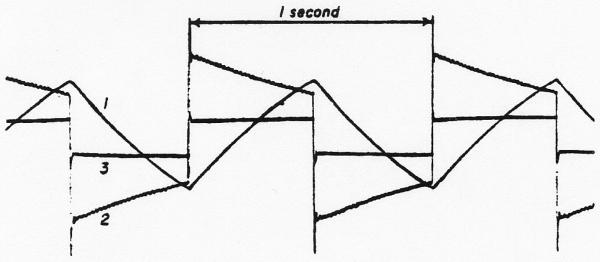
In order to define the indicator dilution curves as they were in the artery, one must correct each individual curve for the distortion induced by the sampling system. This can be done approximately by using an exponential lead circuit as shown in Fig. 9 if the sampling system response can be described by a single exponential, or by using two or three of these in parallel6. A test of the lead circuit is shown in Fig. 10. A square wave oscillation* was transformed by passing it through a single lag network. This “smeared” square wave was then fed to a lead circuit with exactly the same time constant. The output curve from this element then approximated the original square wave showing the adequacy of performance of the computer elements. However, it is apparent from Fig. 11 that such a single exponential lead provides less than ideal correction (as one might expect from Fig. 8 [upper panel]) but in most of these experiments, which were primarily intended to test the principles of the methods of approach, it was considered to be adequate. A better correction can be achieved by using additional integrating amplifiers in parallel to amplifier 2 of Fig. 9. Exponential corrections, of course, cannot account for the delay time for the fastest particles to traverse the sampling system (dead time).
Fig. 9.
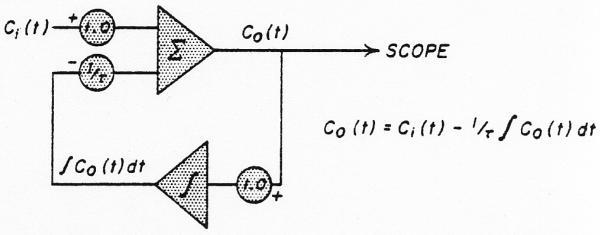
Analog computer diagram for single exponential lead. Such a system was used to correct dilution curves when the sampling system response was reasonably well approximated by a single exponential lag. The system does not account for the delay time in the catheter but only for the slurring. Two or more such leads may be used in series or in parallel to obtain more accurate correction for sampling system distortion.
Fig. 10.
Test of the adequacy of the exponential iead to correct for a lag. A periodic step change in voltage was lagged by a single exponential (line 1) and used as C1(t) of Fig. 9. Line 2 is its derivative, and line 3 is the corrected wave form, which is very similar to the original periodic square wave.
Fig. 11.
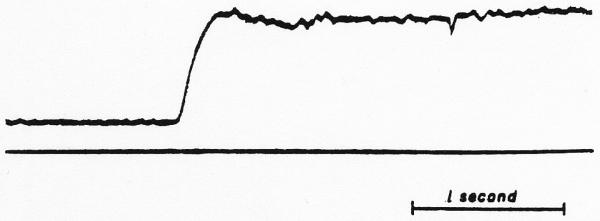
Sampling system response to a step change in dye concentration corrected by a single exponential lead. The lead (τ = 1.33 sec.) does not result in a good square wave and also exaggerates the noise. Better correction is obtained by using a sum of two such lead elements.
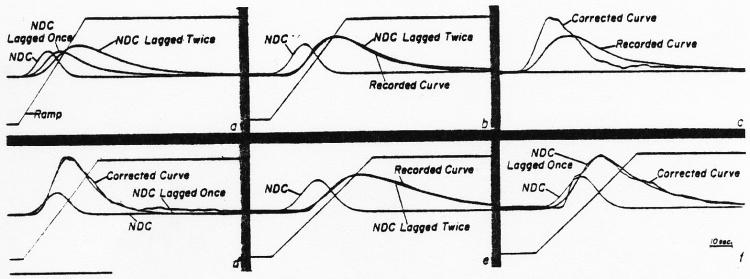
In defining individual dye curves by equation 1, the lagged normal density curve (NDC) was generated to describe the intravascular mixing process. This curve was then fed to another lag circuit whose time constant had been set previously to produce an exponential curve closely approximating the recorded sampling system response to a step input as in Fig. 8. This process added to the model solution a distortion similar to that added to the intravascular curve by the sampling system. The parameters σ, τ, and tc of the model were then adjusted until a solution fitting the recorded curve was obtained. In panel a of Fig. 12 are shown the ramp used to set the standard deviation, σ, of the normal density curve (NDC), the NDC lagged by a single exponential, τ1, and this curve lagged by a second exponential, τ2 = 1.33 sec., which approximates the sampling system distortion. Curve amplitudes in this figure are arbitrarily set and have no significance. In panel b, σ and τ1 were adjusted (σ = 0.55, τ1 = 1.05) so that the doubly lagged normal density curve fitted the curve recorded from titte femoral artery while τ2, which represents the sampling system, was held constant. Panel c illustrates the curve recorded at the femoral artery and the same curve corrected by a lead network (Fig. 9) with τ = 1.33 sec. In d, the lagged NDC (σ = 0.55, τ1 = 1.05, tc = 3.65, τ2 = 0) is seen to fit the corrected curve as well as it did the uncorrected one (panel b). Panels e and f illustrate that the lagged NDC (σ = 0.67, τ1 = 2.3) when lagged by the sampling system analog (τ2 = 1.11) fits the dorsalis pedis curve as recorded, and nearly the same solution (σ = 0.67, τl = 2.5) fits the corrected dye curve. The abnormal shape of the corrected curve can be attributed to the fact that the single exponential was an imperfect description of the sampling system response.
Fig. 12.
Example of the use of the exponential lead to correct dye dilution curves for distortion due to the sampling system and use of the lagged normal density curve to fit dye curves, a. A ramp, a normal density curve (NDQ, a lagged normal density curve3, and a NDC lagged by two exponentials in series, the second of which represents the sampling system, b. The doubly lagged NDC2 matched to a dye curve1 recorded from the femoral artery following the injection of dye into the lower thoracic aorta, c. The recorded femoral curve illustrated in b, c, and d, is approximated by a singly lagged NDC identical to that used in e and lacking the second lag. The irregularity of the corrected curve is partly due to inaccuracy of the single exponential lead as a correcting process. The ordinate scales are linear. The peak concentration, Cp, was 16.0 mg./l. for the dorsalis pedis curve and 19.7 mg./l. for the femoral.
The tc for these curves is the time from the injection to the time when the ramp crosses the zero axis. The mean transit time, t̄, of the lagged normal density curve is: t̄ = t̄c + τ, where τ is the time constant or the mean transit time of the exponential. The tc was obtained for each curve by reference to the original photokymograpbic record on which the time from injection to appearance or to peak concentration of dye could be measured.
Results
Lagged Normal Density Curve Required for Fitting the Equation to Individual Recorded Dye Curves
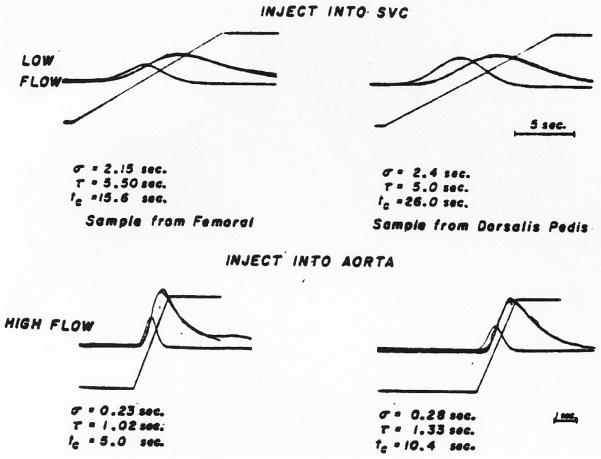
All of the 30 recorded dilution curves tested could be fitted by the lagged normal density curve. Typical results are shown in Fig. 12 b and e and in Fig. 13. The actual curves in the upper panels of Fig. 13 were recorded simultaneously at a time when the leg blood flow was approximately 500 ml. per minute and the curves of the lower panel were recorded when flow through the leg was increased to approximately 3 L. per minute by intraarterial infusion of adenosine triphosphate solution (1.0 mg./min.). These curves illustrate the general observation that σ, τ, and tc are all increased by longer transit through the arterial system.
Fig. 13.
Fitting of the model to recorded dilution curves. In each panel, superimposed on each recorded curve (irregular line) is the lagged normal density curve whose parameters, σ and τ, are listed below the panel. Also shown are the ramp and the NDC used in the generation of the model. Upper panels. Curves were recorded simultaneously from the right femoral (left) and the right dorsalis pedis arteries (right) following injection into the superior vena cava. Lower panels. Curves recorded from the same two sites in the same subject following injection into aorta when an infusion of adenosine triphosphate into the right external iliac artery was causing a considerable increase in rate of flow of blood in the leg. Ordinate scales are linear. Peak concentrations for femoral and dorsalis pedis curves respectively were: 9.3 and 8.1 mg./l. in the upper panels, and 22.6 and 16.5 mg./1. in the lower panels.
Another expected finding was that curves recorded following injection of dye into the superior vena cava (Fig. 13, upper panels) had much greater dispersion (larger σ and τ) than those recorded following injection into aorta (Fig. 12) when the cardiac output, thoracic aortic flow, and femoral flow were approximately constant.
When the rate of flow of the blood was increased, a dramatic decrease in σ and τ (Fig. 13, lower panels) was found with the reduced passage time of the dilution curve. In this situation, most of the curves, even at the dorsalis pedis artery, showed complete clearance of dye before recirculation occurred.
Application of the Convolution Integral to Determine the Transfer Function of the Segment Between the Femoral Artery and the Dorsalis Pedis Artery
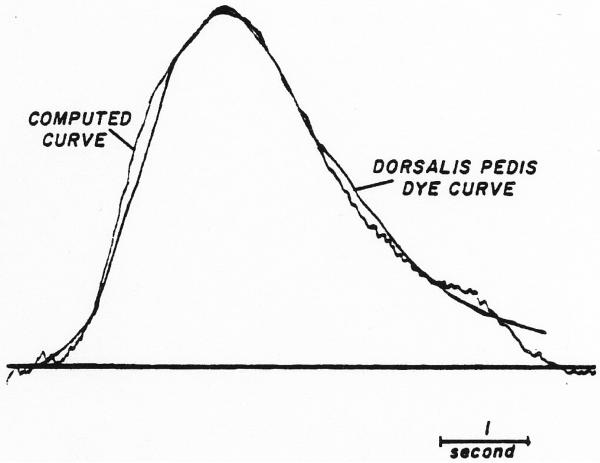
A typical result is the pair of curves recorded following thoracic aortic injection when the cardiac output was 6.1 L. per minute and the leg blood flow was approximately 500 ml. per minute (Fig. 14). In the figure is shown a comparison of the theoretical downstream curve, calculated by convoluting the recorded femoral curve with the model of the dispersion process, and the curve recorded from the dorsalis pedis artery. The tail of the calculated curve is oddly shaped because of truncation of the tail of the input curve in the function generator. The mean transit time through the segment was 5.19 seconds, σ = 0.31 second, τ = 0.86 second and t0 = 4.33 seconds.
Fig. 14.
Computation of dispersing process occurring between the femoral artery and dorsalis pedis artery. Original curves were recorded following aortic injection of indocyanine green. The recorded femoral curve (not shown) was used as input and convoluted with an assumed dispersing process to produce a theoretical output curve. The parameters of the mode Ifor the dispersing process were adjusted until the output curve approximated the curve recorded at the dorsalis pedis artery lagged by a single exponential (τ = 0.5 sec.) to compensate for the difference between sampling systems. The final values (σ = 0.3 sec., τ = 0.9 sec., tc = 4.3 sec.) provides a description of dispersion between the two sampling points. The ordinate scale is linear; Cp = 20.0 mg./l.
From these data one may estimate the average blood velocity between the sampling points. The measured distance between these points was 98 cm. The difference between appearance times was 3.8 seconds giving a maximal velocity of 25.8 cm. per second. The average velocity is distance divided by mean transit time = 18.9 cm. per second. The t̄/ta ratio was 1.37, very different from the 2.0 expected from Poiseuille flow.
The result of a more exacting test of the method is illustrated in Fig. 15. Curves were recorded at the two sampling sites following two injections separated by an interval of 4.5 seconds. Injections of 5.55 mg. and 5.4 mg. of dye, respectively, were made into the lower thoracic aorta at a time when the femoral flow was about 750 ml. per minute. The femoral curve, Cx, was convoluted with a theoretical dispersing process having σ = 1.06 seconds, τ = 0.3 second and tc = 7.9 seconds to produce a calculated downstream curve, C2, which fits the recorded dorsalis pedis curve reasonably well. The results shown in Fig. 14 and 15 were obtained with 20 iterations.
Fig. 15.
Computation of the dispersing process occurring between the femoral artery and dorsalis pedis artery. The dye was injected into the thoracic aorta as two slugs separated by 4.5 sec. The method used was as for the curves of Fig. 14. The parameters for the dispersing process (σ = 1.06 sec., τ = 0.3 sec, tc = 7.9 sec.) were unusual, for the time constant, τ, is ordinarily larger than the standard deviation, σ. This points out that a larger σ will compensate to some extent for a decreased τ and vice versa. Cp (femoral) = 21.7 mg./l.; Cp (dorsalis pedis) = 17.3 mg./l.
Discussion
This presentation is concerned primarily with the use of the analog computer for solving and testing a mathematical model of dispersion of an indicator in the circulation.
Other equations have been used to describe indicator-dilution curves. Sheppard3 used the random walk equation. Stow and Hetzel7 used the log normal curve, and Thompson and co-workers8 used a gamma variate. Although several models are able to yield solutions which describe recorded dye curves quite well, the random walk is more immediately meaningful physically because it implies that the indicator disperses randomly as it moves along the blood vessel. It also implies that the dispersion is continuing while the indicator passes a stationary observation point, a process which contributes to the asymmetry of the curve. Korners9 method of describing the curve in terms of the second moment (the variance) can be classed with these two models.
Indicator dilution curves can be fitted by a variety of methods which have no apparent physical equivalent in the circulation, such as polynomial or multiple exponential curve fitting. Exponentials are particularly suitable for manipulation with an analog computer and have analytical solutions. However, a three-exponential model with five parameters matches dye curves less closely than the lagged normal density curve with four.
Rationale for the Lagged Normal Density Curve as a Model
If dispersion at the injection site and distortion by the sampling system were negligible, if the injection were instantaneous, and if no recirculation occurred until all indicator had passed the recording site once, then the recorded dilution curves would represent the transfer function between the injection and sampling sites. Since the curves recorded at two arterial sites following a single injection of dye were shaped similarly to each other, with similar ratios of appearance time to mean transit time, it follows that the transfer function must also be shaped similarly to the recorded curves. Dye curves resemble normal density curves skewed to the right. The most convenient method of inducing skewness to the right in an analog computer is by means of an exponential lag, which led to the formulation of this model.
The strongest impetus for choosing a stochastic model for the description of the curves and of the transfer function was gained after consideration of the fact that, when two injections were made into the thoracic aorta a few seconds apart, two distinct peaks of concentration were recorded at the femoral artery but usually only one broad peak appeared at the dorsalis pedis artery. The merging of the peaks cannot be accomplished with exponential processes except with time constants so long that the curves were overly flattened and prolonged. A randomizing process, implying to and fro movement of indicator particles in the blood during each cardiac cycle. provides the necessary merging of the peaks without such great distortion.
The lagged normal density curve has the virtue of simplicity: the shape is defined completely by σ and τ; the position in time, by tc; and the area, by mi/Q (the amount of indicator injected divided by the flow). For the transfer functions, the area should be 1.0 if no indicator is gained or lost. It is most interesting that this simple lumped model provides a good description of a complex curved branching tapering elastic arterial system in which the flow is pulsatile and the medium is non-homogeneous.
The random walk equation3, the log normal curve7, and the gamma variate8 are similar in concept but cannot be used as easily. The random walk equation has the virtue of a sound theoretical physical basis but if a shift in time base is required for fitting it to recorded dye curves its meaning in terms of the physical basis is vitiated.
The method of Parrish and co-workers10 provides an analog description of the transfer function, h(t), but has the disadvantage that no simple numerical description of h(t) is obtainable. Desirable features of their method are the computational speed and the simplicity of the analog network. The transfer function of each delay line is similar to a normal density curve with a fixed standard deviation. Their models would have been further simplified by the use of a lag circuit in series with a delay line, in which case the transfer function would be the same as the model used in our experiments.
Mathematical Assumptions
A. When the lagged normal density curve is matched with a recorded dilution curve, it would be a description of the circulatory dispersion between injection and sampling point only if: (1) the indicator at the injection site labels a cross section of the stream with the amount of label in each lamina proportional to the flow through that lamina (“flow-tagging” as defined by Gonzalez-Fernandez)11; (2) the flow characteristics are not altered by either the injection transveral times, or the transfer function, h(t), is constant or sampling; (3) flow is stationary (the distribution of during the recording of the curves); (4) the movement of indicator represents movement of blood; (5) there is no distortion or delay induced by the sampling system; (6) the blood sampled represents all laminae in a cross section with volume proportional to the flow through each lamina (“flow sampling”, Gonzalez-Fernandez)11; and (7) the vascular system is mathematically linear. Certain requirements cannot be met: indicator is widely dispersed at the injection site; flow is altered momentarily by the injection; indocyanine green labels only the plasma; and flow is pulsatile, not steady. These are incontrovertible facts but may not be serious complications, and Zierler12 advocated the use of the recorded curve as the transfer function. The effects of pulsatile flow, as he pointed out, may be small if the average flow per cycle is constant and there are many cardiac cycles during the passage time of the dilution curve. Certainly the cyclic variations in flow, in pressure, and in volume contribute significantly to the randomization of indicator traveling in the blood plasma. The presence of erythrocytes and the curvature and branching of the vessels further complicate intravascular dispersion.
B. Calculation of the transfer function between a pair of sampling sites is a good method of defining circulatory dispersion when the sampling systems are identical; then the transfer function calculated from the recorded curves is independent of dispersion at the injection site and of distortion by the sampling system. The variation due to pulsatile flow is more prominent since the transfer function extends over a smaller number of cardiac cycles than do the recorded curves. Moreover, the transfer function should be independent of the form of the input and output curves if the vascular system is mathematically linear – that is, describable by a system of linear differential equations – and if the flow is steady and stationary. All that is required for independence from the form of the input function, C1(t), is that the indicator behave as the fluid does. Injections were made at different sites (superior vena cava or aorta) and were of varied form (single slug or two slugs) in order to test this assumption, but the inaccuracies of the analytical method prevent the use of these data to obtain the final answer. The successful result shown in Fig. 15 suggests that linearity is present.
The transfer function was found to have smaller values of σ, τ, and tc when the flow was rapid. Detailed digital computer analysis of the transfer functions between 60 pairs of recorded curves from these experiments showed13σ and τ to be linearly proportional to t, therefore indicating that the temporal spread of the concentration-time curves is proportional to the velocity at the sampling site and strongiy suggesting that the spatial dispersion along the length of the vessel is independent of the flow rate.
Uses of Models of Circulatory Dispersion
One use is to provide a description of observed data. Any of the models mentioned can do mis, but the one that requires the fewest numbers to provide a complete description and is the easiest to understand is the one to be preferred. If descriptive models can be obtained for the major portions of the circulation, then a meaningful circulation model can be constructed. If circulatory transport can be so defined, then the humoral or hormonal parts of physiologic servo control systems might be elucidated with some precision. A combination of this type of information with that on rates of transmembrane transport and intracellular reaction kinetics is highly desirable in elucidating the detailed mechanisms of hormonal control or of responses to an administered drug.
Footnotes
This investigation was supported in part by Research Grant H-4664 from the National Institutes of Health, Public Health Service, and by Life Insurance Medical Fund Research Grant G-61-15.
Model FR1100, made by Ampex Corporation, Redwood City, California.
Model XC250A made by Waters Corporation, Rochester, Minnesota.
Tektronix, Inc., Beaverton, Oregon.
George A. Philbrick. Researches, Inc., Boston, Massachusetts.
Visicorder, Honeywell, Denver Division, Denver, Colorado.
Arbitrary Function Component, George A. Philbriclc Researches, Inc.
Wave Form Generator, Textronix, Inc., Beaverton, Oregon
Source was Low Frequency Function Generator, Model HP202A, Hewlett-Packard Company, Palo Alto, California.
References to Analog Computer Analysis
- 1.HULL DE, KENT JW. Radioactive Tracers to Mark Interfaces and measure intermixing the pipelines. Ind. Eng. Chem. 1952;44:2745. [Google Scholar]
- 2.TAYLOR GI. Diffusion and Mass Transport in Tubes. Proc Pbys Soc (London) 1954;67:857. [Google Scholar]
- 3.SHEPPARD CW. Mathematical Considerations of Indicator Dilution Techniques. Minnesota Med. 1954;37:93. [PubMed] [Google Scholar]
- 4.PETERSON LH. Current Trends in Cardiovascular Physiology. Physiologist. 1963;6:115. [PubMed] [Google Scholar]
- 5.FOX IJ, et al. Dynamic Response Characteristics of Systems for Continuous Recording of Concentration Changes in a Flowing Liquid (for example, Indicator-Dilution Curves) J. Appl. Physiol. 1957;11:390. doi: 10.1152/jappl.1957.11.3.390. [DOI] [PubMed] [Google Scholar]
- 6.COOPER JK, et al. Removal of Distortion from Indicator Dilution Curves with Analog Computer. Circulation Res. 1963;12:131. doi: 10.1161/01.res.12.2.131. [DOI] [PubMed] [Google Scholar]
- 7.STOW RW, HETZEL PS. An Empirical Formula for Indicator-Dilution Corves as Obtained in Human Beings. J. Appl. Physiol. 1954;7:161. doi: 10.1152/jappl.1954.7.2.161. [DOI] [PubMed] [Google Scholar]
- 8.THOMPSON HJ, JR., et al. Indicator Transit Tune Considered as a Gamma Variate. Circulation Res. 1964;14:502. doi: 10.1161/01.res.14.6.502. [DOI] [PubMed] [Google Scholar]
- 9.KORNER PI. Some Factors Influencing the Dispersion of Indicator Substances in the Mammalian Circulation. In: Butler JAV, et al., editors. Progress in Biophysics and Biophysical Chemistry. Vol. 11. Pergamon Press; New York: 1961. p. 111. [PubMed] [Google Scholar]
- 10.PARRISH Daniel, et al. Analog Computer Analysis of Flow Characteristics and Volume of the Pulmonary Vascular Bed. Circulation Res. 1959;7:746. doi: 10.1161/01.res.7.5.746. [DOI] [PubMed] [Google Scholar]
- 11.GONZALEZ-FERNANDEZ JM. Theory of the Measurement of the Dispersion of an Indicator in Indicator-Dilution Studies. Circulation Res. 1962;10:409. doi: 10.1161/01.res.10.3.409. [DOI] [PubMed] [Google Scholar]
- 12.ZIERLER KI. Theoretical Basis of Indicator-Dilution Methods for Measuring Flow and Volume. Circulation Res. 1962;10:393. [Google Scholar]
- 13.BASSINGTHWAIGHTE JB. 1964. Dispersion of Indicator in the Plasma of Circulating Blood. Thesis, Graduate School, Univ. of Minnesota. [Google Scholar]
- 14.BASSINGTHWAIGHTE JB, ACKERMAN EH, WOOD EH. Applications of the Lagged Normal Density Curve as a Model for Arterial Dilution Curves. Circulation Res. 1966;18:398. doi: 10.1161/01.res.18.4.398. [DOI] [PMC free article] [PubMed] [Google Scholar]


