

Abstract
L-type calcium channels play only a minor role in basal neurotransmitter release in brain neurons but contribute significantly after induction of plasticity. Very little is known about mechanisms that enable L-type calcium channel participation in neurotransmitter release. Here, using mouse primary cortical neurons, we found that inhibition of Erk1/2 (extracellular signal-regulated kinases 1 and 2) enhanced synaptic vesicle exocytosis by increasing calcium influx through L-type calcium channels. Furthermore, inhibition of Erk1/2 increased the surface fraction of these channels. These findings indicate a novel inhibitory effect of Erk1/2 on synaptic transmission through L-type calcium channels.
Introduction
L-type calcium channels play only a minor or no role in basal neurotransmitter release (Kamiya et al., 1988; Edmonds et al., 1990; Takahashi and Momiyama, 1993; Wheeler et al., 1994; Dunlap et al., 1995; Reuter, 1995; Holmgaard et al., 2009) except in several cell types, including retina and inner ear hair cells (Schmitz and Witkovsky, 1997; Zhang et al., 1999). However, they are important for presynaptic plasticity (Magee and Johnston, 1997; Jensen and Mody, 2001; Shinnick-Gallagher et al., 2003; Zakharenko et al., 2003; Seoane et al., 2009), and emerging evidence suggests that the contribution of L-type calcium channels in neurotransmitter release becomes significant upon induction of plasticity (Fourcaudot et al., 2009). Yet, very little is known about molecules that regulate L-type calcium channel participation in neurotransmitter release.
Erk1/2 (extracellular signal-regulated kinases 1 and 2), also known as p42/p44-Map (mitogen-activated protein) kinases, are among the signaling molecules that modulate neurotransmitter release. Activation of Erk1/2 through growth factors or constitutively active Ras has been shown to enhance neurotransmitter release (Jovanovic et al., 2000; Kushner et al., 2005), whereas inhibition of Erk1/2 has been found to enhance post-tetanic potentiation (Vara et al., 2009), which suggests that Erk1/2 may also inhibit the release of a neurotransmitter.
To better understand how Erk1/2 regulate presynaptic release, we inhibited Erk1/2 phosphorylation in mouse primary cortical neurons and imaged synaptic vesicle exocytosis and calcium influx using synaptopHluorin (Miesenböck et al., 1998) and the fluorescence resonance energy transfer (FRET)-based calcium indicator TNXXL (Mank et al., 2008), respectively. Erk1/2 inhibition enhanced the rate of synaptic vesicle exocytosis without altering endocytosis or the size of the readily releasable pool of vesicles. In addition, it enhanced calcium influx in axons through L-type calcium channels, which were required for the observed effect on exocytosis. Finally, we found that Erk1/2 inhibition increased the surface fraction of L-type calcium channels.
Materials and Methods
All chemicals were obtained from Sigma or Invitrogen unless mentioned otherwise. U0126, U0125, and bafilomycin were from EMD Chemicals, and SL327, nitrendipine (NIT), BayK8644, and ω-conotoxin-GVIA were from Tocris Bioscience.
Primary culture and transfection of mouse cortical neurons.
All experiments with animals were approved by the National Institute of Mental Health Animal Care and Use Committee (Bethesda, MD). Cortices from the brain of embryonic day 16 embryos of 129S6-C57BL/6J mixed background mice (both genders) were dissected in ice-cold dissociation medium containing (in mm) 68 NaCl, 2.6 KCl, 0.15 Na2HPO4, 0.11 KH2PO4, 8.3 glucose, 10.9 sucrose, and 10 HEPES (320 mOsm) and treated with 0.125% trypsin for 20 min at 37°C. Trypsinized cortices were triturated in MEM Eagle with 10% FBS, and the dissociated cells were plated on 25 mm glass coverslips (Bellco) coated with poly-d-lysine and laminin at a density of ∼800 cells/mm2. The cells were maintained in medium containing MEM Eagle (with Earle's salts, 6000 mg/L glucose, 3700 mg/L NaHCO3), N3 (0.2 g/L apo-transferrin, 0.01 g/L BSA, 0.03 g/L putrescine, 0.014 mg/L selenium, 0.02 mg/L tri-iodothyronine, 0.01 g/L insulin, 0.012 mg/L progesterone, and 0.04 mg/L corticosterone), 5% horse serum (Hyclone), 1% FBS, and 2 mm GlutaMAX (Invitrogen). Cells were maintained at 37°C with 10% CO2 and 95% humidity. On day in vitro (DIV) 5, cells were fed with new media containing 1.3 μg/ml 5-fluoro-2′-deoxyuridine and 3.3 μg/ml uridine. Half of the medium was changed every 3–4 d.
Cells were transfected on DIV 5 (for synaptopHluorin) or DIV 11 [for TN-XXL, CerTN-L15 (Heim et al., 2007), or YH-Cav1.2/β1b/α2δ (Green et al., 2007)] using Lipofectamine 2000 and DNA at a ratio of 2 μl:1 μg, following the manufacturer's instructions (Invitrogen).
DNA constructs.
The plasmid pCI-Neo expressing synaptopHluorin was a gift from Gero Miesenböck (University of Oxford, Oxford, UK). TN-XXL, CerTN-L15, enhanced cyan fluorescent protein (CFP), mCitrine, and Citrine cp174 were gifts from Oliver Griesbeck (Max Planck Institute of Neurobiology, Martinsried, Germany). YH-Cav1.2, β1b, and α2δ were gifts from Ricardo Dolmetsch (Stanford University, Stanford, CA).
Live imaging.
Imaging was performed in two different setups both using Zeiss Axiovert 200M microscope with a 63× Plan-Apochromat oil-immersion objective [1.4 numerical aperture (NA)] coupled to a spinning disk confocal scan head Ultraview RS (PerkinElmer) and a cooled CCD camera (Hamamatsu C9100). SynaptopHluorin was excited with 488 nm light. The emission filters were LP505 (setup I) or 527W55 (setup II). For FRET experiments, CFP was excited using 442 nm light and the emission filters were 485W60 (CFP channel) and 527W55 (FRET channel). YFP was excited using 514 nm light and the emission filter was a 587W125 filter (acceptor channel). Laser illumination was controlled through an acousto-optic modulator and synchronized with a camera using MetaMorph (Molecular Devices) in setup I (most synaptopHluorin experiments) or Volocity (PerkinElmer) in setup II (FRET and synaptopHluorin experiments with NIT or bafilomycin).
Neurons were imaged on DIV 13–15. The coverslips were mounted on Attofluor cell chamber (Invitrogen), and cells were maintained in 700 μl of the external solution as follows (in mm): 119 NaCl, 2.5 KCl, 2 CaCl2, 2 MgCl2, 25 HEPES, pH 7.4, 30 glucose, 50 μm dl-2-amino-5-phosphonovaleric acid (AP5) and 10 μm 6,7-dinitroquinoxaline-2,3(1H,4H)-dione (DNQX) (Sankaranarayanan and Ryan, 2000). The osmolarity and pH of the solution were adjusted to 320–330 mOsm and 7.4, respectively. AP5 and DNQX were included to prevent recurrent excitatory synaptic activity. Transfected cells were chosen at random and, for each cell, one frame containing axons expressing the transfected gene was imaged. SynaptopHluorin was localized predominantly in axons, and dendrites were barely visible. In FRET experiments, axons were distinguished from dendrites by thin uniform diameter processes containing boutons, but not spines, and by being extended farther away from soma.
Electrical stimulation was 10 V, 1 ms pulses at 10 Hz generated by a S48 square pulse Grass stimulator (Astro-Med) and delivered through two platinum electrodes spaced 1 cm apart. Fluorescent images (100 ms exposure) were acquired every 3 s (for most experiments with synaptopHluorin) or 1 s (for FRET or synaptopHluorin experiments with NIT). Each imaging session included one continuous train of electrical pulses. The external solution was changed after each imaging session. SynaptopHluorin response to electrical stimulation became stable starting from the second imaging session (data not shown). Therefore, data from the first imaging session were discarded in all experiments.
For measuring the readily releasable pool, cells were perfused throughout the imaging session to enable sucrose delivery without changing the volume of external solution. Perfusates were delivered directly on the imaged area of the coverslip and switched rapidly by an electro-mechanical valve (Lee Company). Since the addition of sucrose shifted the focal plane of the objective, additional Z-sections were acquired to include the new focal plane.
Immunofluorescence.
YH-Cav1.2-transfected cells were fixed on DIV 15 for 15 min with 4% paraformaldehyde containing 4% sucrose, permeabilized for 10 min with 0.1% Triton X-100 (Triton X-100 was omitted for nonpermeabilized preparations), and blocked for at least 30 min with 10% donkey serum (Jackson ImmunoResearch). Cells were incubated with mouse anti-HA antibody (1:1000, Covance) overnight at 4°C. Cells were washed with PBS and incubated for 1 h at room temperature with Cy3-conjugated donkey anti-mouse antibody (1:100, Jackson ImmunoResearch). After PBS wash, coverslips with cells were mounted on glass slides using 80% glycerol in PBS. Cells were imaged using a Zeiss LSM 510 microscope with 63× Plan Apochromat (1.4 NA) objective. YFP and Cy3 fluorophores were excited by 488 and 543 nm lights, respectively. Z-sections separated by 1 μm were collected using LSM software (Zeiss).
Image analysis.
The analysis was performed using MetaMorph (Molecular Devices). Maximum projection images were obtained, and for each bouton one 10 × 10 pixel region of interest (ROI) was drawn over it (8–12 ROI/cell) and another ROI was drawn at an empty space close to the bouton. Bouton fluorescence was then calculated by subtracting the fluorescence of the empty ROI from the fluorescence of the ROI with the bouton.
SynaptopHluorin response, dF, was defined as a difference between fluorescence at a given time point and the baseline fluorescence, which was the average of fluorescence at the five time points before electrical stimulation. The dF values for synaptopHluorin experiments in Figures 1 and 2B and C are not directly comparable to those in Figure 2A and Figure 6 because these experiments were performed using different setups.
Figure 1.

U0126 increases synaptopHluorin response to electrical stimulation. A, Top, Erk1/2 Western blot of cell extracts from neurons treated with DMSO, U0125, U0126, or SL327 for 20 min. Bottom, Phospho-Erk1/2 to total Erk1/2 ratio normalized to the value obtained with DMSO-treated cells in each blot (n = 2 dishes per treatment, 1 dish/blot). Dots of the same color represent data from one blot. Bi, Axons from a neuron expressing synaptopHluorin. Colored squares represent ROIs. The color scale represents the range of fluorescence intensity from 0 to 1100 U. Bii, dF plots for individual ROIs in Bi are shown in the same colors; averaged dF is shown by the black line. Biii, Enlarged view of the region within the white box in Bi before stimulation and at the eighteenth second of stimulation. Biv, Line scan along an axon (red line in Biii) reveals fluorescence increase in boutons (segments b, d), but not in between boutons (segments a, c). Ci, Experimental scheme for testing effects of U0126, SL327, and U0125 on synaptopHluorin response. Pink vertical bars show times of imaging. (Cii, Ciii, Cv, Cvi, Cviii, Cix) dF at the sixth second of stimulation. Lines connect responses in individual boutons (Cii, Cv, Cviii) and their averages for individual cells (Ciii, Cvi, Cix). (Civ, Cvii, Cx) dF during baseline (0–15 s) and electrical stimulation (15–33 s). Insets show dF dynamics over 207 s, which include fluorescence decay after the stimulation (33–207 s). Rectangular box corresponds to the time window shown on the main diagram. Horizontal bar on top of graphs shows duration of electrical stimulation. Data points are separated by 3 s. Number of cells/boutons is shown in parentheses. *p < 0.05, **p < 0.01, ***p < 0.001, compared to values obtained with corresponding DMSO control. Error bars indicate SEM.
Figure 2.

U0126 enhances exocytosis without affecting endocytosis or vesicle pool size. Ai, Experimental scheme for testing the effect of U0126 on synaptopHluorin response without or with bafilomycin (Baf). Pink vertical bars show times of imaging. Aii, Normalized dF (described in Materials and Methods) in cells treated with DMSO followed by bafilomycin (DMSO + bafilomycin), and cells treated with U0126 followed by bafilomycin (U0126 + bafilomycin). Stimulation lasted 30 and 90 s in the absence and presence of bafilomycin, respectively (indicated by horizontal bars). Boxed region was used for quantification of endocytosis shown in Aiii. Aiii, Exocytosis (Exo; measured as normalized dF in the presence of bafilomycin) and endocytosis (Endo; difference in normalized dF in the presence and absence of bafilomycin) derived from the boxed region in Aii. Horizontal bar on top of the graph shows duration of electrical stimulation. Data points are separated by 3 s. *p < 0.05, compared to values obtained with DMSO control (unpaired t test). Bi, Example of axons imaged in sucrose stimulation experiment. Squares represent ROIs. Bii, dF from color-matched ROIs in Bi. Average dF is represented by the black line. Ci, Experimental scheme for testing the effect of U0126 on sucrose-evoked exocytosis. Pink vertical bars show times of imaging. (Cii, Ciii) dF evoked by sucrose stimulation in the presence of DMSO or U0126. Lines connect responses in individual boutons (Cii) and their averages for individual cells (Ciii). Civ, Dynamics of synaptopHluorin response before (0–22.5 s), during (22.5–27.5 s), and after (27.5–100 s) sucrose stimulation. Horizontal bars on top of graphs show duration of sucrose perfusion. Data points are separated by 5 s. Number of cells/boutons is shown in parentheses. Data are presented as means ± SEM.
Figure 6.

U0126 increases synaptopHluorin response in an L-type calcium channel-dependent manner. i, Experimental scheme for drug treatment. Pink vertical bars indicate times of imaging. ii, iii, Lines connect dF in individual boutons (ii) and average response from individual cells (iii) at the sixth second of electrical stimulation. Colors of lines represent individual cells (iii). iv, Dynamics of dF before (0–6 s) and during (6–12 s) stimulation. Insets show dF over 68 s, including fluorescence decay after stimulation (12–68 s). Rectangular box corresponds to the time window shown in the main diagram. Data points are separated by 1 s. Horizontal bars on top of the graphs show duration of electrical stimulation. Number of cells/boutons is shown in parentheses. Data are presented as means ± SEM. *p < 0.05, **p < 0.01, compared to corresponding values obtained with DMSO.
For FRET experiments, fluorescence collected in a FRET channel included three components: (1) the actual FRET signal; (2) CFP emission bleed through; and (3) emission from citrine evoked by 442 nm light used for exciting CFP. The actual FRET signal from citrine was obtained by subtracting the components (2) and (3) from the total fluorescence in the FRET channel. The fractions of the components (2) and (3) were determined using CFP-alone and citrine-alone constructs, respectively. FRET ratio or dR/R0 (%) was calculated as follows:
{[(CFP/citrine) − (CFP/citrine)baseline]/(CFP/citrine)baseline} * 100, where (CFP/citrine)baseline is the average of (CFP/citrine) for the five time points immediately before the onset of electrical stimulation.
Statistical analyses were performed using values that represented individual cells. These values were obtained by averaging data from individual boutons of each cell (one cell/dish). Paired t test was used for comparison unless mentioned otherwise. Across all experiments, we observed that both the synaptopHluorin response and FRET ratio during electrical stimulation and the response to various drugs were more heterogeneous at the level of individual boutons compared to individual cells. These results are consistent with other results showing high interbouton variability (Kirischuk and Grantyn, 2002; Moulder et al., 2007).
To estimate the surface fraction of YH-Cav1.2, maximum projection images were obtained for hemagglutinin (HA) and YFP signals. On both sets of images, ROIs were drawn around the soma and the fluorescence values were subtracted from the background fluorescence values obtained by moving the ROI to an empty place close to the soma. Fluorescence values for HA and YFP signals from permeabilized neurons were then used to obtain the coefficient of linear regression. The surface fraction was obtained by dividing the HA fluorescence in nonpermeabilized neurons by the product of YFP fluorescence in nonpermeabilized neurons and the coefficient of linear regression.
Cell lysis.
Cells were scraped from the coverslip in 100 μl of buffer A (50 mm Tris-HCl, pH 7.5, 1 mm EDTA, 1 mm EGTA, 0.1% 2-mercaptoethanol, 1% Triton X-100, 0.5 mm sodium vanadate, 50 mm sodium fluoride, 5 mm sodium phosphate, 10 mm glycerophosphate, and 0.1 mm PMSF), lysed by rotating at 4°C for 30 min, and centrifuged for 10 min at 12,000 × g at 4°C. The supernatant was used for Western blot.
Western blot.
Twenty micrograms of total protein was separated in 12.5% SDS-PAGE and transferred to a polyvinylidene difluoride membrane (Millipore). The membrane was blocked with 10 mm Tris-HCl, pH 7.5, 100 mm NaCl, 0.1% Tween 20 solution (TBS) containing 5% dry milk for 1 h at room temperature and incubated with primary antibody (rabbit anti phospho-Erk, 1:1000, Cell Signaling Technology) at 4°C overnight. Following washes with TBS, the membrane was incubated at room temperature for 1 h with HRP-conjugated anti-rabbit (Jackson ImmunoResearch) antibody. The protein bands were visualized using LumiGLO reagent (Cell Signaling Technology). Following visualization, blots were stripped with the stripping buffer (Signagen) and reprobed with anti-Erk1/2 antibody (Cell Signaling Technology). The blots were scanned and quantitated using MetaMorph.
Results
MEK inhibitors increase synaptic vesicle exocytosis but not endocytosis or vesicle pool size
To examine modulation of presynaptic release by Erk1/2, we investigated how acute pharmacological inhibition of MEK (Map kinase kinase), a kinase that phosphorylates Erk1/2, affects synaptic vesicle exocytosis in mouse primary cortical neurons expressing synaptopHluorin. We first confirmed that a 20 min treatment with MEK inhibitor U0126 (10 μm) or SL327 (50 μm) (Duncia et al., 1998; Favata et al., 1998) reduced Erk1/2 phosphorylation in neurons (by 90 and 75%, respectively), whereas U0125 (10 μm), a control compound structurally similar to U0126, did not (Fig. 1A).
To study the effect of U0126 or SL327 on synaptic vesicle exocytosis, we compared the synaptopHluorin response dF (defined in Materials and Methods) (Fig. 1Bi,Bii) in the same presynaptic boutons (Fig. 1Biii,Biv) during electrical stimulation after a 20 min treatment with the DMSO vehicle and drug and after 30 min of drug washout (Fig. 1Ci). U0126 and SL327 reversibly enhanced dF measured at the sixth second of the stimulation by 67 and 78%, respectively, when compared to DMSO (Fig. 1Cii,Ciii,Cv,Cvi) (DMSO before U0126: 17.4 ± 1.7, U0126: 29 ± 2.3, p < 0.001; n = 11; washout: 17 ± 4.1, washout vs DMSO: p = 0.78; n = 5; DMSO before SL327: 23.5 ± 2.4, SL327: 41.9 ± 4.1, p < 0.001; n = 9 and washout: 27.6 ± 1.8, washout vs DMSO, p = 0.07; n = 8), whereas U0125 had no effect (Fig. 1Cviii,Cix) (DMSO before U0125: 20.1 ± 1.6, U0125: 20.1 ± 1.8, p = 0.99; n = 6). dF was significantly higher during 18 and 12 s of stimulation following treatment with U0126 and SL327 respectively, compared to corresponding DMSO conditions (Fig. 1Civ,Cvii). The greatest relative difference in dF was during the first 6 s of stimulation (Fig. 1Civ,Cvii). U0125 did not alter dF at any time point during stimulation (Fig. 1Cx). These results suggest that the action of U0126 resulted from MEK inhibition.
dF represents a net effect of exocytosis (leading to an increase in fluorescence), endocytosis, and reacidification (leading to a decrease in fluorescence) (Sankaranarayanan and Ryan, 2001). To determine whether the U0126-mediated enhancement of dF resulted from an increase in exocytosis, decrease in endocytosis, or both, we used a v-type ATPase blocker bafilomycin A1, which prevents reacidification of synaptic vesicles after endocytosis (Sankaranarayanan and Ryan, 2001). In the presence of bafilomycin, exocytosed vesicles remain fluorescent after endocytosis and, therefore, dF is a direct measure of exocytosis. Also, endocytosis can be quantified as the difference between dF in the presence and absence of bafilomycin (Sankaranarayanan and Ryan, 2001).
We treated cells with either DMSO or U0126 for 20 min and delivered electrical stimulation for 30 s. After 15 more min, bafilomycin was added to the cells and a 90 s stimulation was delivered 1 min later (Fig. 2Ai). During this prolonged stimulation, dF reached saturation levels (Fig. 2Aii) that did not differ between DMSO and U0126-treated cells (dF at the ninetieth second of stimulation, DMSO: 873.9 ± 164.9; n = 4; U0126: 727.1 ± 103.9; n = 5, p = 0.45, unpaired t test). We normalized dF at each time point to the mean dF of the last five time points of the 90 s stimulation (Fig. 2Aii). Both in the absence and presence of bafilomycin, U0126 increased the normalized dF during the first 30 s of stimulation (Fig. 2Aii, boxed region).
The time constant of exocytosis, τ, was determined from the single exponential fit of the normalized dF curve for each cell obtained in the presence of bafilomycin. τ was ∼2-fold smaller in U0126-treated cells (14.6 ± 2.3 s) compared to that in DMSO-treated cells (τ = 27 ± 3.6 s, p = 0.02, unpaired t test). The levels of endocytosis did not differ between U0126 and DMSO-treated cells at all time points during electrical stimulation (p > 0.05, unpaired t test) (Fig. 2Aiii). After 30 s of stimulation the endocytosis levels in the presence of DMSO and U0126 were 30 and 28%, respectively, of dF at saturation (Fig. 2Aiii), which is consistent with the previously reported values (Nicholson-Tomishima and Ryan, 2004; Mani et al., 2007; Kim and Ryan, 2009). These results show that inhibition of Erk1/2 phosphorylation enhances synaptic vesicle exocytosis but not endocytosis during electrical stimulation.
Next, we tested whether U0126 changed the size of the readily releasable pool of synaptic vesicles, which are docked to the plasma membrane and exocytose by a brief hyperosmotic shock with sucrose (Rosenmund and Stevens, 1996). We measured dF evoked in the same cells by a 5 s sucrose shock in the presence of DMSO and then in the presence of U0126 (Fig. 2B,Ci). Both of the dFs were similar (DMSO: 20.1 ± 2.7; U0126: 21 ± 3.1, p = 0.41; n = 4) (Fig. 2Cii–iv) suggesting that U0126 did not alter size of the readily releasable pool.
U0126 enhances calcium influx and exocytosis through L-type calcium channels
To test whether Erk1/2 affect influx of calcium during electrical stimulation, we monitored calcium levels in axons using TNXXL, a genetically encoded FRET-based calcium indicator (Fig. 3A). The axons were identified as processes with boutons, but not spines (Fig. 3Ai). Electrical stimulation decreased CFP emission and increased citrine emission, resulting in an increased FRET ratio [dR/R0 (%), defined in Materials and Methods] (Fig. 3Aii). FRET ratio was measured in the same cells after 20 min treatments with DMSO and U0126 and after a 30 min washout of U0126 (Fig. 3Bi). For comparisons between the treatments, we averaged dR/R0 (%) obtained between the fourth and sixth seconds of stimulation, hereafter referred to as [FRET ratio]4–6. The [FRET ratio]4–6 obtained following U0126 treatment was 59% higher than that obtained after DMSO treatment. This increase was partially reversed following U0126 washout (DMSO: 122.5 ± 17.1, U0126: 195 ± 26.1, p = 0.007; washout: 149.9 ± 21.1, washout vs DMSO: p = 0.01; n = 6) (Fig. 3Bii,iii). dR/R0 (%) was higher at all time points during stimulation following U0126 treatment compared to DMSO treatment, and washout of U0126 reduced dR/R0 (%) (Fig. 3Biv). These results indicate that U0126 reversibly enhances calcium influx in axons.
Figure 3.

U0126 increases calcium level in axons during electrical stimulation. Ai, Left and middle, Images of axons of a TNXXL-transfected neuron with representative ROIs (colored squares) acquired using the CFP (left) and FRET (middle) channels (defined in Materials and Methods). Right, Dendrites with spines (indicated by arrows). Aii, Left and middle, corresponding dF/F0 for the color-matched ROIs in Ai; the black line represents average response. Right, Averaged dR/R0 (%) for all ROIs. Bi, Experimental scheme for testing effect of U0126 on FRET ratio. Pink vertical bars show times of imaging. Bii, Biii, [FRET ratio]4–6 for individual boutons (Bii) and averages for individual cells (Biii); lines connect data points for the same boutons/cell. Biv, dR/R0 for cells before (0–6 s), during (6–12 s), and after (12–23 s) electrical stimulation. Each data point is separated by 1 s. Horizontal bar on top of the graphs show duration of electrical stimulation. Number of cells/boutons is shown in parentheses. Data are presented as means ± SEM; **p < 0.01, ***p < 0.001 (black asterisks), for comparison between U0126 and DMSO. *p < 0.05, ***p < 0.001 (red asterisks), for comparison between washout and DMSO.
We also determined the FRET ratio in the soma of neurons transfected with CerTN-L15 during electrical stimulation after a 20 min treatment with DMSO followed by a 20 min treatment with either U0126 or U0125 (Fig. 4A,Bi). U0126 increased [FRET ratio]4–6 by 50% (DMSO: 44.8 ± 11.9, U0126: 67.5 ± 13, p < 0.001; n = 4), whereas U0125 had no effect (DMSO: 47.4 ± 4.5, U0125: 47.2 ± 3.7, p = 0.92; n = 3) (Fig. 4A,Bii). U0126, but not U0125, increased dR/R0 (%) between third and sixth seconds of electrical stimulation (Fig. 4A,Biii). These data show that inhibition of Erk1/2 phosphorylation enhances calcium influx not only in the axons but also in the soma.
Figure 4.

U0126 increases calcium influx in soma during electrical stimulation. A, U0126. B, U0125. Ai, Bi, Experimental scheme; black vertical bars indicate times of imaging. Aii, Bii, [FRET ratio]4–6 from individual cells; lines connect data points for the same cell. Aiii, Biii, Dynamics of dR/R0 (%) before (0–6 s), during (6–12 s), and after (12–23 s) stimulation. Data points are separated by 1 s. Horizontal bar on top of the graphs show duration of electrical stimulation. Number of cells is shown in parentheses. Data are presented as means ± SEM. **p < 0.01, ***p < 0.001, compared to corresponding values obtained with DMSO.
We next examined whether U0126 increases calcium influx in axons through a particular calcium channel. We first tested whether the L-type calcium channel was involved by monitoring FRET ratio in the same cells during electrical stimulation at the end of each treatment with DMSO, L-type calcium channel blocker NIT (10 μm), NIT plus U0126, DMSO (washout), and U0126, in that order (Fig. 5Ai).
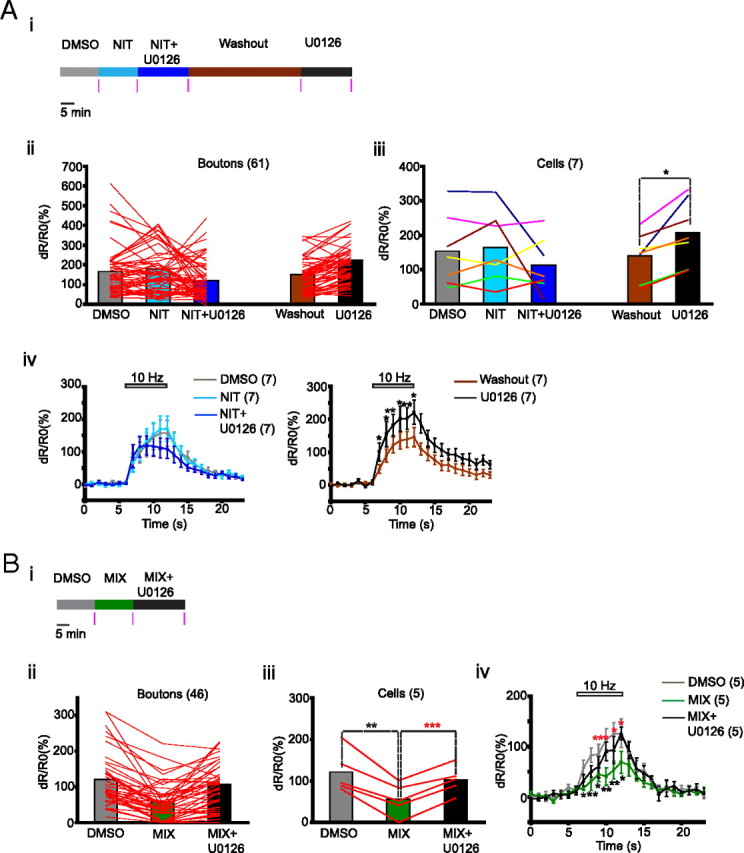
Figure 5.
U0126 increases calcium influx in axons through L-type calcium channels. A, Testing the effect of L-type calcium channel blocker NIT. B, Testing the effect of N, P/Q, and R type calcium channel blockers MIX. Ai, Bi, Experimental scheme for drug treatment. Pink vertical bars indicate times of imaging. Aii–Biii, Lines connect [FRET ratio]4–6 from individual boutons (Aii, Bii) and averages for individual cells (Aiii, Biii). Colors of lines represent individual cells (Aiii). Aiv, Biv, Dynamics of dR/R0 (%) before (0–6 s), during (6 – 12 s), and after (12 – 23 s) stimulation. Data points are separated by 1 s. Horizontal bars on top of the graphs show duration of electrical stimulation. Number of cells/boutons is shown in parentheses. Data are presented as means ± SEM. *p < 0.05, **p < 0.01 (black asterisks), compared to corresponding values obtained with DMSO. *p < 0.05, ***p < 0.001 (red asterisks), compared to the corresponding values obtained with MIX.
When compared with DMSO treatment, NIT alone did not alter [FRET ratio]4–6 significantly (DMSO: 153.6 ± 39.5, NIT: 164.1 ± 38.8, p = 0.51; n = 7) but prevented the enhancing effect of U0126 (NIT + U0126: 113.3 ± 30, NIT + U0126 vs NIT: p = 0.27; n = 7 cells). This effect of NIT was reversible; following a 45 min washout, retreatment with U0126 increased [FRET ratio]4–6 by 49% (washout: 139.9 ± 25.9, U0126 = 208.5 ± 35.6, p = 0.01; n = 7) (Fig. 5Aii,iii). NIT alone or NIT plus U0126 did not alter dR/R0 (%) significantly at any time point during stimulation, whereas U0126 enhanced it after NIT plus U0126 washout (Fig. 5Aiv). Although there was no change in the mean [FRET ratio]4–6 after treatment with NIT or NIT plus U0126, the effects of these treatments were heterogeneous at the level of both boutons and cells (Fig. 5Aii,iii). In two of the seven cells tested, U0126 treatment in the presence of NIT led to a dramatic reduction in [FRET ratio]4–6 (Fig. 5Aiii). This was not caused by death because U0126 treatment after NIT plus U0126 washout enhanced [FRET ratio]4–6 in the same cells, also suggesting that Erk1/2 can play a dual role in calcium influx.
We used a mixture (MIX) of ω-agatoxin-IVA (0.5 μm), ω-conotoxin-GVIA (1 μm), and NiCl2 (10 μm) that blocks N, P/Q, and R channels to test whether the effect of U0126 was also dependent on these channels. We determined FRET ratio in the same cells during stimulation at the end of 15 min treatments with DMSO and MIX and after a 20 min treatment with MIX plus U0126 (Fig. 5Bi). MIX reduced the [FRET ratio]4–6 to 45% of the value obtained with DMSO (DMSO: 122 ± 23.1, MIX = 55.5 ± 17.5, p = 0.004; n = 5). Treatment with U0126 in the presence of MIX increased [FRET ratio]4–6 by 85% (MIX plus U0126: 103.1 ± 14.9, MIX plus U0126 vs MIX, p < 0.001; n = 5) (Fig. 5Bii,Biii). Exposure to MIX significantly reduced dR/R0 (%) at all time points during stimulation, whereas U0126 increased these values even in the presence of the MIX (Fig. 5Biv). These results suggest that U0126 increases calcium influx by acting through the L-type calcium channels independently of N, P/Q, and R-type calcium channels.
To determine whether the increase of calcium influx through L-type calcium channels and the increase of exocytosis caused by U0126 are related, we tested the effect of NIT on U0126-mediated enhancement of synaptopHluorin response. The experimental scheme was similar to that used to study the effect of NIT on calcium influx (Fig. 6i). NIT did not change dF at the sixth second of stimulation when compared with DMSO treatment. (DMSO: 147.7 ± 30.1, NIT: 152.6 ± 29.7, p = 0.69; n = 4), However, it blocked U0126-mediated enhancement of dF (NIT plus U0126: 131.4 ± 0.1, NIT plus U0126 vs NIT, p = 0.46; n = 4) (Fig. 6ii,iii). After a 45 min washout of NIT plus U0126, dF at the sixth second of stimulation was 113.7 ± 19.1 and treatment with U0126 increased it to 167.2 ± 33.2 (p = 0.04; n = 4) (Fig. 6ii,iii). NIT alone or the NIT plus U0126 combination did not alter dF at any time point during stimulation compared to the corresponding time points with DMSO, whereas in the absence of NIT (washout), U0126 increased dF (Fig. 6iv). These findings suggest that inhibition of Erk1/2 phosphorylation increases calcium influx through L-type calcium channels, thereby enhancing synaptic vesicle exocytosis.
U0126 enhances surface fraction of L-type calcium channels
To determine whether U0126 potentiated pre-existing L-type calcium channels or recruited new channels, we used an “agonist” of the L-type calcium channel, Bay K8644, that prolongs opening time of the existing L-type calcium channels and examined its effect on calcium influx in the absence and presence of U0126 (Fig. 7A–Bi). BayK8644 (10 μm) did not alter [FRET ratio]4–6 in the absence of U0126 (DMSO: 105.2 ± 7.7, BayK8644: 103.1 ± 14.4, p = 0.83; n = 4) (Fig. 7Aii,Aiii) or dR/R0 (%) at any time point during stimulation (Fig. 7Aiv) but increased [FRET ratio]4–6 significantly in the presence of U0126 (U0126:161.2 ± 33.2, U0126 + BayK8644: 208.2 ± 39, p = 0.02; n = 4) (Fig. 7Bii,Biii). In the presence of U0126, BayK8644 significantly increased dR/R0 (%) at half of the time points during stimulation (Fig. 7Biv). These results suggest that U0126 introduced new L-type calcium channels whose presence was then revealed by BayK8644.
Figure 7.

U0126 enables BayK8644-mediated enhancement of calcium influx in axons. A, Testing the effect of BayK8644. B,Testing the effect of BayK8644 in the presence of U0126. Ai, Bi, Experimental scheme for drug treatment. Pink vertical bars indicate times of imaging. Aii–Biii, Lines connect [FRET ratio]4–6 for individual boutons (Aii, Bii) and averaged values for individual cells (Aiii, Bii). Aiv, Biv, Dynamics of dR/R0 (%) before (0–6 s), during (6–12 s), and after (12–23 s) stimulation. Data points are separated by 1 s. Horizontal bar on top of the graphs show duration of electrical stimulation. Number of cells/boutons is shown in parentheses. Data are presented as means ± SEM; *p < 0.05, **p < 0.01 (black asterisks), compared to corresponding values obtained with DMSO. *p < 0.05, **p < 0.01 (red asterisks), compared to the corresponding values obtained with U0126.
To examine whether U0126 alters surface expression of L-type calcium channels, we expressed Cav1.2 fused to YFP at its intracellular domain and HA at the extracellular domain (YH-Cav1.2) (Green et al., 2007). The neurons expressing YH-Cav1.2 were immunostained with antibody against HA. and the immunofluorescence was quantified along with the YFP fluorescence. In nonpermeabilized neurons the HA signal represented surface YH-Cav1.2, whereas the YFP fluorescence represented total YH-Cav1.2 (Fig. 8i). In permeabilized neurons, both the HA and YFP signals were found throughout the cytoplasm (Fig. 8ii). The coefficient of linear regression obtained by comparing HA and YFP signals from the permeabilized neurons was 2.8 for both DMSO and U0126-treated cells (Fig. 8iii). This value was used to calculate the surface fraction of YH-Cav1.2 in nonpermeabilized neurons (described in Materials and Methods).
Figure 8.

Estimating surface fraction of L-type calcium channels. i, ii, Top: Example HA antibody staining (left) and YFP fluorescence (middle) from nonpermeabilized (i) or permeabilized (ii) neurons expressing YH-Cav1.2. Merged images are shown on the right. Bottom, Corresponding line scan (yellow line in top panel) profiles. iii, Linear regression of relationship between HA and YFP fluorescence.
YH-Cav1.2 was also found in the axons, but the amounts were not sufficient for quantification of the surface expression (data not shown) so we quantified it in the soma, where U0126 had the same effect on calcium influx as in the axons. Cells treated with U0126 showed 25% higher surface fraction than DMSO-treated controls (DMSO: 0.43 ± 0.02, n = 30; U0126: 0.55 ± 0.03, n = 31; p = 0.006, unpaired t test), suggesting that the inhibition of Erk1/2 phosphorylation enhances surface expression of L-type calcium channels.
Discussion
We report that Erk1/2 inhibition enhances synaptic vesicle exocytosis by increased calcium influx through newly surface-recruited L-type calcium channels. We show that a MEK inhibitor decreases the time constant of exocytosis by ∼2-fold without changing the level of endocytosis during electrical stimulation. Two of our observations suggest that this increase was not caused by a change in vesicle pool sizes. First, the synaptopHluorin response at saturation, after a 90 s electrical stimulation in the presence of bafilomycin, was not altered by the MEK inhibitor treatment. This suggests that the total recycling pool was not altered. Second, MEK inhibitor did not affect sucrose-evoked exocytosis, indicating that it did not change size of the readily releasable pool.
The presynaptic role of Erk1/2 has been studied by activating the Erk1/2 signaling pathway with growth factors, expression of constitutively active Ras, and activation of presynaptic AMPA receptors (Jovanovic et al., 2000; Kushner et al., 2005; Schenk et al., 2005). These studies found that Erk1/2 activation enhances neurotransmitter release. In contrast, a recent work using hippocampal slices suggested that inhibition of Erk1/2 enhances post-tetanic potentiation following a 50 Hz stimulation in mossy fiber–CA3 synapses (Vara et al., 2009). Consistently, we also found that the inhibition of Erk1/2 enhanced the rate of synaptic vesicle exocytosis. These observations suggest that different exogenous stimuli may recruit different pools of Erk1/2 that have opposite effects on neurotransmitter release.
The effect of MEK inhibitor on exocytosis appears to result from an enhancement of calcium influx via L-type calcium channels because U0126 had no effect on exocytosis or calcium influx when L-type calcium channels were blocked with NIT. Furthermore, in two cells the effect of U0126 on calcium influx even became inhibitory in the presence of NIT, suggesting that in some cells Erk1/2 may enhance calcium influx through non-L-type calcium channels while inhibiting influx through L-type calcium channels. Indeed, when N and P/Q channels were blocked, the enhancing effect of U0126 on calcium influx appeared stronger than the effect obtained in the absence of these blockers.
L-type calcium channels are found predominantly in dendrites (Tippens et al., 2008), and we could not detect endogenous Cav1.2 in axons using light microscopy (data not shown) although it was detected in axons using electron microscopy (Tippens et al., 2008). L-type calcium channels do not contribute to synaptic transmission at the basal state (Kamiya et al., 1988; Edmonds et al., 1990; Takahashi and Momiyama, 1993; Wheeler et al., 1994; Dunlap et al., 1995) but participate in transmission following plastic changes and learning (Magee and Johnston, 1997; Shinnick-Gallagher et al., 2003; Seoane et al., 2009). Consistent with these studies, we found that the L-type calcium channel antagonist or agonist did not alter calcium influx or synaptopHluorin response under control conditions but had strong effects in the presence of MEK inhibitor. Yet, we cannot rule out the possibility that axons at the basal state contain small amounts of functional L-type calcium channels that are not detected by our techniques. The fact that contribution of L-type calcium channels in neurotransmitter release cannot be detected under basal conditions is not surprising, because L-type calcium channels do not interact directly with presynaptic machinery while N and P/Q type calcium channels interact with it through their synprint site (Spafford and Zamponi, 2003). Hence, L-type calcium channels may regulate neurotransmitter release only upon activation of second messenger signals. One possibility is that the calcium influx through L-type calcium channels modulates phosphorylation of synapsins, which are required for the U0126-mediated enhancement of post-tetanic potentiation (Vara et al., 2009).
The engagement of L-type calcium channels in exocytosis following inhibition of Erk1/2 appears to result from an increase in the surface expression of the channel, which we observed in the soma using immunofluorescence. We could not use the same technique in the axons, where expression of the channel was very low. However, our experiments with BayK8644 revealed the emergence of L-type calcium channel-dependent calcium influx in axons upon inhibition of Erk1/2, suggesting that the increase in the channel surface expression occurs in axons as well. Yet, alternate regulatory mechanisms, such as change in the channel properties, remain a possibility.
Apart from the tumor suppressor protein eIF3e, which promotes internalization of L-type calcium channels during neuronal activity (Green et al., 2007), very little is known about molecules that regulate their surface expression in neurons (Varela and Zamponi, 2007). Our present findings suggest that Erk1/2 regulate surface expression of these channels, and one plausible mechanism would be their direct phosphorylation by Erk1/2. All the subunits of mouse L-type calcium channels contain numerous putative Erk1/2 phosphorylation sites. One such site in the α-subunit of Cav1.2 is a part of the eIF3e binding domain, which is involved in Cav1.2 internalization (Green et al., 2007). Another site on the β-subunit is located in its α-subunit binding pocket, which interacts with the domain I-II linker of the α-subunit (Martin et al., 2006). This interaction between the two subunits protects the α-subunit from proteosomal degradation and thereby increases its surface expression (Altier et al., 2011). It remains to be determined whether these or other putative Erk1/2 phosphorylation sites regulate surface expression of L-type calcium channels. Besides directly phosphorylating L-type calcium channels, Erk1/2 may regulate their surface expression indirectly by phosphorylating other molecules.
L-type calcium channels are involved in synaptic plasticity in hippocampus (Zakharenko et al., 2001, 2003). They are recruited during fear learning (Shinnick-Gallagher et al., 2003) and underlie synaptic plasticity in the cortico-amygdala pathway in which LTP is accompanied by an increase in L-type calcium channel contribution in neurotransmitter release (Fourcaudot et al., 2009). Our results suggest that, Erk1/2, which act as a converging point for many signaling pathways, can influence synaptic plasticity through a novel mechanism involving L-type calcium channels.
Footnotes
This work was supported by National Institute of Mental Health intramural research program. Cell culture and imaging were performed at the Microscopy and Imaging Core (National Institute of Child Health and Human Development, National Institutes of Health) with the help of Dr. Vincent Schram, Chip Dye, Lynne Holtzclaw, and Dr. James T. Russell and at the Light Imaging Facility (National Institute of Neurological Disorders and Stroke, National Institutes of Health) with the help of Dr. Carolyn Smith.
References
- Altier et al., 2011.Altier C, Garcia-Caballero A, Simms B, You H, Chen L, Walcher J, Tedford HW, Hermosilla T, Zamponi GW. The Cavβ subunit prevents RFP2-mediated ubiquitination and proteasomal degradation of L-type channels. Nat Neurosci. 2011;14:173–180. doi: 10.1038/nn.2712. [DOI] [PubMed] [Google Scholar]
- Duncia et al., 1998.Duncia JV, Santella JB, 3rd, Higley CA, Pitts WJ, Wityak J, Frietze WE, Rankin FW, Sun JH, Earl RA, Tabaka AC, Teleha CA, Blom KF, Favata MF, Manos EJ, Daulerio AJ, Stradley DA, Horiuchi K, Copeland RA, Scherle PA, Trzaskos JM, et al. MEK inhibitors: the chemistry and biological activity of U0126, its analogs, and cyclization products. Bioorg Med Chem Lett. 1998;8:2839–2844. doi: 10.1016/s0960-894x(98)00522-8. [DOI] [PubMed] [Google Scholar]
- Dunlap et al., 1995.Dunlap K, Luebke JI, Turner TJ. Exocytotic Ca2+ channels in mammalian central neurons. Trends Neurosci. 1995;18:89–98. [PubMed] [Google Scholar]
- Edmonds et al., 1990.Edmonds B, Klein M, Dale N, Kandel ER. Contributions of two types of calcium channels to synaptic transmission and plasticity. Science. 1990;250:1142–1147. doi: 10.1126/science.2174573. [DOI] [PubMed] [Google Scholar]
- Favata et al., 1998.Favata MF, Horiuchi KY, Manos EJ, Daulerio AJ, Stradley DA, Feeser WS, Van Dyk DE, Pitts WJ, Earl RA, Hobbs F, Copeland RA, Magolda RL, Scherle PA, Trzaskos JM. Identification of a novel inhibitor of mitogen-activated protein kinase kinase. J Biol Chem. 1998;273:18623–18632. doi: 10.1074/jbc.273.29.18623. [DOI] [PubMed] [Google Scholar]
- Fourcaudot et al., 2009.Fourcaudot E, Gambino F, Casassus G, Poulain B, Humeau Y, Lüthi A. L-type voltage-dependent Ca(2+) channels mediate expression of presynaptic LTP in amygdala. Nat Neurosci. 2009;12:1093–1095. doi: 10.1038/nn.2378. [DOI] [PubMed] [Google Scholar]
- Green et al., 2007.Green EM, Barrett CF, Bultynck G, Shamah SM, Dolmetsch RE. The tumor suppressor eIF3e mediates calcium-dependent internalization of the L-type calcium channel CaV1.2. Neuron. 2007;55:615–632. doi: 10.1016/j.neuron.2007.07.024. [DOI] [PMC free article] [PubMed] [Google Scholar]
- Heim et al., 2007.Heim N, Garaschuk O, Friedrich MW, Mank M, Milos RI, Kovalchuk Y, Konnerth A, Griesbeck O. Improved calcium imaging in transgenic mice expressing a troponin C-based biosensor. Nat Methods. 2007;4:127–129. doi: 10.1038/nmeth1009. [DOI] [PubMed] [Google Scholar]
- Holmgaard et al., 2009.Holmgaard K, Jensen K, Lambert JD. Imaging of Ca2+ responses mediated by presynaptic L-type channels on GABAergic boutons of cultured hippocampal neurons. Brain Res. 2009;1249:79–90. doi: 10.1016/j.brainres.2008.10.033. [DOI] [PubMed] [Google Scholar]
- Jensen and Mody, 2001.Jensen K, Mody I. L-type Ca2+ channel-mediated short-term plasticity of GABAergic synapses. Nat Neurosci. 2001;4:975–976. doi: 10.1038/nn722. [DOI] [PubMed] [Google Scholar]
- Jovanovic et al., 2000.Jovanovic JN, Czernik AJ, Fienberg AA, Greengard P, Sihra TS. Synapsins as mediators of BDNF-enhanced neurotransmitter release. Nat Neurosci. 2000;3:323–329. doi: 10.1038/73888. [DOI] [PubMed] [Google Scholar]
- Kamiya et al., 1988.Kamiya H, Sawada S, Yamamoto C. Synthetic omega-conotoxin blocks synaptic transmission in the hippocampus in vitro. Neurosci Lett. 1988;91:84–88. doi: 10.1016/0304-3940(88)90253-4. [DOI] [PubMed] [Google Scholar]
- Kim and Ryan, 2009.Kim SH, Ryan TA. Synaptic vesicle recycling at CNS snapses without AP-2. J Neurosci. 2009;29:3865–3874. doi: 10.1523/JNEUROSCI.5639-08.2009. [DOI] [PMC free article] [PubMed] [Google Scholar]
- Kirischuk and Grantyn, 2002.Kirischuk S, Grantyn R. Inter-bouton variability of synaptic strength correlates with heterogeneity of presynaptic Ca(2+) signals. J Neurophysiol. 2002;88:2172–2176. doi: 10.1152/jn.2002.88.4.2172. [DOI] [PubMed] [Google Scholar]
- Kushner et al., 2005.Kushner SA, Elgersma Y, Murphy GG, Jaarsma D, van Woerden GM, Hojjati MR, Cui Y, LeBoutillier JC, Marrone DF, Choi ES, De Zeeuw CI, Petit TL, Pozzo-Miller L, Silva AJ. Modulation of presynaptic plasticity and learning by the H-ras/extracellular signal-regulated kinase/synapsin I signaling pathway. J Neurosci. 2005;25:9721–9734. doi: 10.1523/JNEUROSCI.2836-05.2005. [DOI] [PMC free article] [PubMed] [Google Scholar]
- Magee and Johnston, 1997.Magee JC, Johnston D. A synaptically controlled, associative signal for Hebbian plasticity in hippocampal neurons. Science. 1997;275:209–213. doi: 10.1126/science.275.5297.209. [DOI] [PubMed] [Google Scholar]
- Mani et al., 2007.Mani M, Lee SY, Lucast L, Cremona O, Di Paolo G, De Camilli P, Ryan TA. The dual phosphatase activity of synaptojanin1 is required for both efficient synaptic vesicle endocytosis and reavailability at nerve terminals. Neuron. 2007;56:1004–1018. doi: 10.1016/j.neuron.2007.10.032. [DOI] [PMC free article] [PubMed] [Google Scholar]
- Mank et al., 2008.Mank M, Santos AF, Direnberger S, Mrsic-Flogel TD, Hofer SB, Stein V, Hendel T, Reiff DF, Levelt C, Borst A, Bonhoeffer T, Hübener M, Griesbeck O. A genetically encoded calcium indicator for chronic in vivo two-photon imaging. Nat Methods. 2008;5:805–811. doi: 10.1038/nmeth.1243. [DOI] [PMC free article] [PubMed] [Google Scholar]
- Martin et al., 2006.Martin SW, Butcher AJ, Berrow NS, Richards MW, Paddon RE, Turner DJ, Dolphin AC, Sihra TS, Fitzgerald EM. Phosphorylation sites on calcium channel alpha1 and beta subunits regulate ERK-dependent modulation of neuronal N-type calcium channels. Cell Calcium. 2006;39:275–292. doi: 10.1016/j.ceca.2005.11.002. [DOI] [PubMed] [Google Scholar]
- Miesenböck et al., 1998.Miesenböck G, De Angelis DA, Rothman JE. Visualizing secretion and synaptic transmission with pH-sensitive green fluorescent proteins. Nature. 1998;394:192–195. doi: 10.1038/28190. [DOI] [PubMed] [Google Scholar]
- Moulder et al., 2007.Moulder KL, Jiang X, Taylor AA, Shin W, Gillis KD, Mennerick S. Vesicle pool heterogeneity at hippocampal glutamate and GABA synapses. J Neurosci. 2007;27:9846–9854. doi: 10.1523/JNEUROSCI.2803-07.2007. [DOI] [PMC free article] [PubMed] [Google Scholar]
- Nicholson-Tomishima and Ryan, 2004.Nicholson-Tomishima K, Ryan TA. Kinetic efficiency of endocytosis at mammalian CNS synapses requires synaptotagmin I. Proc Natl Acad Sci U S A. 2004;101:16648–16652. doi: 10.1073/pnas.0406968101. [DOI] [PMC free article] [PubMed] [Google Scholar]
- Reuter, 1995.Reuter H. Measurements of exocytosis from single presynaptic nerve terminals reveal heterogeneous inhibition by Ca(2+)-channel blockers. Neuron. 1995;14:773–779. doi: 10.1016/0896-6273(95)90221-x. [DOI] [PubMed] [Google Scholar]
- Rosenmund and Stevens, 1996.Rosenmund C, Stevens CF. Definition of the readily releasable pool of vesicles at hippocampal synapses. Neuron. 1996;16:1197–1207. doi: 10.1016/s0896-6273(00)80146-4. [DOI] [PubMed] [Google Scholar]
- Sankaranarayanan and Ryan, 2000.Sankaranarayanan S, Ryan TA. Real-time measurements of vesicle-SNARE recycling in synapses of the central nervous system. Nat Cell Biol. 2000;2:197–204. doi: 10.1038/35008615. [DOI] [PubMed] [Google Scholar]
- Sankaranarayanan and Ryan, 2001.Sankaranarayanan S, Ryan TA. Calcium accelerates endocytosis of vSNAREs at hippocampal synapses. Nat Neurosci. 2001;4:129–136. doi: 10.1038/83949. [DOI] [PubMed] [Google Scholar]
- Schenk et al., 2005.Schenk U, Menna E, Kim T, Passafaro M, Chang S, De Camilli P, Matteoli M. A novel pathway for presynaptic mitogen-activated kinase activation via AMPA receptors. J Neurosci. 2005;25:1654–1663. doi: 10.1523/JNEUROSCI.3074-04.2005. [DOI] [PMC free article] [PubMed] [Google Scholar]
- Schmitz and Witkovsky, 1997.Schmitz Y, Witkovsky P. Dependence of photoreceptor glutamate release on a dihydropyridine-sensitive calcium channel. Neuroscience. 1997;78:1209–1216. doi: 10.1016/s0306-4522(96)00678-1. [DOI] [PubMed] [Google Scholar]
- Seoane et al., 2009.Seoane A, Massey PV, Keen H, Bashir ZI, Brown MW. L-type voltage-dependent calcium channel antagonists impair perirhinal long-term recognition memory and plasticity processes. J Neurosci. 2009;29:9534–9544. doi: 10.1523/JNEUROSCI.5199-08.2009. [DOI] [PMC free article] [PubMed] [Google Scholar]
- Shinnick-Gallagher et al., 2003.Shinnick-Gallagher P, McKernan MG, Xie J, Zinebi F. L-type voltage-gated calcium channels are involved in the in vivo and in vitro expression of fear conditioning. Ann NY Acad Sci. 2003;985:135–149. doi: 10.1111/j.1749-6632.2003.tb07078.x. [DOI] [PubMed] [Google Scholar]
- Spafford and Zamponi, 2003.Spafford JD, Zamponi GW. Functional interactions between presynaptic calcium channels and the neurotransmitter release machinery. Curr Opin Neurobiol. 2003;13:308–314. doi: 10.1016/s0959-4388(03)00061-8. [DOI] [PubMed] [Google Scholar]
- Takahashi and Momiyama, 1993.Takahashi T, Momiyama A. Different types of calcium channels mediate central synaptic transmission. Nature. 1993;366:156–158. doi: 10.1038/366156a0. [DOI] [PubMed] [Google Scholar]
- Tippens et al., 2008.Tippens AL, Pare JF, Langwieser N, Moosmang S, Milner TA, Smith Y, Lee A. Ultrastructural evidence for pre- and postsynaptic localization of Cav1.2 L-type Ca2+ channels in the rat hippocampus. J Comp Neurol. 2008;506:569–583. doi: 10.1002/cne.21567. [DOI] [PubMed] [Google Scholar]
- Vara et al., 2009.Vara H, Onofri F, Benfenati F, Sassoè-Pognetto M, Giustetto M. ERK activation in axonal varicosities modulates presynaptic plasticity in the CA3 region of the hippocampus through synapsin I. Proc Natl Acad Sci U S A. 2009;106:9872–9877. doi: 10.1073/pnas.0900077106. [DOI] [PMC free article] [PubMed] [Google Scholar]
- Varela and Zamponi, 2007.Varela D, Zamponi GW. Use ′em and lose ′em-activity-induced removal of calcium channels from the plasma membrane. Neuron. 2007;55:539–541. doi: 10.1016/j.neuron.2007.07.033. [DOI] [PubMed] [Google Scholar]
- Wheeler et al., 1994.Wheeler DB, Randall A, Tsien RW. Roles of N-type and Q-type Ca2+ channels in supporting hippocampal synaptic transmission. Science. 1994;264:107–111. doi: 10.1126/science.7832825. [DOI] [PubMed] [Google Scholar]
- Zakharenko et al., 2001.Zakharenko SS, Zablow L, Siegelbaum SA. Visualization of changes in presynaptic function during long-term synaptic plasticity. Nat Neurosci. 2001;4:711–717. doi: 10.1038/89498. [DOI] [PubMed] [Google Scholar]
- Zakharenko et al., 2003.Zakharenko SS, Patterson SL, Dragatsis I, Zeitlin SO, Siegelbaum SA, Kandel ER, Morozov A. Presynaptic BDNF required for a presynaptic but not postsynaptic component of LTP at hippocampal CA1-CA3 synapses. Neuron. 2003;39:975–990. doi: 10.1016/s0896-6273(03)00543-9. [DOI] [PubMed] [Google Scholar]
- Zhang et al., 1999.Zhang SY, Robertson D, Yates G, Everett A. Role of L-type Ca(2+) channels in transmitter release from mammalian inner hair cells I. Gross sound-evoked potentials. J Neurophysiol. 1999;82:3307–3315. doi: 10.1152/jn.1999.82.6.3307. [DOI] [PubMed] [Google Scholar]