Introduction
Light microscopy is an essential tool for many biologists: research in molecular and cell biology, molecular biophysics, and histology all require the use of optical microscopes. The development of synthetic fluorescent stains and genetically-encoded fluorescent tags has permitted specific biomolecules to be labeled, thus enabling the researcher to observe molecular locations in a cell, whether it is living or fixed. Fluorescence microscopy has also enabled the observation of single molecules for biophysical observations. In clinical as well as research settings, bright-field and fluorescence microscopy are standard techniques for the examination of slices of multicellular tissues.
For decades, control of optical microscopes was a laborious process involving manipulation of many hardware components. Historically, images were first recorded using hand drawings and later on film. The development of digital cameras, along with computer control of other microscope components, has drastically increased ease of use and expanded the possibilities for researchers. Computerized control of motorized shutters, filter wheels, and other devices now permits users to precisely and repeatedly control the color, intensity, and duration of illumination light impinging on a sample. Motorized Z-stages enable automated focusing and rapid acquisition of image planes along the optical axis. Motorized XY-stages are essential to high-throughput imaging, where the researcher can obtain images from many fields or wells in a multi-well plate. Digital cameras allow the researcher to acquire huge numbers of images, each precisely quantifying photon flux at every pixel location. Digital image storage and processing give users the opportunity to save, annotate, and analyze these large image collections.
Obviously, software is needed to orchestrate the actions of all these microscope components, and the importance of microscope control software in microscopy-based research and diagnostics is ever increasing. The software should have an easy-to-use interface that works well with the most common imaging modalities. It should work with all microscope hardware available, and its functionality should be easily expanded to enable novel microscope imaging approaches. A number of commercial microscope control software applications are available [[FOOTNOTE: Other software packages include IPLab (BD Biosciences), LabView (National Instruments), MetaMorph (Molecular Devices), Nikon NIS Elements, Olympus SlideBook, Openlab (PerkinElmer), QED Imaging (Media cybernetics), Simple PCI (Hamamatsu), Volocity (PerkinElmer) and Zeiss AxioVision.]], but these are specific to a small range of instruments or have limited customizability. National Instruments’ LabView, a generic instrumentation software package, is highly customizable, but requires substantial programming for users setting up a new microscope system.
Since 2005, several members of Ron Vale’s laboratory at UCSF, with the assistance of contributors worldwide, have been developing μManager: a free, open-source software package for controlling automated microscope equipment. μManager offers a universal standard for computer control of microscopes, cameras, stages, and other peripheral equipment from a diverse set of manufacturers, and runs on Windows, Mac, and Linux computer systems. The application includes an easy to use, window-based graphical user interface (GUI) for everyday microscope users, but also offers advanced tools for customization. To easily combine acquisition with analysis, μManager is designed as a plugin for ImageJ (http://rsbweb.nih.gov/ij/), a free and open source image analysis program (written by Wayne Rasband) that is used by many biologists. Because μManager supports a wide range of hardware, it is possible for researchers to combine devices of different brands and control them together on a single microscope system. [[FOOTNOTE: μManager currently supports various motorized microscopes (Leica, Nikon, Olympus, Zeiss), cameras (ABS, Andor, Apogee, Diagnostic, IIDC Firewire, Hamamatsu, Photometrics, PCO, Stanford Photonics, QImaging, Scion, Sensicam, TWAIN), stages (ASI, Ludl, Märzhäuser, Mad City, Physik Instrumente, Prior), shutters, filter wheels, and illuminators (ASI, Cobolt, Coherent, Conix, CoolLED, Ludl, Nikon, Prior, Spectral, Sutter, Thorlabs, Vincent), data acquisition boards (Arduino, DataTranslation, Heka/InstruTECH, and Velleman) and other accessories (spatial light modulators, Yokogawa confocal spinning disk units, the Pecon incubation system controller). (A full list of devices and instructions for installing and using each of them is available at http://micro-manager.org/devices.html.)]]
As well as improving the effectiveness of expert microscopists, μManager has the potential (now partly realized) to make microscopy more accessible to non-expert users. μManager’s relatively self-explanatory computer-based user interface can help to hide the complex details of microscope hardware. Users who have become familiar with μManager can easily control an unfamiliar camera, stage or microscope.
The acquisition of an image in a modern biological microscope often involves a complex sequence of steps. A typical imaging sequence might include rotating a color filter wheel, changing the intensity of a lamp, moving to a position on a specimen slide, changing the focus position, setting a camera exposure time, opening a shutter, starting the camera exposure, finishing the exposure, closing the shutter, retrieving the image from the camera, and storing the image. μManager automates such sequences to make them easily repeated and reproducible.
μManager consists of several modules: a collection of “device adapter” libraries for controlling specific hardware components, a “core” hardware control system that coordinates these devices, a window-based, graphical user interface (GUI) for everyday microscope users, a “script panel” for writing custom automated protocols, and a “plugin” mechanism for advanced microscopy applications. These modules may be accessed by programmers (and scientists who enjoy programming) through a collection of APIs (application programming interfaces). The Device API allows developers to implement device adapters for new hardware not yet supported by μManager. The Core API interface gives programmers control of all hardware via a set of commands that is the same for any device of a given type. The GUI API is a Java-based API that gives programmers the ability to modify and extend all aspects of the user interface. Both the GUI and Core APIs can be accessed by scripts in the μManager script panel, by μManager plugin code, as well as by MATLAB (a commercial numerical computing application). Additionally, the μManager core API can be accessed by the Python programming language. Because of its highly modular software architecture, it is straight-forward for outside developers to add functionality to μManager, and the current code contains contributions from at least 25 developers (outside of the μManager team) working either in industry or academia.
This paper presents a series of short protocols for using different parts of μManager. First we give instructions on how to begin using the application: how to download and install the software, and how to practice using μManager with virtual (software-simulated) equipment (no hardware needed). Then we offer example protocols for setting up custom configuration settings and presets, running a multi-dimensional acquisition, and viewing acquired images. Next is an explanation of common hardware connectors found in digital microscope equipment, followed by a description of how to use the hardware configuration wizard that connects real equipment to μManager. Finally, we give two brief tutorials for advanced users on the scripting capabilities of μManager.
Protocol: Getting started with μManager
μManager will run on nearly any computer running Windows (XP and later, 32-bit only at present), Mac OS X (10.4 and later, PPC and Intel processors, the latter at both 32 and 64 bits), or Ubuntu/Debian Linux (it can be compiled for other Linux distributions as well). Make sure that your microscope hardware is currently supported by μManager by checking the current list of supported devices (http://micro-manager.org/devices.html).
Download μManager from http://micro-manager.org/downloads.php. Installers are available for Windows, Mac and Ubuntu/Debian Linux. Follow the instructions that come with the μManager installer for your particular Operating System. If you wish to examine μManager image files acquired elsewhere, but you do not plan to run actual hardware or experiment with demo (virtual) equipment, then you should download the μManager Reader plugin for ImageJ.
Start μManager by using the shortcut provided by the installer. On startup, μManager shows a splash screen (Figure 1) prompting you for the configuration file to be loaded for this session. This configuration file contains information about the hardware that you have attached to the computer, as well as presets and pixel size calibration data. You will eventually need to make such a configuration file yourself (or have someone do this for you) specific for your own equipment (see “Hardware Configuration” below), but at this point choose the file “MMConfig_demo.cfg” that contains definitions for “virtual”, emulated demonstration equipment. This demo configuration makes it easy to experiment with the μManager software. At any time during a μManager session, you can load a different configuration, using the menu command: Tools -> Load Hardware Configuration….
Figure 1.
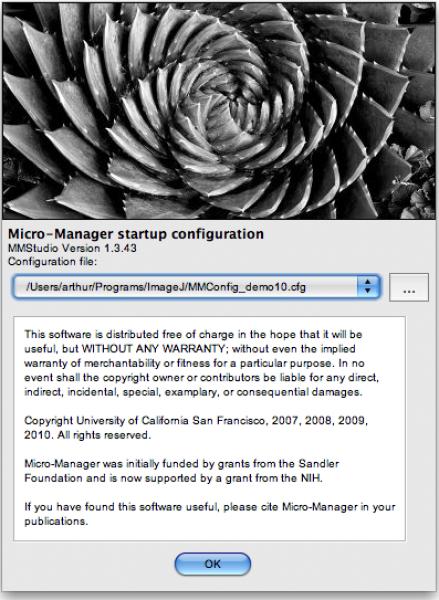
μManager’s “splash screen” window that appears when the application is started. Use this window to choose a configuration file that contains the hardware settings for your system. A drop down menu lets you select recent configuration files, and the button to its right (…) opens a file browser dialog window where you can choose a new configuration file.
Once a configuration file is loaded, you will see two windows: one is the main μManager window, the other is the main ImageJ window. Each of these windows offers its own set of menu commands. Switch between them by clicking on the respective main window. Images acquired using the Snap and Live buttons in μManager’s main window are ordinary ImageJ windows, and you can apply all of ImageJ’s image visualization and analysis tools to these images.
Protocol: Using the main window
The main μManager window (Figure 2) serves two functions: the top half lets you snap images, control the state of the microscope system and set up experiments. The bottom half of the main window shows a histogram of the last acquired image, and has tools that allow you to set contrast and brightness on the image display. The top left quadrant of the window contains controls to set the camera exposure time, binning (grouping of camera pixels before camera readout), the shutter to be used (for those systems that have multiple shutters), and whether or not the software will automatically open the shutter before a camera exposure and close it afterwords (autoshutter check box). When the autoshutter feature is turned off, toggle the state of the active shutter with the main window’s open/close button.
Figure 2.
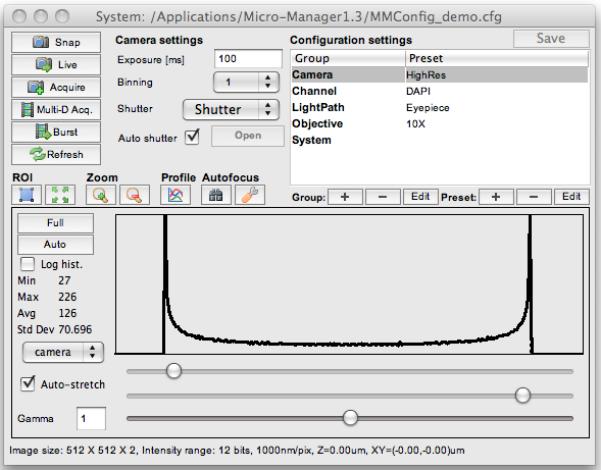
The main μManager window, where the application’s primary controls are located.
A row of icon buttons lets you set and unset regions of interest (ROIs) on the camera, zoom in and out of the image, view a live line profile, and operate autofocus (both hardware and image-based autofocus methods are available).
The Snap button will capture an image using the current settings and display it in an ImageJ window. The Live button will start continuous image acquisition from the camera (stream images) and display the incoming images in the same window. The Acquire button snaps an image and adds this to a μManager image viewer window (see section μManager Image Viewer, below). The Multi-D Acq. button opens the multi-dimensional acquisition window (see protocol below), which can be used to set up 5D imaging experiments. The Burst button enables you to initiate a high-speed image acquisition, with frame rates up to the maximum speed supported by the camera hardware.
Cameras typically have two different modes: image snapping and live streaming. When snapping an image, the sensor is exposed and accumulated charge is moved to an unexposed area of the chip and eventually converted into digital intensity values. Only after the image is completely transferred to the computer’s memory (a process that can take more than a second on some slow-scan cameras) can a new image be acquired. In streaming mode, exposure of a new image starts immediately after transfer of accumulated charge to a dark area on the chip. Exposure of the new image and transfer to the computer happen simultaneously, which increases the speed with which images can be acquired. Moreover, when the camera snaps images, it can often take some time before the actual exposure starts; such delays do not happen once a camera is streaming images. μManager uses the “snap” mode when executing multi-dimensional acquisition and the streaming mode for live imaging and burst mode.
The top right quadrant of the main window contains a user-defined table of Configuration Groups and Configuration Presets, created separately for each microscope system. These configuration settings are explained in more detail below.
To get an idea of the work flow in μManager, load the demo-configuration (or use a real camera if you have one that can be controlled by μManager) and execute the following steps:
Click the Snap button in the top left corner.
Uncheck the Auto-stretch check box in the bottom left corner. Move the three sliders below the histogram to affect the display (but not the actual pixel values) of the image. The top slider sets the pixel value that will be displayed as black, the middle slider sets the pixel value that will be shown as white, and the bottom slider will change the gamma (a parameter for adjusting contrast).
Change the exposure time to 25 ms and snap another image. Inspect the effect on pixel values (look at the histogram; you can also place the mouse cursor in the image to show the pixel value in the ImageJ window), and display intensity (try pressing the Auto and Full buttons in the histogram part of the main window).
Change the binning to “2”, snap an image, and note the change in image size, pixel intensities and display intensity.
Press the Burst button. In the “MM Fast Acquisition Plugin” window, set the sequence length to 50, set Output to Screen, and press the Start Acq button. This should result in a μManager viewer window with 50 images, acquired at the highest speed possible.
Protocol: Working with Devices, Properties, and Configuration Settings
The Device/Property Browser window (available in the Tools menu; see Figure 3) lets you examine and change the state of all hardware components of the system. Each device has a set of properties, each with a unique name. Properties may be text or numbers. Gray properties are read-only, while white properties can be changed by the user.
Figure 3.
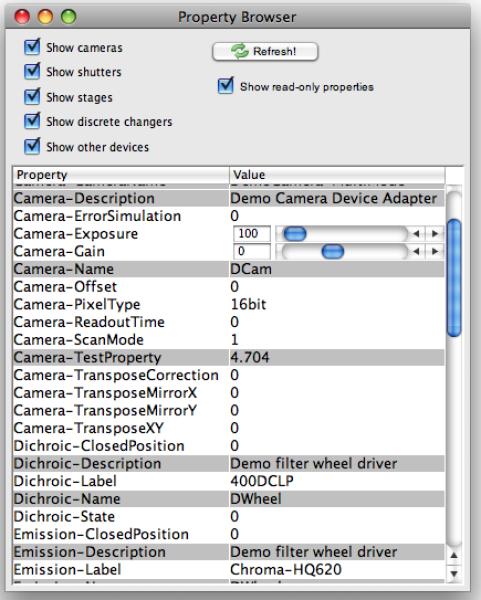
The property browser window. To reach it, choose Tools -> Device/Property Browser…. All major hardware properties and their values are included in this table.
Properties can be grouped together in Configuration Groups, which behave as a collection of simple shortcuts for the user to view and change important settings in the hardware. The following is a short protocol for creating a Configuration Group and its Presets (i.e., choices), using the demo configuration as an example. Suppose we want to set up filter sets for a FRET pair: a green emitting donor and a red-emitting acceptor. By creating presets that provide different filter and dichroic combinations, we can observe direct fluorescence from either donor and acceptor, or acquire an energy transfer image.
If you haven’t already loaded the demo configuration, select the menu Tools -> Load Hardware Configuration… and select the configuration file named MMConfig_demo.cfg.
On the Configuration Pad in the Main Window, create a new Configuration Group by pressing the “+” button next to the word Group.
The Group Editor window will open. Name the group “FRETChannel” and select the “Use in Group?” check boxes for “Dichroic-Label”, “Emission-Label”, and “Excitation-Label”.
- Next, the Preset Editor will open to let you edit the first Preset in this Group. Name the Preset “Transfer” and set the following settings:
-
○Dichroic-Label: Q505LP
-
○Emission-Label: Chroma-HQ700
-
○Excitation-Label: Chroma-D360
-
○
- Press the Preset + button and the Preset Editor opens again. This time name the Preset “QuenchedDonor” and set the following settings:
-
○Dichroic-Label: 400DCLP
-
○Emission-Label: Chroma-D460
-
○Excitation-Label: Chroma-D360
-
○
- Press the Preset + button once more, name the Preset “AcceptorDirect” and set:
-
○Dichroic-Label: Q505LP
-
○Emission-Label: Chroma-HQ700
-
○Excitation-Label: Chroma-HQ570
-
○
Thus we have created three Configuration Presets in the “FRETChannel” group: “Transfer”, “AcceptorDirect”, and “QuenchedDonor”. These presets are available in a drop-down menu in the Configuration Settings panel on the main window. Open the Device/Property Browser, choose one of the presets in the “FRETChannel” group, and then press Refresh in the Device/Property Browser to see how the relevant property values have been changed as a result. Note that you can also hover the mouse pointer over a Configuration Preset to reveal a tool-tip showing the properties set by the Preset.
Protocol: Running a Multi-Dimensional Acquisition
μManager’s Multi-Dimensional Acquisition (MDA) allows you to set up 5D (x, y, z, wavelength and time) acquisitions at multiple positions. A large number of options is offered (Figure 4), most of which should be self-explanatory. It is straightforward to set up experiments that run for days and generate many gigabytes of data, but before doing so you should familiarize yourself thoroughly with the MDA controls.
Figure 4.
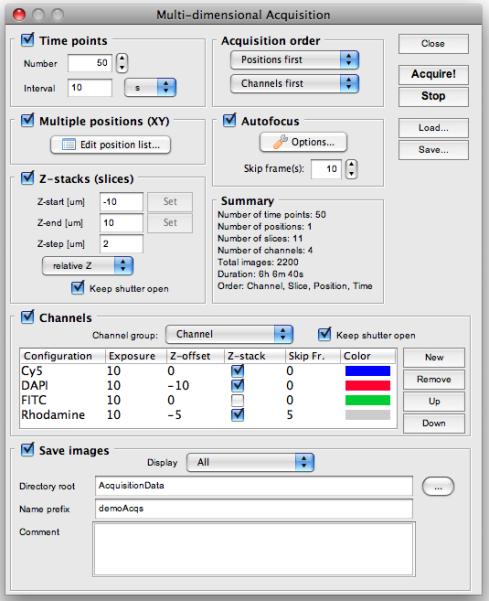
The Multi-Dimensional Acquisition window. Use the check-boxes to select which of the five dimensions you want to include in an acquisition: Time points, Multiple positions (XY), Z-stacks (slices), and Channels.
The Acquisition Order can have a profound influence on the efficiency of MDA. When executing an MDA using both z-stacks and multiple channels, you can decide whether to change channels at each z-height (Channels first as Acquisition order) or to take complete z-stacks for each channel individually (Slices first). The best choice depends on the specifics of your hardware. For example, if your hardware can switch between channels very quickly, it is likely better to use the Channels first option, whereas if channel switching is relatively slow and you have a fast and reliable z-drive, the Slices first option is preferable. When carrying out acquisition at multiple stage positions (which are marked using the Stage-position List window accessible through the Edit position list… button), you can decide to either move the stage between positions at each time point (choose Positions first as Acquisition order) or to consecutively execute the full 5D acquisition at each position (choose Time first as Acquisition order).
Channels can be selected from the Channel group, which is one of the Configuration Groups that you have previously defined. Channel definitions can include any property available on your system: most often, you will use a Channel group that defines positions of dichroic mirrors and emission and excitation filters. For each individual channel (added using the New button), you should set the exposure time as well as the color to be used to display this channel in the μManager Image Viewer.
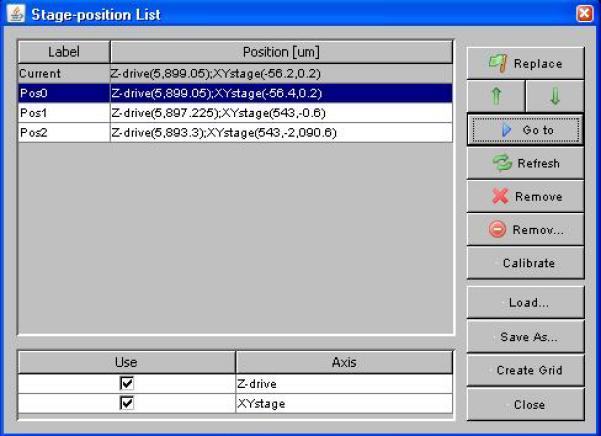
Multiple positions can be defined with the Stage-position List window (Figure 6), accessible from the menu entry Tools->XY List… and also from the Edit position list… button in the MDA window. Move your XY stage and Z-drive into the desired position using the joystick, dial or other input device and click the Mark button (when a position is selected, this button changes into a Replace button). Use the check-boxes in the bottom of the window to determine which of the stages attached to your system will be recorded. Select a recorded position and click on the Go to button to move all stages to the selected position.
Figure 6.
The Stage-position List window. Manage waypoints in 2 or 3 dimensions in the position list table. Each position can refer to one or more stage axes
To experiment with MDA acquisition, load the demo configuration, click on the Multi-D Acq. button in the main window. Use the MDA window (Figure 4) to execute the following steps:
Check the Time points check box and select 3 time points at 5-second intervals. Uncheck the Multiple positions (xy), Autofocus, and Z-stacks (slices) check boxes. Check the Channels check box. Select Channel as the Channel group. Use the New button to add a DAPI and FITC channel. Click on the Color column and select a blue color for DAPI and green for FITC. Set the exposure time to 20 msec for DAPI and 50 msec for FITC. Press Acquire to run the acquisition. Inspect the resulting acquisition window and make sure that acquisition is executed as expected.
In the MDA window, check the Z-stack (slices) check box. Choose relative Z. Set Z-start [μm] to −2, Z-end [μm] to 2 and Z-step [μm] to 0.1. Set Acquisition order to Slices first. Press Acquire. Inspect the resulting acquisition window and make sure that acquisition is executed as expected.
Change the Acquisition order to Channels first and run the acquisition again.
Protocol: Using the μManager Image Viewer
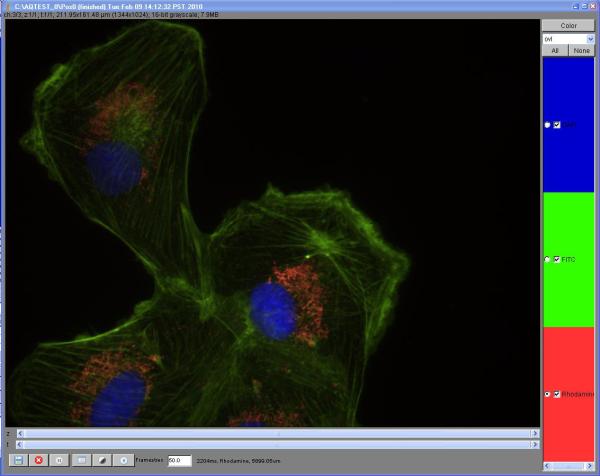
The μManager Image Viewer (Figure 5) is based on the “Image5D” plugin for ImageJ written by Joachim Walter (http://rsbweb.nih.gov/ij/plugins/image5d.html). The viewer contains scroll bars for quick navigation through z-slices (z) and time-points (t). The controls on the right hand side of the viewer will change depending on the display mode chosen. μManager defaults to overlay (ovl) mode in which the channels are shown superimposed, each channel in its own color. Each channel contains a radio button to select the active channel. ImageJ operations, such as setting brightness/contrast or applying filters, work on the channel selected with this radio button. Each channel also has a check box that provides a quick way to switch the channel display on and off. In color display mode, the channel controls on the side are replaced by a slider that selects the active channel (which is also the only one shown). The gray display mode works similarly, but displays the channel as a monochrome image.
Figure 5.
The 5D Image Viewer of μManager. Use the z and t sliders to view different slices and time points; use the boxes at the right to show and hide channels; use the buttons at bottom to save files, halt acquisition, examine metadata, adjust contrast, and play back time lapse sequences.
The controls on the bottom of the window (from left to right) serve to:
save the acquired data.
stop an ongoing acquisition.
pause an acquisition.
open the image metadata.
open the ImageJ brightness/contrast tool.
play the acquired time points as a movie.
μManager keeps track of image metadata coming from the hardware, as well as metadata you might add (such as comments or display settings). The metadata can always be accessed from the Image Viewer by pressing on the Display metadata button. For each image, the application remembers image-specific data (such as the “Channel used”, “Exposure time”, and “Slice number” under the Image tab), as well as all property values for all devices in the microscope system (under the State tab). Comments can be edited at any time (note that comments can also be added in the MDA window, before start of the acquisition). The Save button in the image metadata window (Figure 7) will save changes in the comments as well as the brightness/contrast settings of each channel (pixel data and other metadata are not affected).
Figure 7.
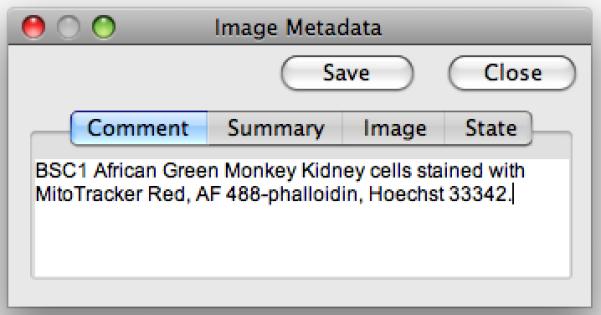
The Image Metadata window. Experimental annotations can be entered in the Comment tab.
To get started working the μManager image viewer, carry out these steps:
Acquire a 5D data set using the MDA window as described in the section on Multi-Dimensional Acquisition (above).
Press the bottom left button to save the data now displayed in the viewer window.
Toggle the check boxes for each of the channels and notice the change in the displayed image.
Select one of the channels and open the ImageJ Brightness/Contrast tool (press the 5th button from the left at the bottom row). Click Auto. Move the Minimum and Maximum slider and notice the effect on the display.
Activate the radio button in front of another channel. Go back to the Brightness/Contrast tool and adjust the now active channel.
Observe other z-slices and time points by moving the t and z sliders.
Open the metadata window (4th button from the left at the bottom row). Add some comments. Click on the other tabs and inspect the data presented (note that the Image and State data will change with the image currently displayed in the viewer). Click the Save button to save the changes you made in the comment and display settings.
Close the Image Viewer window and open the data saved on disk again using the μManager menu command: File -> Open Acquisition Data as Image5D….
ImageJ does not “see” the μManager viewer images as normal ImageJ data. You therefore need to convert the data before you can work with them in ImageJ. The μManager menu Image5D contains several tools for this purpose (duplicate, crop, make montage, Z project, copy to Stack, etc.). For instance, to make an AVI movie file of a time series as displayed in the μManager viewer, select the viewer window, choose Image5D -> Copy to RGB Stack(t) from the μManager menu, and then use the File -> Save As -> AVI… ImageJ menu command to save the file. It is also easy to convert the μManager viewer data into an ImageJ Hyperstack using the ImageJ menu command Image -> Hyperstacks -> Stacks to Hyperstack….
Protocol: Connecting and Configuring Hardware
Connecting the hardware
Before using the μManager application to control microscope equipment, you will first need to connect your hardware to your computer. There are many different types of communication interfaces between the computer and microscope hardware. Some knowledge of these interfaces is essential for configuring a microscope system. Here we describe the most commonly used interfaces and their connectors.
Serial (RS232) Interface
In serial communication, bytes are sent one at a time through a single wire. The archetypal serial interface is specified by the RS232 standard. Bits are transferred at an agreed-upon speed, called the baud rate (the μManager wiki lists what baud rate to use for each specific device). The number of bits per data unit, as well as the number of stop bits, can vary, but current equipment almost invariably uses 8 data bits and 1 stop bit. Extra wires can be used for handshaking (used to signal that the device is ready to receive or send data). These days, most RS232 cables have 9 pin connectors (DB-9). Some devices need to be connected through a null-modem cable in which the send and receive wire have been cross-linked (such cables are clearly labeled). Since modern computers generally do not include DB9 RS232 ports, you will need a USB to serial converter or an add-on (PCI) card (the latter solution is more reliable and highly favored). Although it may seem archaic, the RS232 interface is still a simple and robust method of communication between computer and device, and many newer devices conceal an RS232 interface inside a USB connection.
USB Interface
The Universal Serial Bus is a top-down serial interface that is driven by the “top” (the computer). Connections to other equipment can be made through hubs, resulting in a branched network. Sending and receiving of data is always initiated by the “top” computer. Three generations of the USB protocol exist, with data rates up to 480 Mbit/sec (USB 2.0) or even 4 Gbit/sec (USB 3.0). On most operating systems, specific drivers are needed for each device. In microscopy, the USB bus is increasingly used to send simple commands to equipment. Also, a number of cameras make use of the USB interface.
Firewire/IEEE1394
The IEEE1394 interface (commercialized as Firewire by Apple) is another high speed serial interface. Unlike USB, any device, not only the computer, can initiate communication. Many scientific-grade cameras make use of the IEEE1394 interface. However, not all those cameras use the same protocol to send data and commands through the IEEE1394 interface. A number of camera manufacturers use a standard protocol, IIDC, that is supported by μManager’s Mac and Linux versions.
CameraLink
CameraLink is a serial communication protocol for vision equipment maintained by the Automated Imaging Association (AIA). The base CameraLink implementation provides data speeds up to 2.04 GBit/second. Many scientific-grade cameras use the CameraLink interface and they are usually sold together with a matching CameraLink interface card for the computer.
TTL
Transistor-Transistor Logic (TTL) is used here to mean TTL-compatible logic levels, where 0 to 0.8V corresponds to a low (inactive) state, and 2V and higher to the high (active) state. TTL signals are used in microscope equipment to (for instance) open and close shutters, signal when a camera is exposing, trigger movement to a new stage position etc. TTL signals are usually run through coaxial cable and often use BNC connectors (alternatives are SMA and SMB connectors). Modern computers do not have direct TTL connections to outside equipment (in the past, some pins on the parallel port as well as handshaking signals on RS232 interface were used for this purpose), but several low-cost solutions exist on μManager (for instance, the Arduino board, http://arduino.cc/, can be used for TTL communications).
Analog Voltage
Some device controllers have connections that respond to an analog voltage. For instance, the position of a piezo stage can sometimes be set using a voltage differential, or the intensity of a diode laser can be controlled by an applied voltage. Analog voltages are most often transmitted using coaxial cable with BNC connectors. Computers usually do not directly expose outputs that generate voltage differentials, but many expansion boards (some of which can be connected using USB) exist that contain Digital-Analogue (DA) conversion chips that translate a digital signal into an analog voltage.
Constructing a configuration file using the Hardware configuration Wizard
Once the equipment is correctly connected to the computer and the connection tested with the manufacturer’s software tools, you are ready to make a configuration file. Before doing so, please check the instructions specific for your devices on the μManager website (http://micro-manager.org/devices.html), to find information such as the appropriate serial port settings.
Start the Hardware Configuration Wizard using the μManager menu command Tools -> Hardware Configuration Wizard…. The first page (Step 1) lets you decide whether to start a new configuration file or to continue work on an existing configuration.
Step 2 lists all serial ports available on your system. You will need to know which serial port is connected to what equipment, and you will need to know the serial port settings (especially the baud rate) needed. Identifying serial ports is often difficult, since they are often not, or only poorly, labeled. With USB-serial adapters you can start the hardware configuration wizard with and without the adapter plugged in to figure out under which name it appears.
In Step 3 of the Hardware Configuration Wizard you will add the devices in your system. Pressing the Add button opens a list of all devices that μManager supports. Find the camera, stage, microscope, shutters etc. that are connected to the computer and press the Add button. You can change the name of the device to your liking. In some cases, if it is difficult to match your equipment with names in the device list, check the documentation for your equipment and the μManager website, or try figuring it out through trial and error.
Step 4 of the wizard asks you to set pre-initialization settings for your devices. For instance, devices that communicate through a serial port will ask you here to select a port name (configured in step 2). Pressing the Next button at this point will start the initialization sequences of all devices. This is the most critical part of the configuration. When it completes, you have properly connected the computer to all devices.
In Step 5 select the default camera, shutter and focus stage. (μManager can work with multiple cameras, shutters, and focus stages, but expects one of each to be selected as default.) You may change these defaults later by changing the Core-Camera, Core-Shutter, and Core-Focus properties in the Property Browser. Also, the shutter drop-down menu in the main window directly controls the Core-Shutter property.
In Step 6, enter “delays” for equipment that aren’t designed to signal when they are busy. For example, before acquiring an image, it may be necessary for μManager to wait for a particular delay interval while a shutter opens. If you are prompted to set delays for devices, it is important to determine these delays empirically. Setting this value too high may result in long waits and useless exposures of the sample to light; setting it too low may result in images that are takes while components are still moving. Luckily, most of the newer devices can signal whether they are moving and setting delays for them is not necessary.
In Step 7, select devices to be synchronized with image capture. Before taking an image, μManager will repeatedly query the selected devices and wait until they are not “busy”. Most devices need not be synchronized; consult the website for your specific devices.
In Step 8, define labels for state devices. Click on any of the state devices listed in the left side column. Now edit the “Label” for each of the positions of the State device. In some cases, these labels are read automatically from the device. You can force μManager to read them again by pressing the Read button. Labels are intended to help the user remember what each of the positions of a state device contain.
Save the configuration in Step 9 of the wizard.
Construct appropriate Configuration Groups and Presets as described above. You can create a special Configuration Group by naming it “System”. Within the “System” group, the presets “Startup” and “Shutdown” will be applied during μManager startup and shutdown respectively, setting any included device properties to specific values. For example, a common use is to set camera exposure time in the “Startup” configuration Preset. Save the configuration file (using the Save button in the top right corner of the main window, or using the Tools -> Save Configuration Settings… menu command.
Protocol: Calibrating the Pixel Size
To measure the physical dimensions of a specimen from a digital microscope image, one needs to know the size of pixels at the specimen plane. μManager has a mechanism to store calibrated pixel size data (similar to Configuration Groups), in which each pixel size is matched to a particular set of device settings. When the state of the system matches the state described in one of your stored, calibrated pixel sizes, μManager will automatically record that pixel size in the image metadata. To enter pixel size data into μManager’s table, you will first need to decide which device settings of your system influence pixel size (usually the objective and tube-lens/optovar), and measure the pixel size using the various settings of those devices. Pixel size can be measured either by using a calibration slide or by moving the stage over a known distance (the latter method requires that the stage has been accurately calibrated).
Materials
(Optional) calibration slide, available from many suppliers. These slides typically bear a photo-etched calibration grid on one surface. Many variations exist (for instance: Electron Microscopy Sciences 68045-29); be sure that you know the distance between the center of the lines of the repeating pattern (10 μm for the EMS 68045-29).
Steps
Put the components (objectives, tube-lens, etc.) that will influence magnification to the desired position.
Obtain an image of the calibration slide. Focus on the repeating grid pattern of the calibration slide using transmitted light illumination. Direct the light to the camera and use the μManager Snap button to snap an image. Measure the center-to-center distance between the the grid lines. To do so, select the ImageJ line tool, and draw a straight line from the left side of the leftmost grid line to the left side of the rightmost grid line on the image. Read the distance in pixels in the ImageJ status line (or select Analyze -> Measure from the ImageJ menu) and count the total number of grid spacings, n, that you covered with the line. Pixel size is calculated as: (d n)/p, where d is the distance between the grid lines, and p is the length of the line in pixels.
-
An alternative method to measure pixel size does not require a calibration slide, but relies instead on the accuracy of stage movements. Press the Snap button to take an image in bright field of an object that has a clearly defined edge. Use the ImageJ Point Selection tool to mark the XY position (in pixels) of a clearly recognizable point in the image. Open the μManager script panel (Tools -> Script Panel…). In the lower right-hand panel type the following commands:
p = gui.getXYStagePosition();
gui.setXYStagePosition(p.x + 10, p.y);
Press the enter key to execute each command. Together they move the XY stage by 10 μm. Snap another image. Use the ImageJ Point Selection tool to mark the XY position (in pixels) of the same point. Calculate the distance between the old position and the new position in pixels using the Pythagorean theorem. Divide 10 μm by the distance in pixels that you calculated to get the pixel size in microns.
Select Tools -> Pixel Size Calibration… from the μManager menu. Click the New button in the Pixel Size calibration window. In the Use column, select the device properties that affect magnification (for instance: Objective-Label, TubeLens-Position), name the calibration (for instance: 10x-1.5x), and enter the pixel size that you previously determined. Press OK.
Repeat step 4 for all other combinations of settings for which you have measured pixel size.
Note that μManager is aware of the pixel size whenever the state of the microscope system matches one of the calibrated settings. The status line at the bottom of the main window will show the pixel size in nm/pixel.
Protocol: Writing and running μManager scripts
The μManager script window (Figure 8) offers the user a platform for developing automated acquisition and analysis routines, to make elaborate protocols straightforward. The window contains three sections: a table of script shortcuts, an editor for the current script, and an interactive command panel. The scripts and interactive commands employ the same scripting interface (Beanshell, a scripting language for Java, http://beanshell.org), to give the programmer access to all functionality of the hardware, the user interface, μManager plugins, and image processing analysis routines supplied by ImageJ and its plugins.
-
Three objects are immediately available in the scripting panel: mmc (the μManager Core for hardware control), gui (the graphical user interface) and acq (the acquisition engine). A full list of functions offered by each of these objects is given on the μManager website, http://micro-manager.org/documentation.php. To become familiar with the μManager scripting interface, start by typing a command in the lower-right interactive command panel. For example:
gui.snapSingleImage();
This command snaps an image from the default camera and displays it onscreen in an ImageJ window. The result is equivalent to that obtained by pressing the “Snap” button on the main window.
-
Now try controlling the camera via the core with the following two lines:
mmc.snapImage();
pix = mmc.getImage();
The first command tells the camera to acquire a new image; the second command returns an array of pixels containing the image data.
An important element of scripting is the control of properties. Each device’s table of properties and values, which is displayed in the Device/Property Browser (described above) can be read and written by two core methods. For example, type: mmc.getProperty(“Camera”,“Gain”); to obtain the current “Gain” value of the demo camera, and mmc.setProperty(“Camera”,“Gain”,“4”); to change the Gain setting.
- Other useful shortcuts include setting the stage positions. Read the current stage position:
pos = gui.getXYStagePosition();
- Now move the stage by 1 μm up and 2 μm left thus:
pos = gui.setXYStagePosition(pos.x − 1, pos.y + 2);
- To see a list of all methods and properties (with their values) for any object, use the inspect function. For example:
inspect(gui);
will give a long list of methods and the current state of many of the application’s internal variables. To create a new script, press the “New” button. To edit an existing script, click once on the script name in the shortcuts panel, or click the “Open” button to select an existing file.
Figure 8.
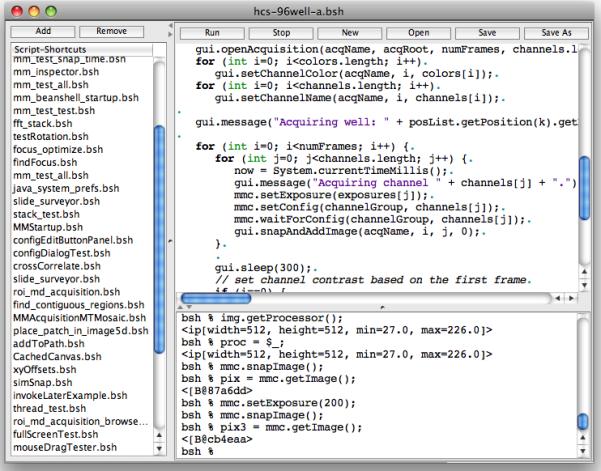
The Script Window. Scripts are written in Beanshell and allow fine-grained control of all aspects of μManager.
Protocol: Using external programming languages to control μManager
In addition to the built-in Beanshell-based scripting interface, two other programming interfaces (python and MATLAB) are available to advanced users who wish to combine image acquisition and hardware control with numerical analysis routines. MATLAB is a widely used commercial numerical analysis package, and numpy and scipy are numerical libraries for the python programming language.
Python
The python interface is a wrapper around the C++-based μManager core that provides low-level controls for the hardware, and can be used instead of the GUI. Here is how to get started with the μManager python library:
- μManager should be already installed in your computer. Additionally, install the latest versions of:
- ○
-
○scipy (http://scipy.org, optional, good for advanced image processing)
-
○matplotlib (http://matplotlib.sourceforge.net, useful for displaying images)
-
○ipython (http://ipython.scipy.org, optional, a nice interactive python environment)
-
○PIL (Python Imaging Library) (http://www.pythonware.com/products/pil/, optional, image processing and file saving)
- Start python inside the μManager directory. Enter the following commands at the prompt:
import MMCorePy
mmc = MMCorePy.CMMCore()
- The mmc object offers low-level hardware control for all hardware supported by μManager. You can load and initialize individual devices. Here is an example using the DemoCamera:
mmc.loadDevice(“cam”,“DemoCamera”,“DCam”)
mmc.initializeDevice(“cam”)
- Then snap and retrieve an image from the camera:
mmc.snapImage()
img = mmc.getImage()
- The image is stored in the img variable as a 2D numpy array (matrix). You can inspect the values in the image. For example, use the following command to list intensities in a 5×5 pixel square in the top left corner:
img[1:5,1:5]
- Display the image using the matplotlib plotting library:
from pylab import *
ion() # Activate interactive mode
figure()
imshow(img,cmap = cm.gray)
- We can proceed with image processing. For example, try rotating the image by 90 degrees:
imgr = rot90(img)
imshow(imgr,cmap = cm.gray)
MATLAB
The use of MATLAB with μManager is very similar to the python example given above, although setup is somewhat more complicated. Full instructions on using MATLAB are given on the μManager wiki, at http://micro-manager.org/matlab.html
Conclusions and Outlook
These protocols are intended to help users get started with μManager, and should make its capabilities clear. Users needing additional help with any part of the system can address their questions to the μManager mailing list, available on the website.
μManager continues to be under ongoing development to improve its usability, expand its features and increase the range of its device support. Planned enhancements to the basic application include a facility for automatic hardware configuration that will be able to detect newly connected hardware, extended support for color cameras, an improved system of error messages, a context-based help system, and a macro recorder.
As an open-source platform, μManager has the potential to bring advanced microscopy methods into mainstream research. Many new microscopy techniques (including STORM/PALM, structured illumination microscopy, fringe-based optical sectioning, photobleaching and photoactivation, single molecule tracking, high-throughput imaging, intelligent acquisition and optical tweezer methodologies) are still difficult or impossible to implement for most research labs, either because the required algorithms are complex, or because the equipment needed is too expensive. μManager’s modularity (that is, device control is separated from the application level) means that it will be possible to develop plugins for μManager that enable users to use advanced techniques on the hardware of their choice. This gives labs developing new technology a direct way of making their innovations quick available to others.
Further development of μManager device adapters will also offer opportunities for education and low-cost research. By extending our device support to inexpensive cameras, stages, and illumination systems, we can give students and researchers new capabilities.
Acknowledgements
We thank the many code contributors at various institutions and companies, as well as our beta testers and other users for making suggestions, especially the members of the Vale lab. The μManager project has been supported by a grant from the Sandler Family Supporting Foundation and NIH grant R01-EB007187 from the National Institute of Biomedical Imaging and Bioengineering (NBIB).
Internet References
- μManager website. http://micro-manager.org. The μManager website contains further documentation, download links, and links to a μManager news group through which you can obtain community support.
- ImageJ website. http://rsbweb.nih.gov/ij/ ImageJ is a public domain cross-platform application for image analysis. Hundreds of plugins extend its capabilities. μManager runs as an ImageJ plugin.
- Beanshell Documentation. http://beanshell.org Beanshell is a java-like scripting language used in the μManager script panel.


