Abstract
Viscoelasticity may affect both the elastic and fracture characteristics of bone. Nanoindentation can be used to measure the creep behavior of bone by fitting the depth vs. time data at constant load to rheological models. However, the creep data may be influenced by latent effects arising during the loading phase of indentation. As such, the loading protocol, particularly the holding time, may affect the measured creep time constants. To characterize the effect of holding time on the measures, four cortical bone samples were prepared from four bovine femora and subjected to nanoindentation to measure the creep behavior. The creep time constants were found by fitting the indentation depth vs. time curve to three different rheological models: the standard linear solid, Burgers model, and a two-dashpot Kelvin model. All three models provided good fits to the data, which were relatively insensitive to the initial parameter estimates. The calculated creep time constants increased monotonically with increasing holding time for all three models. However, the relative differences between measurements within a single osteon, within a single sample, and between samples were maintained for creep holding times over 16 s. Hence, while the creep time constants measured by nanoindentation with hold times up to 30 s may not provide accurate property measurements, comparisons between samples are valid if all are assessed at the same holding time. Considering the long-term viscosity of bone tissue, Burgers model provided the best performance in terms of stability and goodness of fit, and is recommended for future studies.
1. Introduction
Bone is a viscoelastic material, that exhibits both creep and stress relaxation (Lakes, et al., 1979). The viscoelasticity of bone has been studied at the macroscopic level with conventional mechanical testing methods, such as compression and torsion testing (Carter and Hayes, 1976, Carter and Hayes, 1977, Lakes, et al., 1979, Sasaki and Enyo, 1995). Investigations of viscoelasticity of bone at the microstructural level are less common, partly due to the limitations of sample preparation and the availability of appropriate testing methods (Fan and Rho, 2003). However, nanoindentation has recently been applied to characterize bone viscoelasticity (Bembey, et al., 2006, Fan and Rho, 2003, Oyen, 2005, Oyen and Ko, 2007, Rho and Pharr, 1999, Tang, et al., 2007), and is a promising technique for viscoelastic measures in microstructural units.
Nanoindentation is effective for determining the elastic modulus and hardness of thin films, small volumes, and microstructural features (Oliver, 1992). It has been used to detect variations in the mechanical properties of bone at a microstructural level, including individual osteons and trabeculae (Rho, et al., 1999, Tai, et al., 2005, Zhang, et al., 2010, Zhang, et al., 2008, Zysset, et al., 1999). When properties measured by nanoindentation were incorporated in finite element models, the results agreed with experimental modulus measurements for tension, compression, and torsion (Wolfram, et al., 2010). Nanoindentation can be used to investigate viscoelastic properties of materials by applying a constant load and subsequently measuring the creep depth as a function of time (He and Swain, 2009, Oyen, 2005, Oyen and Ko, 2007). These data can be fit to rheological models in order to determine parameters that describe the viscoelastic behavior (Bembey, et al., 2006, Fischer-Cripps, 2004, Oyen and Ko, 2007). This method identified substantial variability of the viscoelastic properties within samples of healing bone (Oyen and Ko, 2007). However, the effect of holding time has only been characterized for the Burgers viscoelastic model (Isaksson, et al., 2010).
Nanoindentation measurements in bone are sensitive to the loading protocol. The goal of this study was to investigate the effect of holding time on viscoelastic measurements of bone using nanoindentation for three different rheological models. Specifically, 1) fit the depth-time curve during holding period of nanoindentation by three rheological models to obtain creep time constant; 2) investigate the dependence of creep time constant on holding time; 3) compare the sensitivity of these rheological models to holding time and initial guess of parameters for optimization fit.
2. Methods
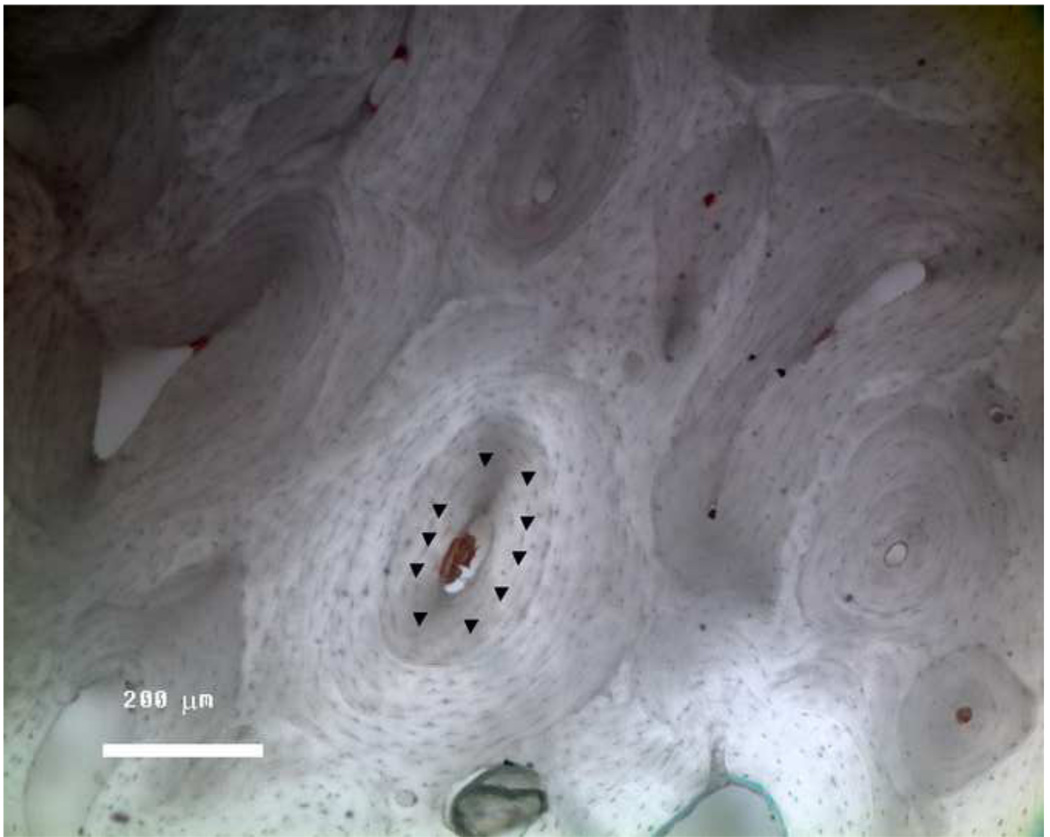
Four cortical bone samples were prepared from four bovine femora. Small trapeziform blocks, approximately 5 mm thick, were cut from the posterior distal-diaphysis using a diamond saw. This region of the bone was chosen because it is osteonal, and therefore more representative of human bone (Fig. 1). The surfaces were polished with successive grades of abrasives ending with 0.25 µm alumina suspension. The bone was kept hydrated with buffered saline throughout cutting and polishing.
Figure 1.
Typical surface of the osteonal cortical bone following polishing. The locations of the indents are marked by a triangle (▼), which were midway between the Haversian canal and the edge of the osteon.
The samples were subjected to nanoindentation to measure the elastic and creep behavior. The samples were thawed in PBS, and placed in the indenter after removing excess water from the surface, but without drying, which can affect the time constant (Ferreri, et al., 2010). Each sample was indented 10 times in 6 different osteons using a Berkovich pyramidal indenter (TI 950 Triboindenter, Hysitron, Minneapolis, MN). The indent locations were distributed around the circumference of the osteon, approximately midway across the radius (Fig. 1). The indenter was advanced at a rate of 2.0 mN/s to 10 mN, held at constant load for 200 seconds, and unloaded at 2.0 mN/s. Subsets of the data were analyzed to determine the effects of different hold times.
The indenter exhibits thermal drift on the order of ± 0.1 – 0.2 nm/s (Hysitron, 2006). To minimize the effect of thermal drift, only the portion of the data where the creep rate was greater than 5 nm/s – 20 times greater than the thermal drift – were analyzed. The creep rate was estimated using the central difference quotient:
| (1) |
where h'(t) is the creep rate at time t and h(t + Δt) and h(t − Δt) are the indentation depths at time t + Δt and t − Δt respectively.
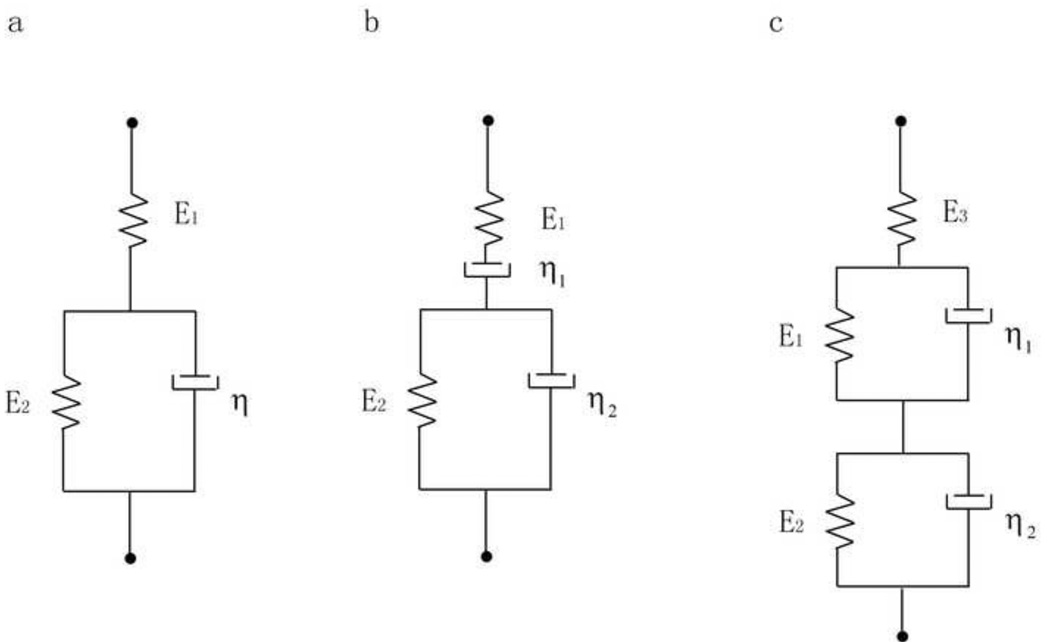
The creep time constants were found by fitting the indentation depth-time curve to three different viscoelastic models: the standard linear solid, Burgers, and two-dashpot Kelvin models (Fig. 2). The creep behavior for a step load for these models is given by:
| (2) |
| (3) |
| (4) |
for the standard linear solid, Burgers model, and the two-dashpot Kelvin model, respectively. In Equation 2 – 4, h(t) is the indentation depth, P0 is the peak force, α is the equivalent cone semi-angle (70.3° for a Berkovich indenter), ν is Poisson’s ratio, E1, E2 and E3 are moduli, τ is the creep time constant, η is a long term creep viscosity (GPa•s) and τ1 and τ2 are two independent creep time constants (Fischer-Cripps, 2004).
Figure 2.
Rheological models for viscoelastic behavior of bone. a) standard linear solid, with two elastic and one viscous element; b) Burgers model with two elastic and two viscous elements; and c) a two-dashpot Kelvin model, which has three elastic and two viscous elements. The time constant for the standard linear solid model is theoretically given by E2/η, for the Burgers model by E2/η2, and for the two-dashpot Kelvin model by E1/η2 and E2/η2.
A step load is difficult to realize in a real experiment, and a ramp load is used in all practical situations. When applying a ramp load, the modulus terms in equations 2 – 4 must be adjusted by a Ramp Correction Factor that includes ratios of the indentation rate to the time constants of the material (Oyen, 2005). However, the time constants during the constant load period are not affected by the initial loading rate (Oyen, 2005), and can be determined in spite of the application of a ramp rather than an instantaneous load. In a purely elastic material, the ramp correction factors could be calculated and applied to find the moduli from equations 2 – 4. However, the loading part of the curve contains substantial permanent deformation when indenting bone, and the elastic constants must be determined independently, usually from the unloading part of the curve. As such, for the convenience of curve fitting, equations 2 – 4 were simplified to reflect only the constant load portion of the experiment and to group linear terms into the minimal number of parameters:
| (5) |
| (6) |
| (7) |
The time constants for each indentation were determined using nonlinear optimization. The fit function with the trust-region algorithm in Matlab (Mathworks, Natick, MA) was used to find time constants that minimized the sum of squared error between the experimental data and equations 5 – 7 during the creep phase of loading. Data sets from 0 – 10 up to 0 – 30 seconds of holding time were extracted from the complete 200 s hold time for each indent. The loading phase, and the unloading phase were ignored.
The effect of holding time on the measurements was assessed by comparing the differences in the measured time constants between osteons in a single sample (intrasample) and between samples (intersample). The goal was to determine if the ability to detect differences within and between samples depended on holding time.
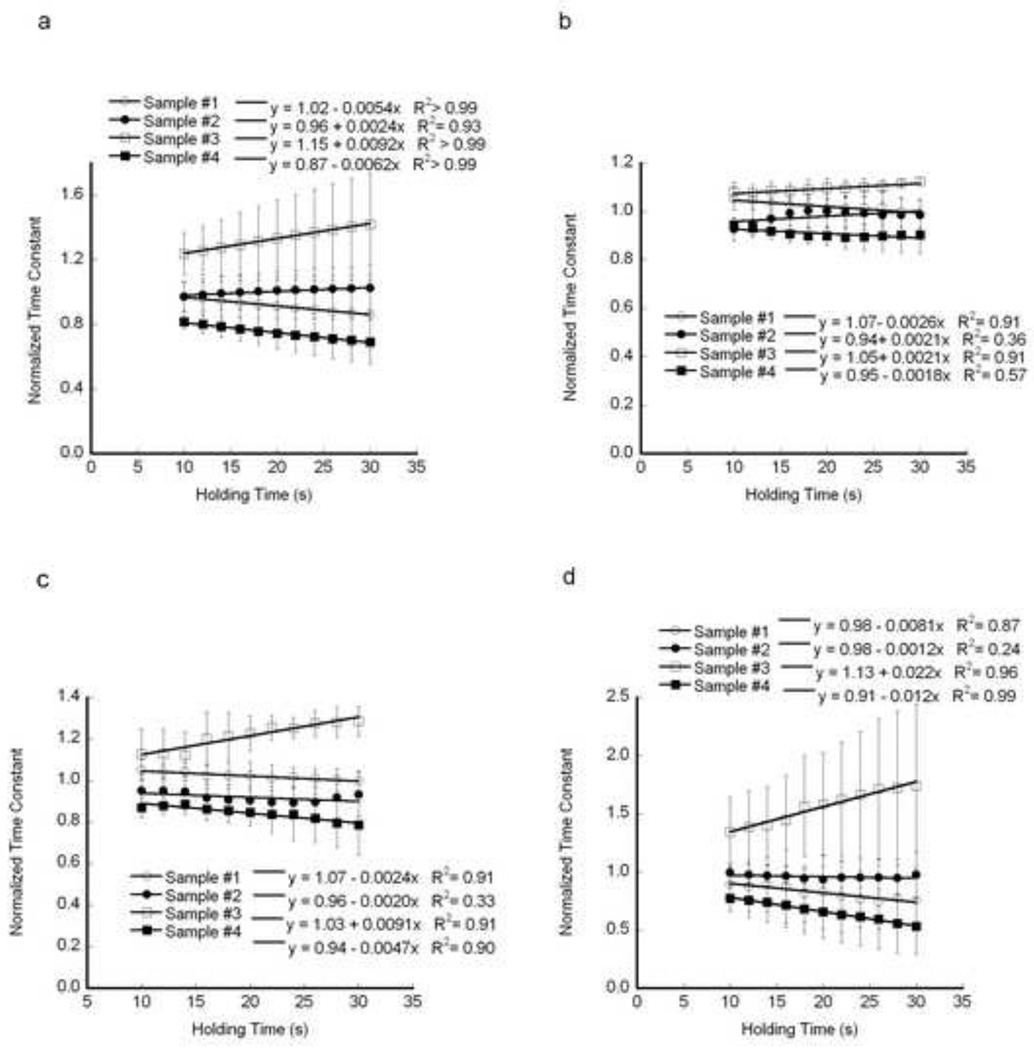
To assess how comparisons between samples were affected by holding time, the relative differences between samples were calculated. To normalize the time constants, we divided them by the mean value for the four samples at each time point, and plotted the result against holding time. The slope of the normalized regressions would be zero if relative differences between samples were constant. In contrast, a positive or negative slope would indicate that the relative difference of the sample from the mean increased with holding time.
Nonlinear curve fitting is sensitive to the initial estimate for the parameters. As such, a parameter study was conducted to quantify how changes in those estimates affected the solution. The initial values for the linear factors in equations 5 – 7 can be estimated from the initial and final indentation depths. For example, A0 in equation 5 should be equal to the indentation depth at the beginning of the hold period, and A1 should be equal to the difference between the initial and final depths. The time constants, in contrast, are not easily estimated. To explore the effects, the initial estimates for the time constants in Equation 5 – 7 were varied by 5 to 30% to assess whether the curve fits were repeatable.
Statistical analysis
The statistical analysis was performed using JMP version 8.0 (SAS Institute Inc., Cary, NC). The time constants were approximately log-normal distributed. As such, differences in the time constants between osteons in each same sample were determined by Kruskal-Wallis (KW) with repeated Wilcoxin signed-rank tests to identify specific differences. Intersample differences between time constants were also determined using KW by pooling the indentations for each sample. The significance of slopes of the regression between relative time constant and holding time were determined by analysis of covariance (ANCOVA) with sample and holding times as covariates. The residuals of these regressions were normally distributed.
3. Results
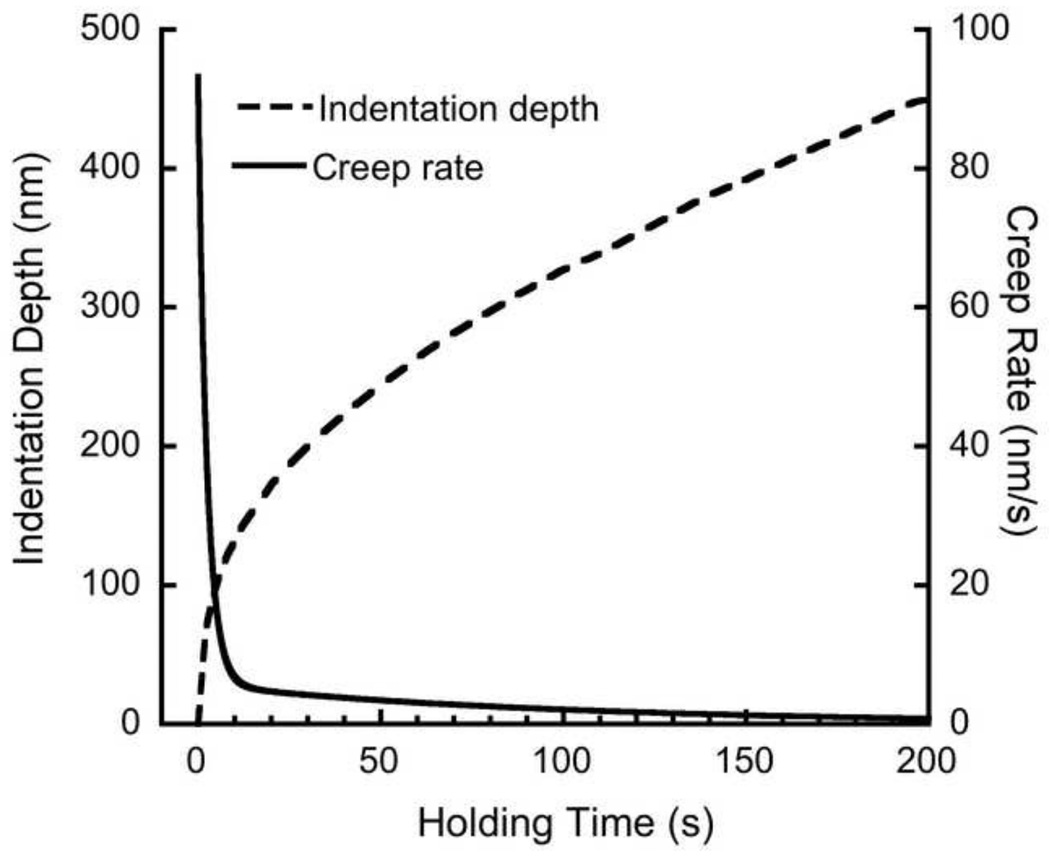
The creep rate decreased with holding time during the first 10 s, then stabilized (Fig. 3). However, thermal drift was evident in some indents, and the indenter began to retract from the sample at constant load. The creep rate fell below 5 nm/s after a 30 s holding period for 217 out of 240 indents. As such, the creep curves were analyzed only up to 30 s.
Figure 3.
A representative experimental indentation depth vs. time for 200s holding time and the corresponding creep rate vs. time.
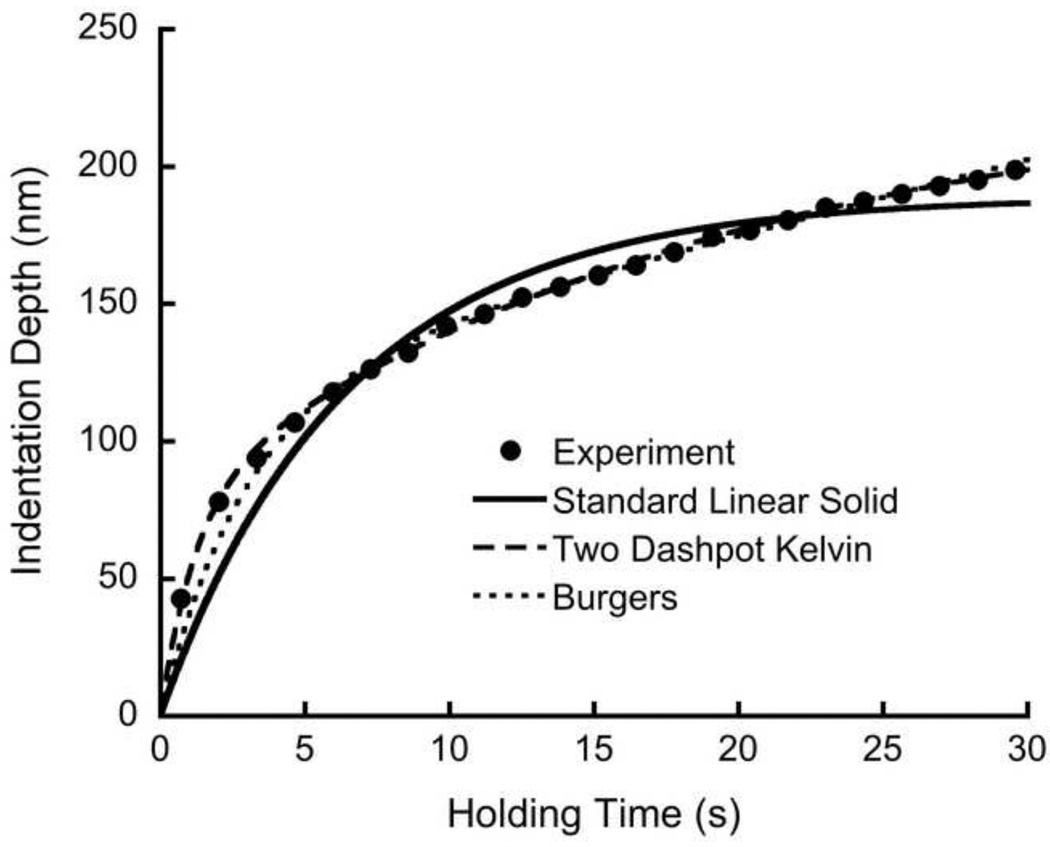
All three viscoelastic models captured the time dependent creep behavior. The squared correlation coefficient (R2) was 0.99 for all indents for all three models (Fig. 4). At 30 s holding time, the variability of the measurements within an osteon, quantified by the coefficient of variation (S.D./Mean) was highest for the standard linear solid (19.3 ± 9.4%), and lowest for Burgers model (8.2 ± 5.3%). In contrast, the intersample variation at 30 s holding was higher than the intrasample variation, and ranged from less than 20% in Burgers model to over 80% in the two-dashpot Kelvin model (Table 1).
Figure 4.
A representative creep data set and curve fits for the three rheological models.
Table 1.
The measured viscoealastic constants for all indentations (mean ± standard deviation)
| Standard Linear Solid | Burgers | Two dashpot Kelvin | ||
|---|---|---|---|---|
| τ (s) | τ (s) | η1 (GPa•s) | τ1 (s) | τ2 (s) |
| 7.18 ± 3.70 | 2.67 ± 0.48 | 1266 ± 1360 | 1.37 ± 0.41 | 27.1 ± 22.1 |
Within each sample, the time constant for the standard linear solid model differed between all osteons (p < 0.05, KW). In contrast, there was no intrasample difference in the mean time constant for two of the four samples when using Burgers model. The fast time constant of the two-dashpot Kelvin model also differed between osteons within two of the samples (p < 0.05, KW), while the slow time constant differed between osteons for all of the samples (p < 0.05, KW). As such, the ability to capture intrasample variability in the parameters depended on the creep model.
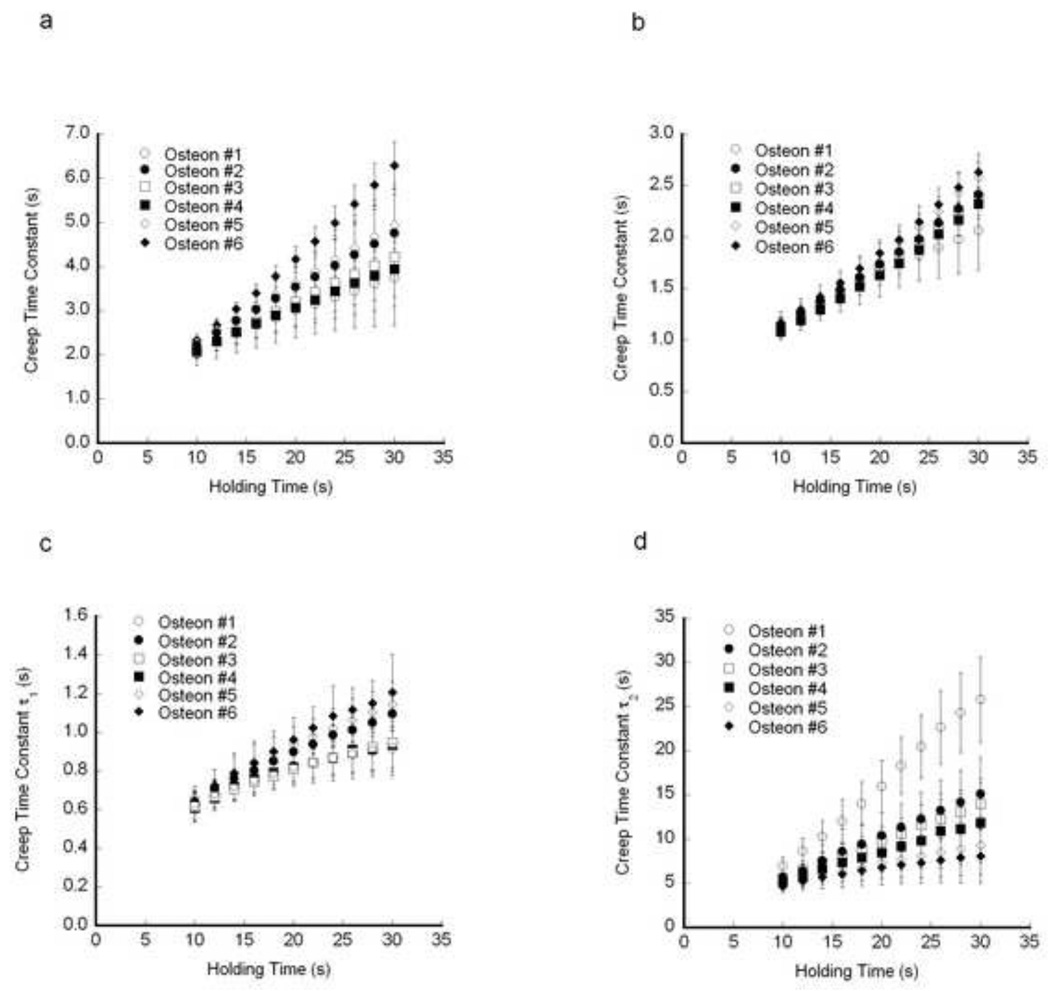
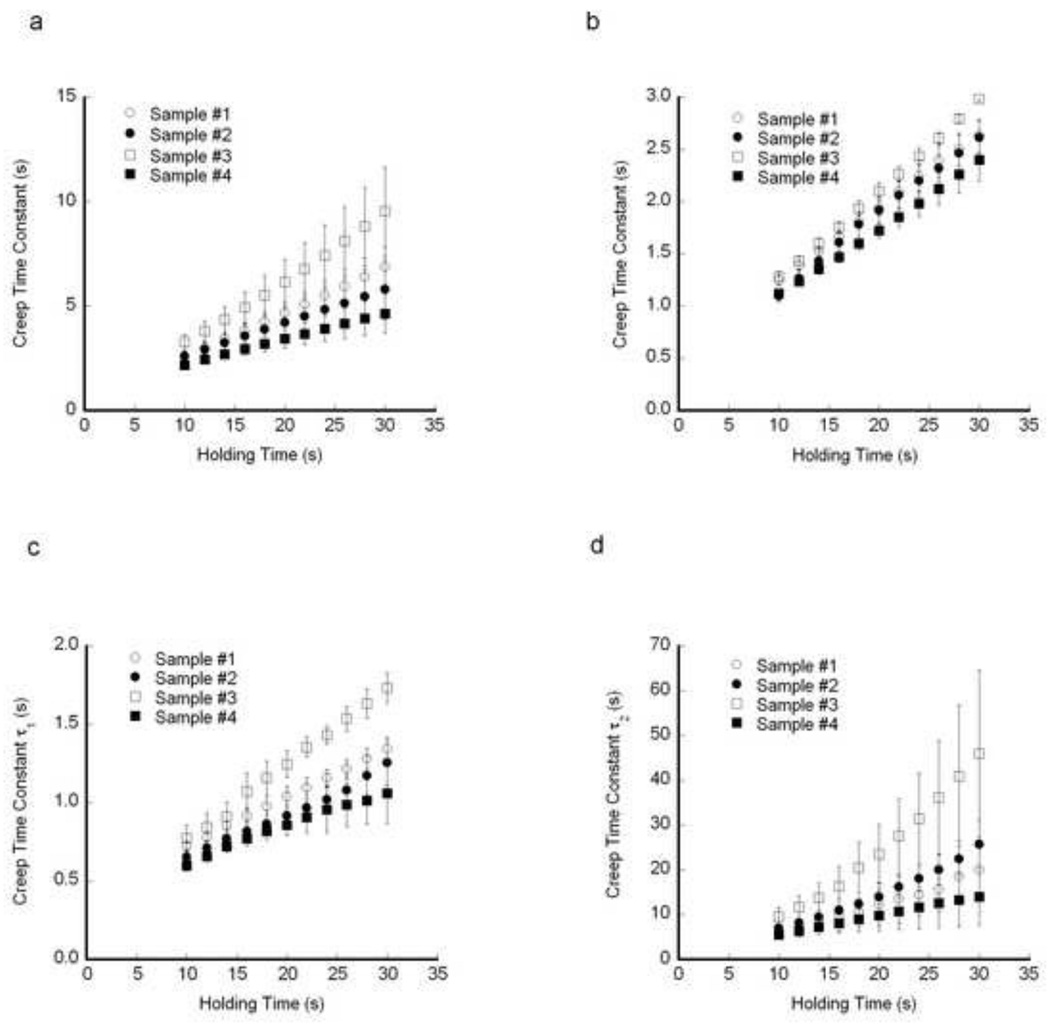
The calculated creep time constants increased with increasing holding time. For each indentation within a single osteon, the time constants increased with increasing holding time, as did the average creep time constants within an osteon (Fig. 5). Averaging the results from the osteons within a sample, the creep time constants increased linearly with increasing holding time (Fig. 6). For each viscoelastic model, the same intersample differences in the time constants were detected statistically whenever the holding times greater than 16 s (Table 2).
Figure 5.
The creep time constant increased with increasing holding time for each osteon within a representative sample. a) Standard Linear Solid model b) Burgers Model c) τ1 in Two-dashpot Kelvin Model. d) τ2 in Two-dashpot Kelvin Model. Error bars are one standard deviation (N=10 indents per osteon).
Figure 6.
The mean creep time constant within each sample increased with increasing holding time. a) Standard linear solid, b) Burgers Model, c) τ1 for the two-dashpot Kelvin Model, and d) τ2 for the two-dashpot Kelvin Model. Error bars are one standard deviation for 60 indents per sample.
Table 2.
Statistical differences of the creep time constants between four samples. The numbers identified the four samples, which are ranked from highest to lowest time constant in each column. Differences were found for each model and holding time (Kruskal-Wallis test). Samples that are not statistically different from one another are marked by the same letter (p > 0.05, repeated Wilcoxon post-hoc tests), i.e. 3(A), 2(B) and 1(B C) means sample 3 was significantly different from 2 and 1 while 2 and 1 were similar. For all three models, the sample differences were the same for holding times greater than 16 s.
| Two Dashpot Kelvin | ||||||||||||||||
|---|---|---|---|---|---|---|---|---|---|---|---|---|---|---|---|---|
| Model | ||||||||||||||||
| Standard Linear Solid | Burgers | Fast | Slow | |||||||||||||
| Hold Time (s) |
16 | 20 | 24 | 30 | 16 | 20 | 24 | 30 | 16 | 20 | 24 | 30 | 16 | 20 | 24 | 30 |
| Rank Order | 3(A) | 3(A) | 3(A) | 3(A) | 3(A) | 3(A) | 3(A) | 3(A) | 3(A) | 3(A) | 3(A) | 3(A) | 3(A) | 3(A) | 3(A) | 3(A) |
| 2(B) | 2(B) | 2(B) | 2(B) | 1(B) | 1(B) | 1(B) | 1(B) | 1(B) | 1(B) | 1(B) | 1(B) | 2(B) | 2(B) | 2(B) | 2(B) | |
| 1(B C) | 1(B C) | 1(B C) | 1(B C) | 2(B) | 2(B) | 2(B) | 2(B) | 2(C) | 2(C) | 2(C) | 2(C) | 1(B) | 1(B) | 1(B) | 1(B) | |
| 4(C) | 4(C) | 4(C) | 4(C) | 4(C) | 4(C) | 4(C) | 4(C) | 4(C) | 4(C) | 4(C) | 4(C) | 4(B) | 4(B) | 4(B) | 4(B) | |
The slopes of the regression between relative time constant and holding time were significant (Fig. 7), indicating the relative differences in the time constant increase with holding time. The percentage differences of the highest and lowest values relative to the mean increased from 40.5% at 16 s to 51.3% at 30 s for the standard linear solid model, from 16.3% to 19.6% for Burgers model, 28.1% to 38.9% for the fast time constant and 50.4%to 69.5% for the slow time constant of two dashpot Kelvin model. Hence, the relative differences between samples were least sensitive to holding time for the Burgers model.
Figure 7.
Time constants normalized by the mean indicate that the relative difference between samples increased with holding time, while the ordering remained the same. a) Standard linear solid, b) Burgers Model, c) τ1 for the two-dashpot Kelvin Model, and d) τ2 for the two-dashpot Kelvin Model. Significant regressions (p < 0.05) are indicated in italics in the legend. Error bars are one standard deviation for 60 indents per sample.
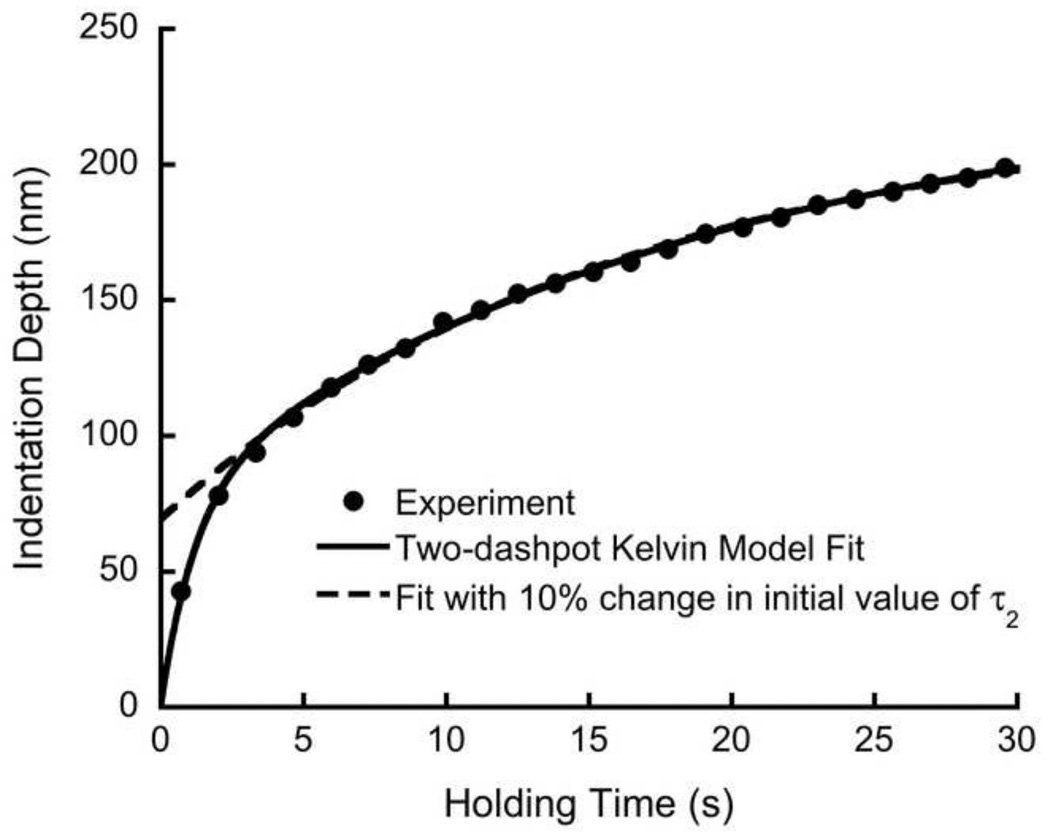
Changing the initial parameter estimates for the nonlinear curve fit only affected the results for the two-dashpot Kelvin model. The mean time constants for the standard linear solid and Burgers models changed by less than 2% when the initial estimates were changed by as much as 30%. The two-dashpot Kelvin model was affected when the initial estimate of the slow time constant was increased by more than 10%, and converged to an incorrect solution for 173 out of 240 cases (Fig. 8) and diverged for 13 cases. In contrast, decreasing the initial estimates had no effect on the final values.
Figure 8.
The effects of a poor initial estimate for the time constant using the two-dashpot Kelvin model. The solid line is the curve fit for initial curve fit with the resulting parameters: A0 = 1499 × 103, A1 = 195.8 × 10³, τ1 = 1.248, A2=429.1 × 10³, τ2 = 20.6. The dashed line is the fit for a 10% higher initial estimate for τ2, resulting in A0 = 1499 × 103, A1 = 421.6 × 10³, τ1 = 17.1, A2= 173.3 × 10³, τ2 = 2.2 × 10⁻¹⁴. The poor fit from these parameters was evident in the initial part of the curve. The other models were not sensitive to the initial estimates within the range tested.
4. Discussion
Nanoindentation provides a means to investigate the viscoelastic properties of bone at a small scale. However, because of heterogeneous nature of bone at small scales, the testing protocol can affect the measured quantities (Isaksson, et al., 2010, Zhang, et al., 2008). The goal of this study was to determine the effects of the measurement holding time on the measured creep parameters in bone. The calculated creep time constants increased monotonically with the holding time up to 30 s. However, the differences between measurements within an osteon, within a sample, and between samples were maintained for hold times over 16 s. As such, the creep time constants measured by nanoindentation with hold times below 30 s may not provide accurate property measurements, but comparisons between samples are valid if all are assessed at the same holding time and using the same viscoelastic model. At the same time, the creep rate decreases rapidly, and holding times greater than 30 s may be subject to measurement errors from thermal drift, depending on the device that is being used.
The primary strength of this study was the investigation of the creep behavior using three different rheological models applied at a range of holding times. These models represent varying complexity and allow the fast and slow creep regimes to be separated. Second, we considered how the different holding times and rheological models affected the results within individual osteons, within samples, and within a small group of samples. Finally, the effects of nonlinear fitting were investigated by considering whether the estimated time constants depended on the initial parameter values input to the fitting routine.
The primary limitation of this study is the lack of a gold standard measurement. In polymers, nanoindentation measures of viscoelastic constants are consistent with the macroscopic measurements (Oyen, 2005). In contrast, bone has a hierarchical structure, and we cannot assume that the macroscopic and nanoindentation results should agree. In addition, we used a Berkovich indenter, which results in some plastic and damaging behavior in contrast to spherical indenters, which can be used in softer materials to attain purely elastic indentation. As such, the results were affected by both elastic and inelastic viscous processes. Although the number of samples was small, and only bovine cortical bone was studied, these are considered minor limitations. The trends from the four samples were consistent, and the bone was osteonal with evidence of some secondary remodeling.
The time constants found here are consistent with previous nanoindentation studies. In spherical indentation creep testing on equine bone, the creep time constants τ1 and τ2 in a two-dashpot Kelvin model were both about 1.5 times higher than our results (Bembey, et al., 2006). However, the hold time in their study was 120 s, which, along with the difference in indenter geometry, could account for the difference in magnitude. Similarly, the viscosity of mouse cortical bone tissue determined from the load-depth curve using a Maxwell model (Tang, et al., 2007) was 2.12×10³ ± 3.18×10² GPa•s, which is comparable to the long-term viscosity, η, of the Burgers model in this study. For dehydrated bovine trabecular and cortical bone, creep time constants based on Burgers model were on the order of 1 to 5 s (Isaksson et al., 2010), in agreement with our results. The latter observation suggests that the hydration state may play only a minor role in the creep behavior measured by nanoindentation, which agrees with experiments on ethanol saturated bone samples (Bembey, et al., 2006).
The relationship between the viscoelastic parameters at the microstructural and macroscopic levels is not fully understood. The time constants found here using a Burgers model were an order of magnitude higher than that found in macroscopic three-point bending (Iyo, et al., 2004). In contrast, they were two orders of magnitude lower than that found in torsion, bending, and compression relaxation tests in which the relaxation curves were fit to a linear combination of a Kohlrausch-Williams-Watts (KWW) function and an exponential decay (Sasaki, et al., 1993). These differences could be due to effects of visco-plasticity or viscous damage during the initial part of indentation creep. Another important difference between the methods is that macroscopic creep is measured under a state of constant stress, whereas indentation creep is under a condition of constant force. Although the model accounts for the change in contact area based on the tip shape function, the stress is decreasing with time.
An alternative method to study viscoelastic properties of bone tissue is Dynamic Mechanical Analysis (DMA) (Lakes, et al., 1979). The loss tangent, tan(δ), measured by DMA depended on loading frequency in both macroscopic (Hsieh and Turner, 2001, Les, et al., 2004, Yeni, et al., 2007) and nanoindentation testing (Ferreri, et al., 2010, Isaksson, et al., 2010). Interpreting the DMA results based on a standard linear solid model, the values of tan(δ) reported for nanoindentation (Isaksson, et al., 2010) were consistent with creep time constants on the order of 1 to 5 s, depending on frequency.
Optimization methods have been used to fit viscoelastic parameters to the full nanoindentation curve. A four-parameter visco-elastic/plastic constitutive model was applied to simulate the indentation load vs. depth response of bone tissue over both nano- and micro-scale load ranges, and it showed good agreement between the experimental data and simulation results (Zhang, et al., 2008). A plastic-damage model was capable of simulating the bone indentation response through an axisymmetric finite element simulation, including the reduced stiffness exhibited during the latter stages of unloading (Zhang, et al., 2010). These techniques may provide a more general solution for measuring viscoelastic parameters, but have so far assumed a single damping coefficient for both the plastic and elastic loading regimes.
In conclusion, all three models were able to capture the creep behavior of bone tissue. The creep time constants for Burgers model were the least variable both within an osteon and within a sample. Regardless of the model applied, the variability between measurements is as likely to reflect actual variability within the sample as it is to be a result of measurement error. Due to the effect of holding time on the calculated time constants, a holding time greater than 15 s is recommended for measurement of viscoelasticity by nanoindentation, depending on the thermal drift effects of the instrument being used. Considering the reported long-term viscosity of bone tissue (Tang, et al., 2007), Burgers model provides a good rheological model for quantifying the viscoelastic properties of bone tissue by nanoindentation. It gave consistent relative differences between samples over the range of holding times tested here, and was relatively insensitive to poor initial estimates of the parameters.
Acknowledgements
This study was supported by the U.S. National Institutes of Health (ARO52008).
Footnotes
Publisher's Disclaimer: This is a PDF file of an unedited manuscript that has been accepted for publication. As a service to our customers we are providing this early version of the manuscript. The manuscript will undergo copyediting, typesetting, and review of the resulting proof before it is published in its final citable form. Please note that during the production process errors may be discovered which could affect the content, and all legal disclaimers that apply to the journal pertain.
Conflict of interest statement
None declared.
References
- Bembey AK, Oyen ML, Bushby AJ, Boyde A. Viscoelastic properties of bone as a function of hydration state determined by nanoindentation. Philosophical Magazine. 2006;86(33–35):5691–5703. [Google Scholar]
- Carter DR, Hayes WC. Bone compressive strength: The influence of density and strain rate. Science. 1976;194(4270):1174–1176. doi: 10.1126/science.996549. [DOI] [PubMed] [Google Scholar]
- Carter DR, Hayes WC. The compressive behavior of bone as a two-phase porous structure. Journal of Bone and Joint Surgery. 1977;59-A:954–962. [PubMed] [Google Scholar]
- Fan Z, Rho JY. Effects of viscoelasticity and time-dependent plasticity on nanoindentation measurements of human cortical bone. Journal of Biomedical Materials Research A. 2003;67(1):208–214. doi: 10.1002/jbm.a.10027. [DOI] [PubMed] [Google Scholar]
- Ferreri SL, Hu B, Qin YX. The effects of dehydration on elastic and viscoelastic material properties obtained using nanoindentation. Transactions of the 56th annual meeting of the ORS; New Orleans, LA. 2010. p. 628. [Google Scholar]
- Fischer-Cripps AC. A simple phenomenological approach to nanoindentation creep. Materials Science and Engineering A. 2004;385(1–2):74–82. [Google Scholar]
- He LH, Swain MV. Nanoindentation creep behavior of human enamel. Journal of Biomedical Materials Research A. 2009;91(2):352–359. doi: 10.1002/jbm.a.32223. [DOI] [PubMed] [Google Scholar]
- Hsieh YF, Turner CH. Effects of loading frequency on mechanically induced bone formation. Journal of Bone and Mineral Research. 2001;16(5):918–924. doi: 10.1359/jbmr.2001.16.5.918. [DOI] [PubMed] [Google Scholar]
- Hysitron . Ti-950 triboindenter user manual. Minneapolis, MN: Hysitron, Inc.; 2006. p. 2006. [Google Scholar]
- Isaksson H, Nagao S, Malkiewicz M, Julkunen P, Nowak R, Jurvelin JS. Precision of nanoindentation protocols for measurement of viscoelasticity in cortical and trabecular bone. Journal of Biomechanics. 2010;43(12):2410–2417. doi: 10.1016/j.jbiomech.2010.04.017. [DOI] [PubMed] [Google Scholar]
- Iyo T, Maki Y, Sasaki N, Nakata M. Anisotropic viscoelastic properties of cortical bone. Journal of Biomechanics. 2004;37(9):1433–1437. doi: 10.1016/j.jbiomech.2003.12.023. [DOI] [PubMed] [Google Scholar]
- Lakes RS, Katz JL, Sternstein SS. Viscoelastic properties of wet cortical bone--I. Torsional and biaxial studies. Journal of Biomechanics. 1979;12(9):657–678. doi: 10.1016/0021-9290(79)90016-2. [DOI] [PubMed] [Google Scholar]
- Les CM, Spence CA, Vance JL, Christopherson GT, Patel B, Turner AS, Divine GW, Fyhrie DP. Determinants of ovine compact bone viscoelastic properties: Effects of architecture, mineralization, and remodeling. Bone. 2004;35(3):729–738. doi: 10.1016/j.bone.2004.04.006. [DOI] [PubMed] [Google Scholar]
- Oliver An improved technique for determining hardness and elastic modulus using load and displacement sensing indentation experiments. Journal of Materials Research. 1992;7(6):1564. [Google Scholar]
- Oyen ML. Spherical indentation creep following ramp loading. Journal of Materials Research. 2005;20(8):2094–2100. [Google Scholar]
- Oyen ML, Ko CC. Examination of local variations in viscous, elastic, and plastic indentation responses in healing bone. Journal of Materials Science Materials in Medicine. 2007;18(4):623–628. doi: 10.1007/s10856-007-2311-7. [DOI] [PubMed] [Google Scholar]
- Rho JY, Pharr GM. Effects of drying on the mechanical properties of bovine femur measured by nanoindentation. Journal of Materials Science Materials in Medicine. 1999;10(8):485–488. doi: 10.1023/a:1008901109705. [DOI] [PubMed] [Google Scholar]
- Rho JY, Roy ME, 2nd, Tsui TY, Pharr GM. Elastic properties of microstructural components of human bone tissue as measured by nanoindentation. Journal of Biomedical Materials Research. 1999;45(1):48–54. doi: 10.1002/(sici)1097-4636(199904)45:1<48::aid-jbm7>3.0.co;2-5. [DOI] [PubMed] [Google Scholar]
- Sasaki N, Enyo A. Viscoelastic properties of bone as a function of water content. Journal of Biomechanics. 1995;28(7):809–815. doi: 10.1016/0021-9290(94)00130-v. [DOI] [PubMed] [Google Scholar]
- Sasaki N, Nakayama Y, Yoshikawa M, Enyo A. Stress relaxation function of bone and bone collagen. Journal of Biomechanics. 1993;26(12):1369–1376. doi: 10.1016/0021-9290(93)90088-v. [DOI] [PubMed] [Google Scholar]
- Tai K, Qi HJ, Ortiz C. Effect of mineral content on the nanoindentation properties and nanoscale deformation mechanisms of bovine tibial cortical bone. Journal of Materials Science Materials in Medicine. 2005;16(10):947–959. doi: 10.1007/s10856-005-4429-9. [DOI] [PubMed] [Google Scholar]
- Tang B, Ngan AH, Lu WW. An improved method for the measurement of mechanical properties of bone by nanoindentation. Journal of Materials Science Materials in Medicine. 2007;18(9):1875–1881. doi: 10.1007/s10856-007-3031-8. [DOI] [PubMed] [Google Scholar]
- Wolfram U, Wilke HJ, Zysset PK. Valid mu finite element models of vertebral trabecular bone can be obtained using tissue properties measured with nanoindentation under wet conditions. Journal of Biomechanics. 2010;43(9):1731–1737. doi: 10.1016/j.jbiomech.2010.02.026. [DOI] [PubMed] [Google Scholar]
- Yeni YN, Shaffer RR, Baker KC, Dong XN, Grimm MJ, Les CM, Fyhrie DP. The effect of yield damage on the viscoelastic properties of cortical bone tissue as measured by dynamic mechanical analysis. Journal of Biomedical Materials Research A. 2007;82(3):530–537. doi: 10.1002/jbm.a.31169. [DOI] [PubMed] [Google Scholar]
- Zhang J, Michalenko MM, Kuhl E, Ovaert TC. Characterization of indentation response and stiffness reduction of bone using a continuum damage model. Journal of Mechanical Behavior of Biomedical Materials. 2010;3(2):189–202. doi: 10.1016/j.jmbbm.2009.08.001. [DOI] [PMC free article] [PubMed] [Google Scholar]
- Zhang J, Niebur GL, Ovaert TC. Mechanical property determination of bone through nano- and micro-indentation testing and finite element simulation. Journal of Biomechanics. 2008;41(2):267–275. doi: 10.1016/j.jbiomech.2007.09.019. [DOI] [PMC free article] [PubMed] [Google Scholar]
- Zysset PK, Guo XE, Hoffler CE, Moore KE, Goldstein SA. Elastic modulus and hardness of cortical and trabecular bone lamellae measured by nanoindentation in the human femur. Journal of Biomechanics. 1999;32(10):1005–1012. doi: 10.1016/s0021-9290(99)00111-6. [DOI] [PubMed] [Google Scholar]


