Abstract
Monoclonal antibodies are subject to a variety of degradation mechanisms, therefore orthogonal techniques are required to demonstrate product quality. In this study, the three individual antibodies comprising a multi-antibody drug product, XOMA 3AB were evaluated by both cation-exchange (CEX) and anion-exchange chromatography (AEX).
In contrast to CEX analysis which showed only a single, broad peak for the force-oxidized antibodies, AEX analysis of Ab-A (pI=7.6) revealed two more basic peaks. Ab-B (pI=6.7) bound but exhibited only a single major peak while Ab-C (pI=8.6) flowed through. Peptide mapping LC/MS analysis of the isolated Ab-A fractions demonstrated that the basic peaks resulted from oxidation in a complementary determining region (CDR). Differential scanning calorimetry (DSC) analysis of the oxidized Ab-A species showed a decrease in the Fab melting point for the oxidized species consistent with unfolding of the molecule. Greater/lesser surface exposure of ionic residues resulting from a conformational change provides a likely explanation for the dramatic shift in retention behavior for the Ab-A oxidized variants. Peptide mapping analysis of the Ab-B antibody showed, in contrast to Ab-A, no detectable CDR oxidation. Hence, the lack of separation of oxidized variants in Ab-B can be explained by the absence of CDR oxidation and the associated changes in secondary/tertiary structure which were observed for oxidized AbA. In summary, anion-exchange HPLC shows potential as an orthogonal analytical technique for assessing product quality of monoclonal antibody therapeutics. In the case of the XOMA 3AB drug product, two of the antibodies bound and one, Ab-A, exhibited separation of CDR oxidized variants.
1 Introduction
Botulinum neurotoxins (BoNTs) are extremely potent toxins secreted by Clostridium botulinum. In vivo neutralization of type A BoNT/A using therapeutic monoclonal antibodies (MAbs) is produced by three MAbs directed against distinct epitopes. A triple MAb liquid formulation was developed including three human or humanized BoNT/A MAbs as a drug product, XOMA 3AB. Botulinum neurotoxin (BoNT) is classified as a Category A bioterrorism threat agent, with limited treatment options. Botulinum intoxication is characterized by onset of progressive muscular and respiratory paralysis within 2 to 72 hours of exposure. Victims of severe poisoning require long term respiratory support.
Although any of the Botulinum strains (A, B, C, D, E, F and G) and their various subtypes could be used as a biological weapon, type A is among the most common strains involved in botulinum intoxication, and exhibits the longest duration of paralysis in animal studies. To address the limitations of current licensed therapy XOMA has developed recombinant human monoclonal antibodies (MAbs) directed to three distinct epitopes on the type A neurotoxin protein (BoNT/A). Animal studies have demonstrated that multiple MAbs binding simultaneously to the toxin prevents intoxication and is effective in clearing the BoNT/A toxin [1].
XOMA 3AB consists of three human immunoglobulin G (IgG1) MAbs. The IgG1 subclass of antibodies represents the majority of FDA-approved drug products. Consequently, much is known regarding the types of post-translational modifications (PTM) occurring during the course of the production process and upon storage/stability as well as their potential biological effects. Common chemical modifications which have been reported in the literature include oxidation [2–6], cyclization [7–10], proteolytic cleavage [11–13], disulfide bond scrambling [14–15], deamidation/isomerization [16–22], C-terminal truncation [23–24], and glycation [25].
The intact XOMA 3AB monoclonal antibodies are composed of two IgG1 gamma heavy chains and two kappa light chains. There is a single asparagine-linked site of glycosylation located in the CH2 region of the Fc. The oligosaccharide structures are of the core-fucosylated biantenary type with varying degrees of terminal galactosylation. The predominant glycoform in the XOMA 3AB antibodies is the agalactosylated species.
Monoclonal antibodies are generally basic owing to the physicochemical characteristics of the conserved Fc domain and are therefore typically analyzed by CEX HPLC. However, the amino acid sequence in the variable regions of the Fab domain, in particular the solvent accessible complementary determining regions (CDRs), could contribute exposed acidic residues allowing binding to the AEX resin. In addition, exposure of antibody to forced-degradation conditions could potentially cause changes in secondary/tertiary structure resulting in greater solvent accessibility of residues not typically involved in binding to the AEX resin [4]. Hence, while ion-exchange chromatography is most commonly performed in the cation mode (CEX), anion-exchange analysis (AEX), particularly on the more neutral of the three antibodies (Ab-A, pI=7.6 and Ab-B, pI=6.7) could provide an alternate selectivity for degradation products.
Oxidation of methionine residues from the sulfhydryl to the sulfoxide form is one of the common PTMs known to occur in recombinant monoclonal antibodies during the manufacturing, formulation, and/or storage process [2–6]. Oxidative degradation occurs through formation of free radicals generated by exposure to ultraviolet light and/or by formulation excipients, in particular non-ionic surfactants, which can then undergo autooxidation to form peroxides. The peroxides react with metal ions to generate free radicals which can induce oxidation in proteins. While hydrophobicity-based HPLC techniques including HIC and reversed-phase [26] are typically employed for monitoring overall oxidation in antibodies owing to the increased polarity of the methionine sulfoxide form, complementary methods such as ion-exchange can provide useful separations due to the effect of changes in protein conformation on local charge distribution [4]. The three XOMA 3AB antibodies, Ab-A, Ab-B, and Ab-C, contain multiple sites for potential methionyl oxidation. However, a conserved methionine residue residing in the CH2 region of the heavy chain subunit (HC) has been shown to be the primary site of oxidation in IgG1 antibodies [5]. Oxidation can also occur at the methionine in the CH3 region of the heavy chain closest to the C-terminus, but only under more extreme conditions.
In addition, Ab-A and Ab-B antibodies each contain a potential site for methionyl oxidation in the complementary determining region. Specifically, Ab-A contains a methionine in CDR2 and Ab-B contains a methionine in CDR3, both residues residing in the Fab domain. The location of these residues in solvent accessible regions could result in greater susceptibility to oxidation; hence, it was of interest to develop methods for monitoring their presence. In this study, the capabilities of both cation and anion-exchange HPLC for the analysis of the three force-degraded antibodies comprising the XOMA 3AB mixture will be discussed with a focus on the different selectivities that can be achieved by the two techniques.
2 Materials and Methods
2.1 Force-Oxidized Antibody Samples
Degraded samples were prepared by reacting the antibodies (Ab-A, Ab-B, and Ab-C) with 1% hydrogen peroxide (v/v) at ambient temperature for 24h.
2.2 Cation-Exchange HPLC
Cation-exchange HPLC was performed on a Dionex WCX-10 cation-exchange column (4 × 250 mm) with mobile phases consisting of 20 mM MES, pH 6.0 (Buffer A) and 20 mM MES, pH 6.0 with 500mM sodium chloride (Buffer B). The column was thermostatted at 30°C. Samples were eluted by employing a linear gradient of 5% Buffer B to 100% Buffer B in 40 min. Flow rate was set at 0.50 mL/minute. Detection was by UV at 280 nm. The sample injection load was 30 μg.
2.3 Anion-Exchange HPLC at pH 7.5
Anion-exchange HPLC at pH 7.5 was performed on the Dionex WAX-10 column (4 × 250 mm) thermostatted at 30°C. The mobile phases consisted of 20mM sodium phosphate, pH 7.5 (Buffer A) and 20mM sodium phosphate, pH 7.5 with 500mM sodium chloride (Buffer B). Samples were eluted by employing a linear gradient of 15% Buffer B to 100% Buffer B in 30 min. Flow rate was set at 0.50 mL/min. Detection was by UV at 280 nm. Sample load was 30 ug.
2.4 Anion-Exchange HPLC at pH 6.0
Anion-exchange HPLC at pH 6.0 with salt elution was performed on the Dionex WAX-10 column (4 × 250 mm) thermostatted at 30°C. The mobile phases consisted of 20mM MES, pH 6.0 (Buffer A) and 20mM MES, pH 6.0 with 500mM sodium chloride (Buffer B). Samples were eluted by employing a linear gradient of 15% Buffer B to 100% Buffer B in 30 min. Flow rate was set at 0.50 mL/min. Detection was by UV at 280 nm. Sample load was 30 ug.
2.5 Tryptic Mapping LC/MS
The Ab-A AEX fractions, Ab-A reference, and force-oxidized Ab-B (200 μg) samples were vacuum dried in a Speed-Vac and then reconstituted in 6M urea/0.4 M ammonium bicarbonate, pH 8.2. The samples were then reduced with dithiothreitol and alkylated by treatment with iodoacetamide followed by overnight digestion at 37°C with sequencing grade-TPCK-modified trypsin (Promega). The resultant peptide mixture was chromatographed on an Agilent 1100 HPLC system fitted with a Reliasil C-18 column, 2×250mm, 5 μm, 300Å (Column Engineering Catalog # R5HE-126). Trifluoroacetic acid (0.1% v/v) in Milli-Q water and in acetonitrile was used as mobile phases A and B, respectively. Gradient elution was achieved by holding the column at 2% B for 5 minutes and then increasing the percentage of mobile phase B to 52% over 100 minutes (0.5% B/min).
The effluent from the HPLC was directed into an LCQduo ion trap mass spectrometer (Thermo Finnigan) without flow splitting. The system was set up to operate in “triple play mode” with stage 1 being a full scan of the parent ion from 300 to 2000 m/z, stage 2 serving as a high resolution “zoom” scan for determination of charge state and stage 3 operating in tandem MS/MS mode for sequence confirmation. The electrospray voltage of the source was set to 5.0 KV in the positive ionization mode. The temperature of the heated capillary was adjusted to 225°C. The capillary voltage was 20V. The sheath gas (nitrogen) was set at 70. The collision gas (helium) energy used for collision-induced dissociation (CID) was set to 35.
2.6 Differential Scanning Calorimetry
The isolated AEX fractions were concentrated by ultra-filtration and then dialyzed into 10mM sodium citrate, 2% glycine, pH 5.0. The lower pH was chosen for better separation of the thermal transition temperatures of the different domains of the monoclonal antibody. The DSC data were obtained from the NanoDSC™ with capillary cells (TA Instrument, New Castle, DE). The samples were scanned from 25°C to 95°C at a scan rate of 1°C per minute. The buffer blank was subtracted from the raw DSC data and baseline correction was applied with the NanoAnalyze™ software.
2.7 ELISA Assay
Binding activity of the oxidized antibody variants was analyzed by a 96-well format sandwich ELISA method that can detect a dose-dependent binding of antibody. Briefly, a non-toxic antigen domain of the Type A Botulinum neurotoxin BoNT/A was coated at 5.0 ug/mL in 100 ul per well on microtiter plates overnight at 2°C to 8°C. After direct coating of the plate with the antigen domain, the Ab-A reference and AEX fractions were serially diluted 1:2 with a starting concentration of 0.188 ug/mL to a final concentration of 0.001 ug/mL and added to the plate followed by detection with secondary conjugated antibodies. All incubations were for 2 hours at room temperature on a Fisher microtiter plate shaker. Absorbance readings were obtained at wavelength 405 nm after 10 minutes of ABTS (2,2′-Azinobis [3-ethylbenzothiazoline-6-sulfonic acid]-diammonium salt) substrate development and graphed on a 4-parameter fit algorithm against the Ab-A concentration to yield an eight-point dose-dependent sigmoidal curve.
3. Results and Discussion
3.1 Cation-Exchange HPLC
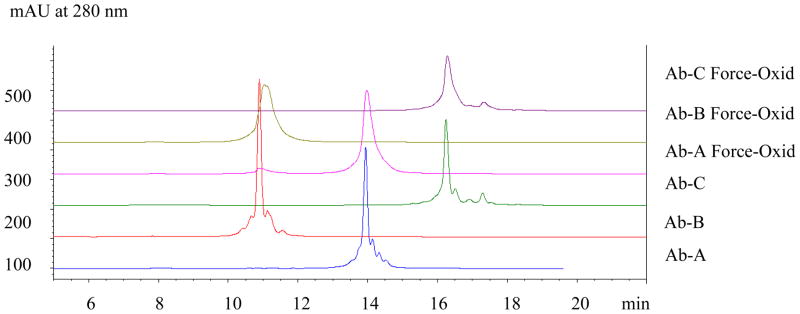
Cation-exchange analysis of force-oxidized Ab-A, Ab-B, and Ab-C using a mobile phase consisting of MES, pH 6.0 with salt elution resulted in broad, asymmetric peaks with significantly diminished resolution of typically observed acidic and basic isoforms compared to reference material (Figure 1). The antibodies, Ab-A, Ab-B, and Ab-C, eluted at 130mM, 168mM, and 194mM sodium chloride (NaCl) in the salt elution gradient. The order of elution of the three XOMA 3AB antibodies, Ab-A, Ab-B, and Ab-C, was consistent with their theoretical pIs of 7.6, 6.7, and 8.6, respectively. Optimization of mobile phase parameters including pH, buffer type and ionic strength were evaluated and resulted in similar observations. (data not shown). Therefore, ion-exchange in the anion mode was investigated as an orthogonal charge-based separation technique.
Figure 1.
Cation-Exchange HPLC of XOMA 3AB Antibodies. The three XOMA 3AB reference antibodies (Ab-A, Ab-B, and Ab-C) display multiple acidic and basic isoforms typical of recombinant monoclonal antibody drug products. The force-oxidized samples of each of these antibodies exhibit broad peak profiles indicating underlying structural heterogeneity. Anion-exchange HPLC (Figure 2) was evaluated as an orthogonal charge-based technique to better characterize the potential modifications.
3.2 Anion-Exchange HPLC at pH 7.5
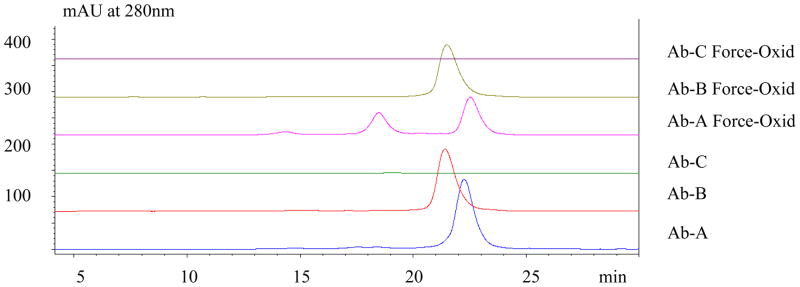
Anion-exchange HPLC analysis of the three individual antibodies comprising the XOMA 3AB mixture performed in a mobile phase consisting of 20mM sodium phosphate, pH 7.5 with salt gradient elution is shown in Figure 2. Both Ab-A (pI=7.6) and Ab-B (pI= 6.7) bind to the anion-exchanger at pH 7.5. Antibody Ab-C flows through the column consistent with its higher pI (8.6); hence, it was not further studied.
Figure 2.
AEX at pH 7.5 of XOMA 3AB Antibodies. The two more neutral antibodies (Ab-A, pI=7.4 and Ab-B, pI=6.7) bound to the anion-exchange resin while the basic Mab (Ab-C) flowed through. The force-oxidized Ab-A exhibited two more basic peaks. In contrast, force-oxidized Ab-B shows only a single major peak. Both basic peak fractions of Ab-A were subjected to further characterization by peptide mapping (Figure 4). Force-oxidized Ab-B was also characterized by peptide mapping to determine the sites of modification since no apparent resolution of oxidized species was observed.
The AEX analysis of force-oxidized Ab-A performed at pH 7.5 produced, in addition to the main peak at 22.6 min eluting at 395mM NaCl, two more basic peaks with retention times of 14.6 and 18.5 min eluting at 282mM and 337mM NaCl, respectively. Hence, the AEX HPLC method demonstrated pronounced selectivity for oxidized variants of Ab-A. In contrast, the Ab-B force-oxidized sample exhibited only a single major peak at 21.8 min eluting at 384mM NaCl. In addition, the weakly acidic Ab-B antibody eluted in reversed order relative to Ab-A based on isoelectric point (pI) predictions. Thus, it would appear that ion-exchange chromatographic retention behavior for intact antibodies can vary significantly from theoretical pI values, not surprising given that only a subset of surface assessable residues participate in binding to the resin.
3.3 AEX at pH 6.0
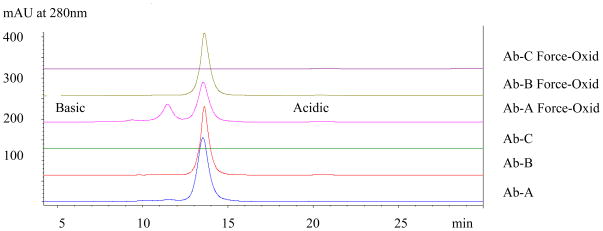
Owing to the lack of separation of oxidized variants in force-oxidized Ab-B at pH 7.5, the effect of mobile phase pH was evaluated. The chromatographic profiles of Ab-A, Ab-B, and Ab-C reference material are shown in Figure 3, upper panels. The mobile phase consisted of 20mM MES, pH 6.0. Elution was achieved by a linear gradient of increasing salt. Interestingly, the neutral antibody, Ab-A (pI= 7.6), bound to the anion-exchanger at pH 6.0. The retention behavior of Ab-A was virtually identical to the more acidic antibody, Ab-B (pI=6.7), both eluting at approximately 265mM sodium chloride. These results, again, emphasize that retention behavior in ion exchange chromatography is governed by surface charge which can be difficult to predict in large, multi-domain proteins such as monoclonal antibodies and point to the importance of empirical assessment of chromatographic behavior in both cation and anion modes of ion-exchange HPLC.
Figure 3.
AEX of XOMA 3AB Antibodies at pH 6.0. Both Ab-A and Ab-B antibodies bound to the anion-exchanger at pH 6.0, however, the Ab-A oxidized variants were not as well resolved as at pH 7.5 (Figure 2) and Ab-B, again, eluted as a single major peak indicating a lack of selectivity for oxidized forms. Ab-C flowed through as was the case at pH 7.5 and hence, was not subjected to further investigation. The binding of the neutral pH antibody, Ab-A (pI=7.4), at pH 6.0 was somewhat unexpected based on theoretical pI predictions and emphasizes the importance of empirical assessment of charge behavior.
The chromatographic profiles for the force-oxidized Ab-A, Ab-B, and Ab-C antibodies analyzed by AEX at pH 6.0 are displayed in Figure 3, lower panels. Force-oxidized Ab-B shows only a single major peak, as was the case at pH 7.5, indicating that AEX is ineffective at resolving oxidized species present in the force-oxidized Ab-B antibody. The two basic peaks in force-oxidized Ab-A are resolved, although not nearly as well as at pH 7.5. The two basic peaks with retention times of 11.2 min and 9.2 min elute at 235mM and 205mM sodium chloride in the linear salt elution gradient (the main peak elutes at 265mM). Therefore, the AEX conditions at pH 7.5 described in section 3.2 were selected as optimal for the separation of Ab-A oxidized variants and were employed in the isolation of fractions by semi-preparative anion-exchange chromatography.
3.4 Semi-Preparative Anion-Exchange Chromatography
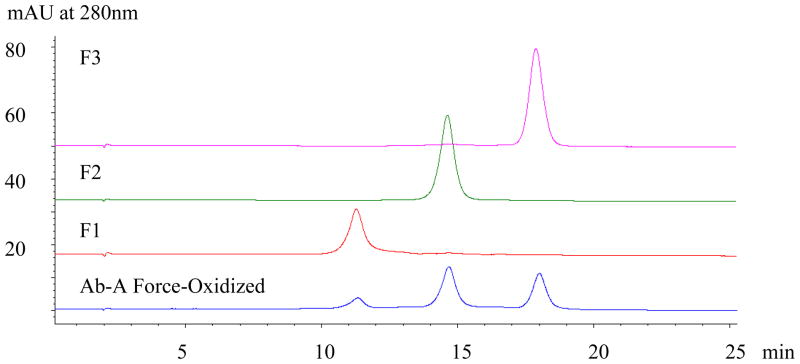
Semi-preparative AEX at pH 7.5 was performed in order to characterize the more basic peaks from Ab-A with respect to the site of oxidation responsible for the AEX selectivity. Both basic peaks as well as the main peak were isolated from a force-oxidized Ab-A sample (2 mg). An aliquot of the fractions was analyzed by AEX to assess purity (Figure 4). The three fractions exhibited a single major peak indicating suitable purity for structural and biological characterization studies. Fraction 1, representing the most basic species, shows a slightly broader peak profile suggesting possible heterogeneity, however, no detectable overlap with the adjacent peak (fraction 2) was observed. Protein concentrations were determined by UV absorbance at 280 nm using the theoretical extinction coefficient of 1.49 for the Ab-A antibody. Reliable assessment of the relative biological activity (see ELISA section) of the fractions requires accurate protein concentration measurements therefore care was taken to insure that samples were properly diluted to yield A280 values well within the linear range for the assay.
Figure 4.
AEX Separations of Isolated Fractions from Ab-A Force-Oxidized. The two basic peaks, as well as the main peak fraction from semi-preparative AEX of force-oxidized Ab-A were collected, pooled, and concentrated by UF. The purity of the fractionated material as assessed by analytical AEX indicated the samples to be suitable for further characterization by peptide mapping (Figure 4), DSC (Figure 5), and ELISA analysis (Figure 6).
3.5 Tryptic Mapping LC/MS of Ab-A AEX Fractions
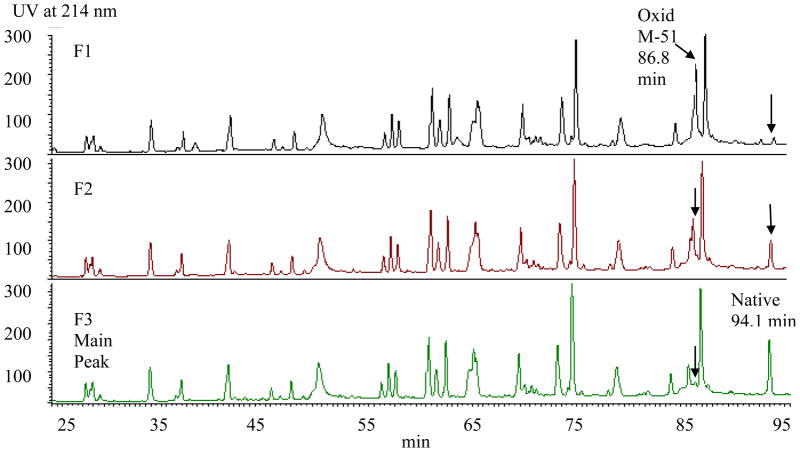
The reversed-phase HPLC profiles of the tryptic digests for the three fractions (basic peaks F1 and F2 and main peak F3) are displayed in Figure 5. The overall peak pattern and intensities appear virtually identical with the exception of the peaks eluting at 86.8 and 94.1 min. The tryptic map of the main peak fraction F3 contains predominantly the peak eluting at 94.1 min representing the native peptide. This peak decreases in the basic peak fractions, F1 and F2, and a concomitant increase in a new, earlier eluting peak at 86.8 min was observed. In order to identify the two peptides represented by the 86.8 and 94.1 min peaks, on-line LC/MS analysis was performed on the three fractions.
Figure 5.
Tryptic Map of Isolated AEX Fractions from Force-Oxidized Ab-A. The two basic peak fractions (F1 and F2) show a new peak eluting at 86.8 min corresponding to the oxidized Met-containing CDR2 peptide. A concomitant decrease is observed for the peak eluting at 94.1 min. representing the native peptide. The relative peaks heights for the oxidized and native peptides in F1 and F2 are consistent with oxidation of the CDR2 methionine on both (F1) or one (F2) heavy chain subunit(s) in the dimeric antibody.
The molecular weights of the peaks eluting at 86.8 min and 94.1 min from the tryptic map of the basic peak fraction F2 were determined to be 1783.0 Da and 1766.8 Da, respectively, by LC/MS analysis (data not shown). The peak with retention time of 94.1 min and mass of 1766.8 Da corresponds to the native heavy chain peptide 44–58. This tryptic peptide encompasses a methionine residue in the CDR2 region. The increased mass of 16 Da for the 86.8 min peak is consistent with oxidation. The tryptic peptide 44–58 also contains a tryptophan residue which could potential undergo oxidation, therefore, tandem MS/MS analysis was performed to localize the specific site of oxidation.
Collision-induced dissociation (CID) of the native and oxidized parent peptides in the ion-trap mass spectrometer produced various sequence ions (data not shown). The majority of the b and y ions resulting from peptide bond cleavage were identified in the native and modified peptides, allowing the unambiguous assignment of oxidation to the methionine residue in CDR2. Oxidation of the tryptophan residue could be definitively ruled out based on the identification of an unmodified fragment ion originating from the native peptide.
Levels of oxidation at the various sites in Ab-A AEX fractions were estimated from the LC/MS ion intensities for the Met-51 containing peptide eluting at 86.8 min. (The three fractions showed similar levels of oxidation at the primary site in the CH2 region of the Fc (62% F1, 66% F2, and 62% F3) suggesting a lack of selectivity based on oxidation at this site. In contrast, oxidation at Met-51 of CDR2 in the most basic fraction F1 was virtually complete (98%) indicating that the residues in both HC subunits were modified while no detectable oxidation at this site was observed in the main peak fraction. Intermediate levels of oxidation (55%) were detected in the basic fraction F2 consistent with modification of one HC subunit. These results demonstrate the selectivity of the AEX HPLC technique for resolving oxidized variants of Ab-A specific to the methionine residue in CDR2. In order to determine whether a conformational change resulting from CDR oxidation in Ab-A could have contributed to the separation of the oxidized variants, differential scanning calorimetry analysis was performed on the Ab-A fractions isolated by semi-preparative AEX (see section 3.7).
3.6 Tryptic Mapping LC/MS of Force-Oxidized Ab-B Antibody
Reversed-phase HPLC analysis was performed on the force-oxidized Ab-B tryptic digest (data not shown) to determine the sites of modification. The oxidized peptides containing the susceptible methionine residues in the CH2 and CH3 regions were identified with levels of 89% and 67%, respectively, as estimated from mass spectrometry ion intensities. Oxidation was not detected at the six other potential sites, including the methionine residue in CDR3 of the heavy chain subunit. It would appear that the CDR3 methionine in Ab-B has a lower surface exposure compared to the methionine residue in CDR2 of Ab-A and is therefore less susceptible to modification. The lack of secondary peaks by AEX HPLC analysis of Ab-B (Figures 2 and 3) at pH 7.5, 7.0 (data not shown), and 6.0 is consistent with peptide mapping results showing no detectable oxidation in the solvent assessable CDR3 of the Fab domain, in contrast to Ab-A which displayed extensive oxidation at the CDR2 methionine.
3.7 Differential Scanning Calorimetry of Force-Oxidized Ab-A Fractions
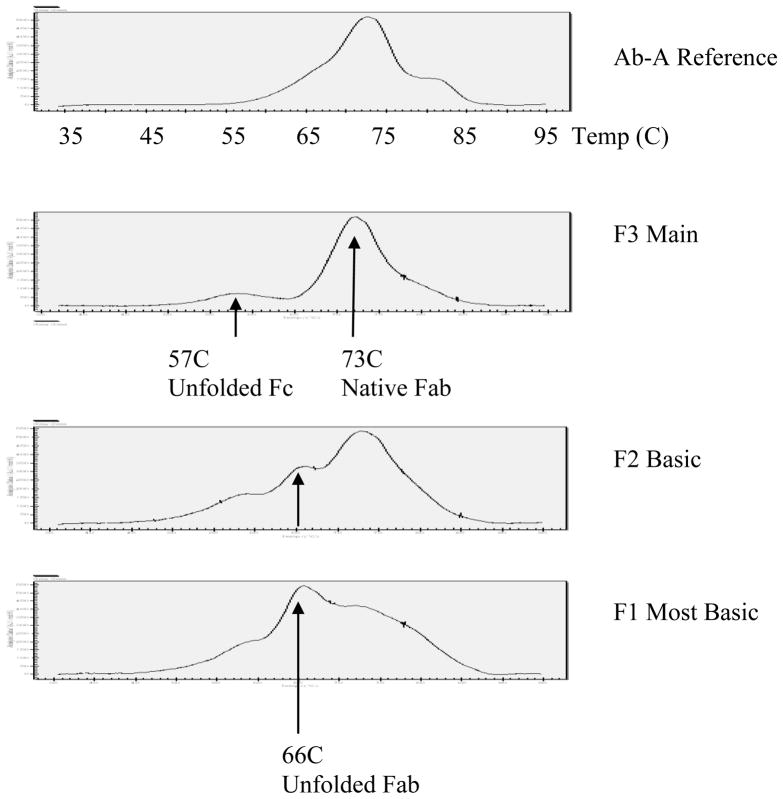
The major thermal temperature transition for the Ab-A reference material was observed at 73C. This transition point represents both the Fab and the CH3 region of the Fc domain (Figure 6, upper panel). The main peak fraction (F3) also exhibits a major transition at 73C. In addition, there is a minor peak at 57C representing unfolded Fc resulting from oxidation at multiple sites in the CH2 and CH3 regions of the Fc as reported by Chumsae [4]. The basic peak fractions F1 and F2 also show a thermal transition at 57C of similar intensity indicating that Fc oxidation is present at similar levels in the three antibody fractions. Hence, the anion-exchange HPLC technique is non-selective for the resolution of Fc oxidized variants.
Figure 6.
Differential Scanning Calorimetry Analysis of Ab-A AEX Fractions. The Ab-A reference shows a typical antibody thermogram with a major temperature transition at 73C. The two basic peak fractions (F1 and F2) exhibit a shift to a lower TM at 66C representing unfolded Fab. The relative intensity for the most basic fraction (F1) characterized as di-oxidized at the CDR2 HC methionine by peptide mapping is approximately twice that of F2 (mono-oxidized). Hence, the results are consistent with partial unfolding of two Fab molecules in F1 and a single Fab in F2 of force-oxidized Ab-A.
In addition to the TM at 57C, the basic peak fractions F1 and F2 exhibit a new intermediate transition at 66°C, absent in the reference and main peak fractions (Figure 5, two lower panels). The intensity of this transition was approximately two fold higher in F1 (oxidized at Met-51 of both HC subunits) than in F2 (mono-oxidized). A concomitant decrease in the high temperature transition at 73°C representing both Fab and the CH3 region of Fc can be observed in the corresponding thermograms. These results are consistent with unfolding of the Fab domain due to oxidation of the CDR2 methionine. The F1 and F2 species, being oxidized at Met-51 in CDR2 of one (F2) or both (F1) Fab domains of the Ab-A antibody, exhibit a shift in the thermal transition temperature from 73C to 66C. The more intense peak at 66C in F1 (di-oxidized) is consistent with partial unfolding of two Fab molecules versus a single Fab in F2 (mono-oxidized).
It would appear that unfolding of Ab-A as demonstrated by the DSC analysis resulted in reduced exposure of acidic residues and/or greater accessibility of basic residues in the vicinity of the CDR2 oxidation site, providing a likely explanation for the dramatic change in retention behavior observed for the oxidized Ab-A variants by anion-exchange HPLC analysis.
3.8 ELISA Binding of Oxidized Ab-A Fractions
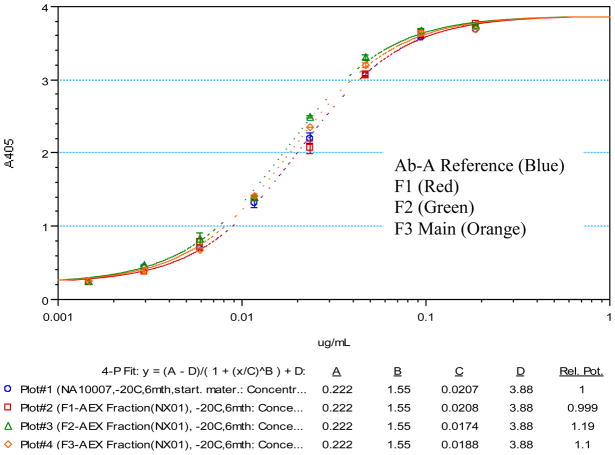
The three Ab-A fractions, mono-oxidized, di-oxidized, and main peak were then tested by enzyme-linked immunosorbent assay (ELISA) to assess the effect of oxidation in the CDR2 region on binding activity. Figure 7 shows the overlays of the dose-dependent sigmoidal curves derived from the oxidized fractions as well as from the Ab-A reference lot. Binding activity from the oxidized fractions was indistinguishable from the reference lot as illustrated by the near identical EC50 values. The EC50 value measures the concentration of antibody required to achieve 50% binding activity. The EC50 values for the oxidized fractions and the reference lot range from 0.017 ug/mL to 0.021 ug/mL. Employing a curve parallelism feature from the Softmax Pro 5.2 software showed that the maximum, minimum, and slope values of all the curves are nearly identical, therefore the sigmoidal curves are essentially superimposable. Hence, by this ELISA method, the oxidized Ab-A antibody fractions retain sufficient capacity to bind the antigen domain of the BoNT/A toxin despite changes in the structure of the Fab domain.
Figure 7.
Binding of AEX Fractions from Ab-A as Determined by ELISA Assay. The overlays of the dose-dependent sigmoidal curves derived from the oxidized fractions as well as from the Ab-A reference lot are shown in Figure 7. Binding activity from oxidized fractions was indistinguishable from the reference lot as illustrated by the near identical EC50 values. The EC50 value measures the concentration of antibody required to achieve 50% binding activity. The EC50 values for the oxidized fractions and the reference lot range from 0.017 ug/mL to 0.021 ug/mL. Employing a curve parallelism feature from the Softmax Pro 5.2 software showed that the maximum, minimum, and slope values of all the curves are nearly identical, therefore the sigmoidal curves are essentially superimposable and all lie well within the range of the standard of deviation.
4 Conclusions
With the growing emphasis by regulatory agencies on the use of orthogonal techniques for assessing the structural integrity of biopharmaceutical products, ion-exchange in the AEX mode provides a “new” approach not previously utilized for antibody analysis. In this study, three monoclonal antibodies comprising the XOMA 3AB drug product were evaluated by both cation and anion-exchange chromatography.
By cation-exchange HPLC analysis, the force-oxidized antibodies (Ab-A, Ab-B, and Ab-C) bound but exhibited broad peak profiles. In contrast, anion-exchange HPLC analysis of the force-oxidized Ab-A (pI=7.6) resulted in the separation of two more basic peaks. The species represented by these peaks were identified by peptide mapping LC/MS as oxidized variants with the site of modification occurring at Met-51 of CDR2 in the Fab domain. DSC analysis showed a decrease in the Fab melting point for the oxidized Ab-A variants compared to the native antibody. The unfolding of the Fab resulting from oxidation in the solvent accessible CDR and the increased accessibility of additional amino acid residues for binding to the stationary phase resin provides a likely explanation for the dramatic change in retention behavior for the oxidized and native Ab-A antibody.
The Ab-B antibody (pI=6.7) also bound to the anion-exchanger at pH 6.0, 7.0, and 7.5 but exhibited only a single major peak for the force-oxidized sample. Mass spectrometric characterization of the tryptic digested force-oxidized Ab-B demonstrated the absence of CDR oxidation; methionyl oxidation was limited to the Fc domain. Hence, the lack of separation of oxidized variants in Ab-B can be explained by the absence of CDR oxidation and the associated changes in local secondary structure which were observed for oxidized Ab-A.
The Ab-C antibody (pI = 8.6) did not bind to the AEX column. Clearly, not all antibodies will be amenable to separation by AEX under the neutral pH mobile phase conditions necessary for maintaining native antibody structure. However, for antibodies with neutral to weakly basic pI, the anion-exchange HPLC technique offers the potential for obtaining selectivities unique from cation-exchange HPLC in the detection of post-translational modifications such as oxidation.
Acknowledgments
This project has been funded in whole or in part with federal funds from the National Institute of Allergy and Infectious Diseases, National Institute of Health, and Department of Health and Human Services under contract number HHSN266200600008C.
Thanks to Becky Dillon for expert assistance in preparation of this manuscript.
Footnotes
Publisher's Disclaimer: This is a PDF file of an unedited manuscript that has been accepted for publication. As a service to our customers we are providing this early version of the manuscript. The manuscript will undergo copyediting, typesetting, and review of the resulting proof before it is published in its final citable form. Please note that during the production process errors may be discovered which could affect the content, and all legal disclaimers that apply to the journal pertain.
References
- 1.Smith TJ, et al. Infection and Immunity. 2005;73(9):5450. doi: 10.1128/IAI.73.9.5450-5457.2005. [DOI] [PMC free article] [PubMed] [Google Scholar]
- 2.Shen FJ, et al. In: Techniques in Protein Chemistry. Marshak DR, editor. Academic Press; San Diego, CA: 1996. p. 75. [Google Scholar]
- 3.Houde D, et al. J Chromatogr A. 2004;1053:299. [Google Scholar]
- 4.Chumsae C, et al. J Chromatogr B. 2007;850:285. doi: 10.1016/j.jchromb.2006.11.050. [DOI] [PubMed] [Google Scholar]
- 5.Lam XM, et al. J Pharm Sci. 1997;86:1250. doi: 10.1021/js970143s. [DOI] [PubMed] [Google Scholar]
- 6.Liu D, et al. Biochemistry. 2008;47:5088. doi: 10.1021/bi702238b. [DOI] [PubMed] [Google Scholar]
- 7.Cordoba AJ, et al. J Chromatogr B, Anal Technol Biomed Life Sci. 2005;818:115. doi: 10.1016/j.jchromb.2004.12.033. [DOI] [PubMed] [Google Scholar]
- 8.Manning MC, et al. Pharm Res. 1989;6:903. doi: 10.1023/a:1015929109894. [DOI] [PubMed] [Google Scholar]
- 9.Chelius D, et al. Anal Chem. 2006;78:2370. doi: 10.1021/ac051827k. [DOI] [PubMed] [Google Scholar]
- 10.Rheder DS, et al. J Chromatogr A. 2006;1102:164. doi: 10.1016/j.chroma.2005.10.053. [DOI] [PubMed] [Google Scholar]
- 9.Moorhouse KG, et al. J Pharm Biomed Anal. 1997;16:593. doi: 10.1016/s0731-7085(97)00178-7. [DOI] [PubMed] [Google Scholar]
- 10.Liu H, et al. J Chromatogr B. 2006;837:35. doi: 10.1016/j.jchromb.2006.03.053. [DOI] [PubMed] [Google Scholar]
- 11.Cohen S, et al. J Am Chem Soc. 2007;129:6976. doi: 10.1021/ja0705994. [DOI] [PubMed] [Google Scholar]
- 12.Gaza-Bulseco, Liu H. Pharm Res Vol. 2008 doi: 10.1007/s11095-008-9606-3. [DOI] [PubMed] [Google Scholar]
- 13.Xiao G, et al. J Pharm Biomed Anal. 2008;47:23. doi: 10.1016/j.jpba.2007.11.050. [DOI] [PubMed] [Google Scholar]
- 14.Schauenstein E, et al. Int Arch Allergy Immunol. 1986;80:174. [Google Scholar]
- 15.Horejsi R, et al. J Biochem Biophy Methods. 1997;34:227. doi: 10.1016/s0165-022x(97)00015-8. [DOI] [PubMed] [Google Scholar]
- 16.Chu G, et al. Pharm Res. 2007;24(6):1145–1156. doi: 10.1007/s11095-007-9241-4. [DOI] [PubMed] [Google Scholar]
- 17.Teshima G, et al. J Biol Chem. 1991;266:13544. [PubMed] [Google Scholar]
- 18.Harris RJ, et al. J Chromatogr B. 2001;752:233. doi: 10.1016/s0378-4347(00)00548-x. [DOI] [PubMed] [Google Scholar]
- 19.Huang L, et al. Anal Chem. 2006;77:1432. doi: 10.1021/ac0494174. [DOI] [PubMed] [Google Scholar]
- 20.Chelius D, et al. Anal Chem. 2005;77:6004. doi: 10.1021/ac050672d. [DOI] [PubMed] [Google Scholar]
- 21.Cournoyer JJ, et al. Anal Chem. 2006;78:1264. doi: 10.1021/ac051691q. [DOI] [PubMed] [Google Scholar]
- 22.Cacia J, et al. Biochemistry. 1996;36:1897. doi: 10.1021/bi951526c. [DOI] [PubMed] [Google Scholar]
- 23.Harris RJ, et al. J Chromatogr A. 1995;705:129. doi: 10.1016/0021-9673(94)01255-d. [DOI] [PubMed] [Google Scholar]
- 24.Johnson KA, et al. Anal Biochem. 2007;360:75. doi: 10.1016/j.ab.2006.10.012. [DOI] [PubMed] [Google Scholar]
- 25.Harris RJ. State of the Art Analytical Methods for the Characterization of Biological Products and Assessment of Comparability. In: Mire-Sluis AR, editor. Dev Biol (Basel) Vol. 122. Basel: Karger; 2005. p. 117. [Google Scholar]
- 26.Valliere-Douglass, et al. J Chromatogr A. 2008;1214:81. doi: 10.1016/j.chroma.2008.10.078. [DOI] [PubMed] [Google Scholar]


