Abstract
We demonstrate detection of whole viruses and viral proteins with a new label-free platform based on spectral reflectance imaging. The Interferometric Reflectance Imaging Sensor (IRIS) has been shown to be capable of sensitive protein and DNA detection in a real time and high-throughput format. Vesicular stomatitis virus (VSV) was used as the target for detection as it is well-characterized for protein composition and can be modified to express viral coat proteins from other dangerous, highly pathogenic agents for surrogate detection while remaining a biosafety level 2 agent. We demonstrate specific detection of intact VSV virions achieved with surface-immobilized antibodies acting as capture probes which is confirmed using fluorescence imaging. The limit of detection is confirmed down to 3.5×10⁵ plaque-forming units/mL (PFUs/mL). To increase specificity in a clinical scenario, both the external glycoprotein and internal viral proteins were simultaneously detected with the same antibody arrays with detergent-disrupted purified VSV and infected cell lysate solutions. Our results show sensitive and specific virus detection with a simple surface chemistry and minimal sample preparation on a quantitative label-free interferometric platform.
Keywords: Virus detection, Label-free, Interferometry, Biosensor, High-throughput, Microarray, Quantitative sensing
1. Introduction
Clinical pathogen detection and identification are generally performed in a laboratory environment where patient samples are processed on the order of days. Identification requires that large sample volumes are subjected to a variety of standard assays such as complement fixation, different formats of polymerase chain reaction, immunoassay techniques such as enzyme-linked immunosorbent assays (ELISAs), and virus isolation through cell culture followed by immunocytological confirmation [Stamboulian et al., 2000, Amano, Cheng, 2005]. Though reliable, these methods can be cumbersome and time-consuming, expensive, and generally require specialized equipment, personnel, and environments to achieve confident diagnoses [Charlton et al., 2009].
New approaches to pathogen detection with proteomic and genomic microarray formats are being actively investigated in biomedicine and health care as well other industrial sectors including environmental and agricultural monitoring, biowarfare response, and food processing and manufacture. The use of microarrays naturally leads to highly parallel detection and, in combination with microfluidics, point-of-care (POC) testing as a viable on-site option for rapid diagnosis with limited sample volumes. Integrating these attributes into a single system could benefit many scenarios though improved diagnostic speed, throughput, ease-of-use, and lowered cost [Baner et al., 2007, Baxi et al., 2006, Boonham et al., 2002]. For example, rapid on-site detection can be critical for minimizing damage when responding to a biowarfare attack, and early phase and specific identification are crucial to containment and reducing mortality and morbidity rates during sudden outbreaks of viral hemorrhagic fevers (VHFs) that normally present with non-specific symptoms. In the case of Influenza A, a potential biowarfare agent, detection of multiple viral proteins can increase assay confidence in the presence of genetic modifications and antigenic mutations [Krug, 2003]. Finally, high-throughput and specific antibody-based microarray platforms can provide serotype information in categorical and epidemiological studies and lead to greater understanding of pathogen spread, mutation, and resistance.
The transduction mechanism of a detection system is another important consideration which has impacted microarray and high-throughput data collection. Biomolecular interactions are normally observed with the use of labels such as radioisotopes, fluorophores, and enzymes. However, disadvantages associated with the use of labels have spurred interest in the development of label-free modalities for monitoring molecular binding events. Surface plasmon resonance (SPR) technology is a leading example of an optical label-free sensing system with many other non-optical technologies such as piezoelectric cantilever arrays, quartz crystal microbalance sensors, and surface acoustic wave devices all garnering interest in virus detection applications [Olsen et al., 2006, Bisoffi et al., 2008, Campbell, Mutharasan, 2006, 2007, 2007, 2008]. Though SPR is a highly-developed and powerful sensing platform, it still has limitations including low multiplexing capacity, portability, and cost effectiveness, stimulating more research into other optical label-free techniques [Homola et al., 2003, Chinowsky et al., 2007, Feltis et al., 2008]. Though labels provide great sensitivity through signal amplification, this benefit comes at the cost of other technical drawbacks. In the case of immunoassays that normally utilize labeled secondary antibodies for detection, the use of these antibodies introduces complications such as increased assay cost and time as well as variability associated with the use of the labels themselves that are due to fluorescence lifetime and quenching, changes in protein functionality, storage and safety concerns, optimization of labeling and overall assay function with each reagent. Additionally, combining the benefits of microarray throughput and label-free sensing could allow different modes of detection to be made on the same sensor such as simultaneous host antibody, viral DNA/protein, and whole virion detection to increase assay specificity and confidence.
We present here the use of a new label-free optical biosensor, termed the Interferometric Reflectance Imaging Sensor (IRIS), for detecting viral proteins and whole, intact pathogens. The IRIS platform has been used to quantify biomolecular interactions such as antibody-antigen binding and DNA denaturation and has demonstrated a high level of sensitivity, reproducibility, and throughput [Özkumur et al., 2008, 2010]. The benefits of this system include multiplex imaging capacity, real time and quantitative measurement capabilities, rapid data acquisition and assaying times, and other high-throughput attributes such as reduced reagent consumption. Additionally, the IRIS platform is simple to use, relies on well-known interferometric techniques, requires inexpensive equipment, and is amenable to contemporary microfluidic and silicon-based solid phase assay components and chemistries. Vesicular stomatitis virus (VSV) was used as the target for detection in the experiments detailed here. VSV is well-characterized for its protein, nucleic acid, and lipid content, size and structure, and it can be genetically modified to express proteins from other more dangerous pathogens, such as the VHF viruses [Tani et al., 2007]. VSV is also a biosafety level 2 agent and is safe to use as it normally only infects cattle, horses, swine, and rodents.
2. Materials and Methods
2.1. IRIS system and detection method
The principles of IRIS have been detailed elsewhere [Özkumur et al., 2008, 2010, Daaboul et al., 2010]. Briefly, a layered substrate composed of thermally grown SiO2 on Si is used as the solid support for immobilization of biomolecules. Illumination of this layered structured at multiple, discrete wavelengths produces a characteristic interference signature that is dependent on the oxide thickness and any accumulated biomass. Intensity images at each wavelength are captured by a CCD camera allowing a hyperspectral data cube to be collected. Temporal illumination variability is corrected using either a single-cell photodetector (laser source) or an on-chip bare silicon reference region (LED source) [Özkumur et al., 2009, Vedula et al., 2010]. Hyperspectral data is processed to find the total optical thickness of the oxide and accumulated biomaterial at each pixel for the entire field of view. The biolayer thickness of each microarray spot is determined by taking the difference between the average optical thickness included in a circle within the spot and the average optical thickness included in an annulus surrounding the spot [Özkumur et al., 2009]. The Silicon substrates (Silicon-Valley Microelectronics), tunable laser (NewFocus – TLB6300), LEDs (PerkinElmer – AcuLED), CCD camera (Q-Imaging – Rolera-XR), and photodetector (Thorlabs – PDA65) were purchased from commercial vendors. Instruments were controlled by either Labview (National Instruments) or MatLab (Mathworks) during data acquisition and all data processing was done in Matlab using custom-coded algorithms.
2.2. Surface functionalization
To immobilize antibody capture probes a polymer-based surface functionalization was utilized. This polymeric coating has been described in detail elsewhere [Cretich et al., 2004, Pirri et al., 2004]. Briefly, clean SiO2 surfaces are treated for 30 min. with 0.1 M NaOH to prepare the oxide surface and to facilitate the adsorption process of the copolymer which is composed of (N,N-dimethylacrylamide (DMA) - Acryloyloxysuccinimide (NAS)) - (Trimethoxysilyl)-propyl methacrylate) (MAPS)). The surfaces are thoroughly rinsed with deionized (DI) H2O and then immersed in the copolymer solution for 30min, washed extensively with DI water, dried with argon, and baked in an oven at 80°C for 15 min. The presence of the reactive succinimide component of the copoly(DMA-NAS-MAPS) enables covalent attachment of biomolecules through accessible primary amine groups and efficient hybridization/binding of DNA and proteins when compared to epoxysilane surfaces while the dimethylacrylamide and trimethoxysilyl components ensure adsorption and stability, respectively [Yalcin et al., 2009, Cretich et al., 2010].
2.3. Probe immobilization
Copolymer-coated chips were used for all the experiments described here. Antibody probes were spotted at a concentration in the range of 0.25 to 0.5 mg/mL in phosphate buffered saline (PBS) at pH=7.4. Depending on the experiment, the following antibodies/proteins were immobilized as 2 identical grids consisting of 10 replicates for each different probe: anti-VSV-G (monoclonal 8G5, monoclonal 1E9), anti-VSV-M (monoclonal 23H12), anti-VSV-N (monoclonal 10G4), anti-Vaccinia (Lister strain, polyclonal), rabbit/mouse immunoglobulin G (IgG), human or bovine serum albumin (HSA/BSA). VSV antibodies were graciously supplied by J.H. Connor. The commercially available anti-Vaccinia (#ab35219) and anti-VSV-G (#ab27026) antibodies were purchased from Abcam, Inc. (Cambridge, MA). Spotting was achieved using a BioOdyssey™ Calligrapher™ MiniArrayer (Bio-Rad). Immediately after spotting all chips were left in a humid environment overnight and washed the following day for excess adsorbed probe. The washing procedure was performed in a low power sonicator as follows: chips were submerged in PBS with 0.1% Tween-20 (PBST) three times for three minutes each, followed by PBS three times for three minutes each, and lastly, stored in fresh PBS at 4 °C until use.
2.4. Virus sample preparation and incubations
Wild-type (WT) VSV sample solutions were prepared using either a stock of fluorescently-labeled virus at a concentration of 109 plaque-forming units/mL (PFUs/mL) or non-labeled virus at a concentration of 3.5×10⁹ PFUs/mL. These solutions were then further diluted in PBS or Dulbecco’s modified Eagle’s media (DMEM) with 7% fetal bovine serum (FBS) to make varying concentrations in the range of 109 to 104 PFUs/mL. All solutions were well-mixed prior to incubation with low speed vortexing. Lysed virus samples were prepared using NP-40 lysis buffer, low power sonication, and entrifugation followed by filtration to remove unwanted particulate matter. Incubations were performed by submerging the antibody-functionalized substrates in each solution with continuous agitation, from 0.5 to 18.5 hours, followed by a short wash in PBST, PBS, and then DI water prior to measurement.
3. Results
3.1. Whole virion endpoint detection and fluorescence confirmation
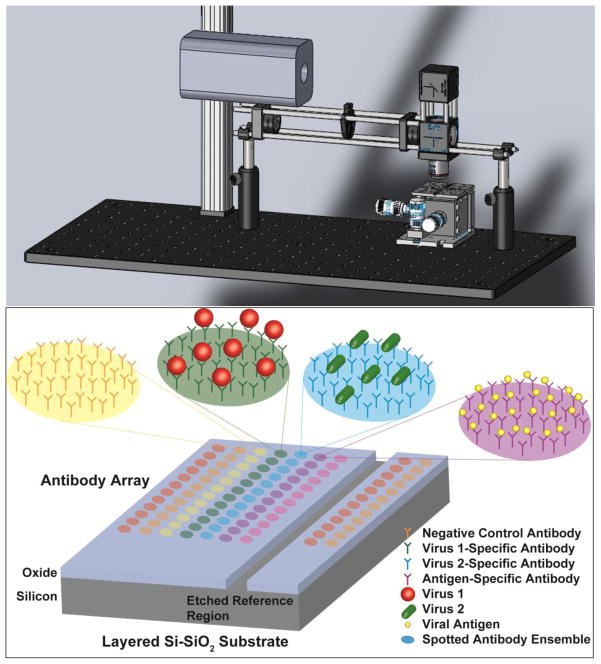
The IRIS instrument is a simple design consisting of 4 main components. The current platform can be seen in Figure 1 and is composed of an illumination source (Laser or LED), the optical components needed for properly illuminating the sensor substrate (lenses, objective, beam splitter, etc.), an x-y-z stage, and a CCD camera for recording the substrate-reflected light intensities. A representative diagram of the antibody-functionalized arrays used in these experiments is also presented in Figure 1. Protein detection with the IRIS platform has been demonstrated in previous experiments [Daaboul et al., 2010]. Virus detection, which similarly relies on viral coat protein recognition by surface-immobilized antibodies, is investigated here. Virus sensing employing this approach could introduce detection and quantification problems including high levels of non-specific interactions with the sensor surface due to non-antigenic viral components, decreased target capture due to surface-related-transport problems and steric hindrance, and increased light scattering due to the larger size of the bound viral targets. Therefore, confirmation of the measured IRIS signal is required to eliminate uncertainty in the collected label-free data due to the above mentioned reasons and allow for reliable quantification of the bound mass. To this end, fluorescently-labeled WT VSV was incubated with antibody-functionalized surfaces for both label-free and fluorescence measurements. Chips were spotted with four different antibodies: mouse IgG, anti-Vaccinia, and two different monoclonal antibodies for the external glycoprotein of VSV (clones 8G5 and 1E9). The results shown in Figure 2 demonstrate that specific detection was achieved for the expected antibody probes due to the significantly increased spot heights for the anti-VSV probes. The array shown in Figure 2 was imaged for fluorescence associated with bound virus particles and the results were well correlated to the label-free image. Minimal binding above the background for VSV was seen in the label-free image at the mouse IgG and anti-Vaccinia probes. This was confirmed by the fluorescence image where a small amount of bound virus was observed at these spots, indicating some non-specific binding of the labeled virus to control areas of the arrays. Column E of the prepared arrays was left blank (without spotted probes) and after label-free and fluorescence measurements, did not show any measurable binding. Comparison with the polymeric background indicated that very little non-specific binding was observed on these regions of the surface supporting the use of this polymer for virus sensing applications.
Figure 1.
(Top) The IRIS system showing the CCD camera, x-y-z sample stage, and light source and optical components required for illumination of the sensing area (antibody array). (Bottom) Schematic of the layered Si-SiO2 substrate spotted with a representative antibody array. Each antibody ensemble is spotted in replicate with specificity for a different epitope targeting different viral coat proteins (whole virus detection) or internal proteins (lysed virus detection). Negative control antibodies depend on the assay and can be non-specific and virus-specific.
Figure 2.
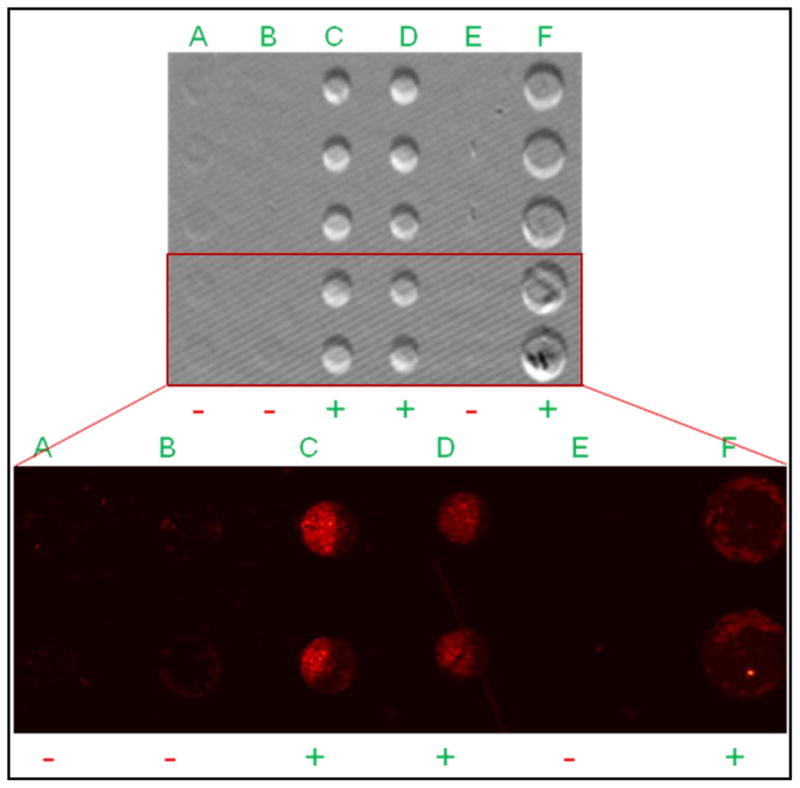
Qualitative confirmation of label-free detection of whole WT VSV. Fluorescently-labeled VSV was incubated with a surface that had immobilized: A) mouse IgG, B) anti-Vaccinia, C & D) anti-VSV (clone 8G5), E) blank area control, F) anti-VSV (clone 1E9). A magnified fluorescence image shown below the label-free image demonstrates a correlation to the IRIS data for the exact same area, with positive and negative signs indicating significant and insignificant binding respectively. Greater fluorescence was observed for the expected probes (C, D, & F) while minimal fluorescence, indicating some non-specific binding, was observed for the other two probes (A, B) confirming the measured label-free signal.
3.2. Sensitivity testing – whole virus
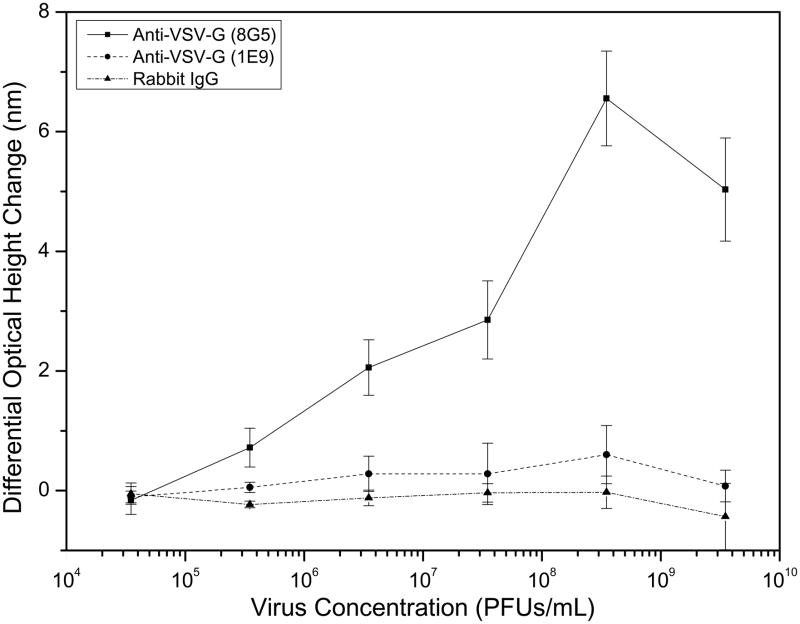
An important parameter for any detection method is the sensitivity of the system to decreasing concentrations of target in a sample. To determine the limit of detection (LOD) for the sensing of whole intact virus particles in an endpoint format with the IRIS platform, different dilutions of unlabeled WT VSV were incubated with separate, but identically prepared chips. The results from this experiment can be seen in Figure 3. A stock virus solution was diluted in PBS from 3.5×10⁹ to 3.5×10⁴ PFUs/mL to create six samples that were incubated with six identical chips. PFUs, a common functional measure employed in virology, represents the number of virus particles that are infectious by counting the formation of plaques in a cultured cell assay. This value will differ between viruses and is less than the total number of virus particles in the sample as some will be unable to infect a host cell. These six chips were spotted with two monoclonal antibodies specific for the external glycoprotein of WT VSV and rabbit IgG acting as the control. Increasing spot height changes were observed for the increasing concentrations of each of the VSV samples for the 8G5 monoclonal antibody. Significant changes, compared to the rabbit IgG spots, were observed for concentrations above 3.5×10⁴ PFUs/mL indicating a detection limit close to 105 PFUs/mL for the sensing of intact unlabeled VSV in solution. In a recent similar study, results reported for a label-free optofluidic nanoplasmonic sensor demonstrate a LOD near 106 PFUs/mL for intact VSV [Yanik et al., 2010]. A consistent, yet small height increase was observed for the 1E9 monoclonal probe which indicates that antibody functionality can be an important factor in improving LOD for this system, which may not yet be limited by instrument sensitivity.
Figure 3.
Limit of detection analysis of the IRIS platform for whole VSV virion detection. Increasing concentrations of WT VSV solutions demonstrated corresponding changes in the spot heights of the two monoclonal, viral glycoprotein-specific antibody probes. Greater binding was observed for monoclonal 8G5 over the 1E9 clone indicating that antibody (probe) affinity is an important factor in increasing the assay LOD. Minimal non-specific binding was observed for the control rabbit IgG spots for all virus concentrations. The binding assay protocol used here results in a LOD close to 105 PFUs/mL.
3.3. Specific detection in complex solutions – whole virus
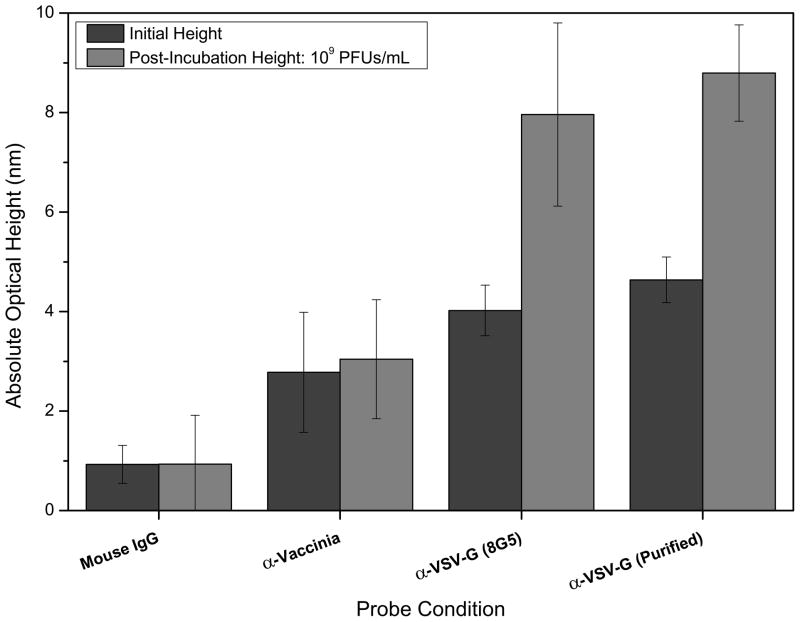
Clinical detection of whole virus is rarely performed in simple solutions and in some cases, such as in environmental monitoring, with contaminated or ‘dirty’ preparations. Normally, solutions containing a diverse array of proteins, other macromolecules, and contaminant microorganisms are used as samples. The presence of these substances can often lead to non-specific binding and a decrease in confidence for clinical diagnoses. Figure 4 shows the initial and post-incubation spot heights for specific detection of VSV in a sample solution of DMEM with 7% FBS. At a concentration of 109 PFUs/mL, the spot height changes for the anti-VSV (purified and non-purified monoclonal 8G5) were on the order of 4 nm. Here, minimal non-specific binding was observed for the anti-Vaccinia and mouse IgG control spots. In addition to a standard preparation of the 8G5 monoclonal, a purified solution was spotted to determine if probe functionality or binding capacity could be improved. Statistically comparable results were observed for these two solutions.
Figure 4.
Detection of whole VSV in a complex sample (DMEM containing 7% FBS). At a target concentration of 109 PFUs/mL, significant spot height changes were observed for the glycoprotein specific antibody probes, with minimal non-specific binding to the Vaccinia antibody and mouse IgG control probes. Two preparations of the anti-VSV-G 8G5 monoclonal were tested to determine if purification could improve probe functionality.
3.4. Viral protein detection
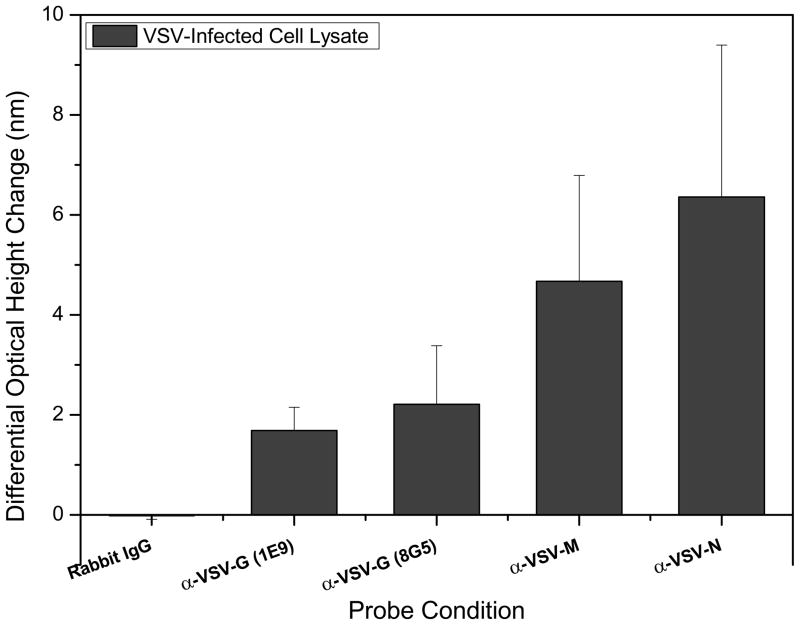
As an alternate or complementary approach to pathogen sensing, VSV-derived proteins were detected using a combination of probes that were specific for both the external glycoprotein and internal structural proteins. Antibodies specific for the two major internal proteins, the nucleocapsid (N) and matrix (M) proteins, were used to capture their corresponding antigens in a complex mixture of viral components. These were chosen based on the relative amounts of each of these proteins in a whole intact virion. It has been reported that a single VSV virion contains approximately 1,826, 1,258, and 1,205 copies for the M, N, and G proteins, respectively [Thomas et al., 1985]. As a first approach, cell lysate from VSV-infected cells was used as used the target sample solution. The results from this experiment can be seen in Figure 5. Here, the immobilized probes were two monoclonal antibodies targeting different epitopes of the coat glycoprotein, two different monoclonal antibodies specific for the M and N proteins, and a rabbit IgG control. Specific detection was achieved at all the expected probes with the greatest spot height changes found for the internal M and N proteins of over 5 nm. Significant detection was also achieved for the two different glycoprotein-specific monoclonals, again, with slightly more binding observed for monoclonal 8G5 over 1E9. Not unexpectedly, the rabbit IgG control probe showed a negligible change in mean optical height.
Figure 5.
IRIS detection of external and internal viral proteins in VSV-infected cell lysate solutions. Antibodies specific for the internal matrix (M) and nucleocapsid (N) proteins, two different monoclonal antibodies for the coat glycoprotein (G), and a non-specific rabbit IgG control solution were spotted. Significant detection was achieved for all virus-specific probes with the greatest changes observed for the internal proteins. A negligible height change was observed for the mean of the control spots indicating that there was no binding to the control rabbit IgG spots.
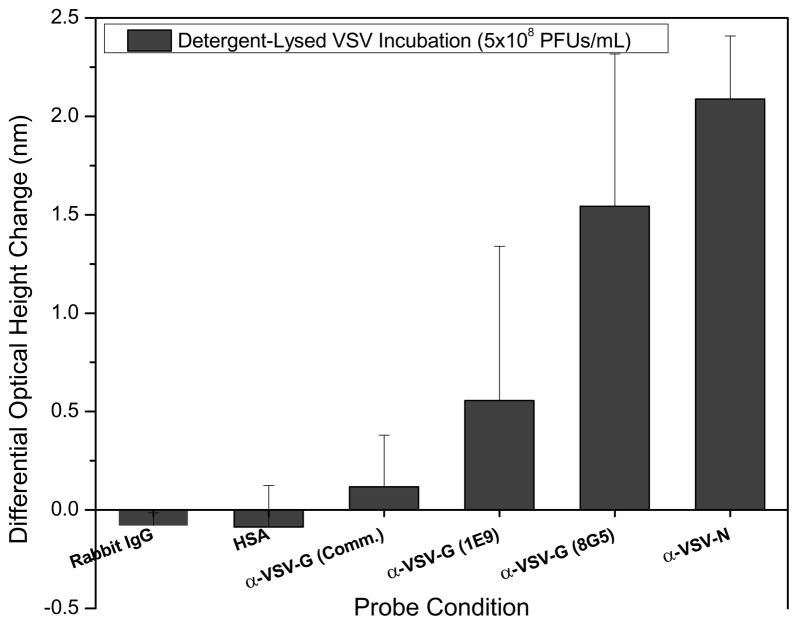
To mimic the preparation of viral protein solutions from patient samples, a simple lysing approach utilizing the detergent NP-40, was used to release the M, N, and G proteins from whole VSV virions. Figure 6 shows the results of detection of these viral antigens in DMEM with 7% FBS for a virus concentration of 5×10⁸ PFUs/mL. Six probes were immobilized to test for the capture of the three viral protein targets: a monoclonal antibody specific for the N protein, the 8G5 and 1E9 glycoprotein-specific monoclonals, a commercially available polyclonal antibody mixture specific for VSV-G, and rabbit IgG and human serum albumin (HSA) acting as controls. As earlier experiments have demonstrated and as would be expected, IRIS optical height change measurements are well correlated to the concentration of target in solution with greater changes observed for more concentrated solutions. For detection of the N protein, with the largest increase at 2.2 nm, significant release of this protein with minimal sample preparation was achieved. Significant height changes for VSV-G were observed for both of the monoclonal antibody probes at values near 1.5 and 0.5 nm. The spot height changes measured for the commercially available G protein-specific polyclonal probes were much smaller at approximately 0.1 nm, demonstrating a greatly decreased efficiency in binding and capture with this antibody mixture. The differences in binding observed for each antibody underscores the need for pure, high-affinity reagents to improve detection capacity. Though the measured changes in the control spot heights were found to be negative, the variance observed in these measurements supports insignificant deviations for these probes. A slight decrease in the measured optical heights could be due to non-specific protein binding to the copolymer background. This data supports the use of a simple detergent-based approach to viral protein release for microarray detection using the IRIS platform.
Figure 6.
IRIS protein detection of detergent-disrupted VSV virus solutions. Two different monoclonal antibodies for the coat glycoprotein (G), a commercially-available polyclonal for VSV-G, and an antibody targeted at the internal nucleocapsid (N) protein were used as specific probes. Non-specific rabbit IgG and human serum albumin (HSA) solutions were spotted as control probes. Viral lysis and subsequent protein release was achieved with a solution containing 0.5% NP-40. Significant detection of G and N proteins without non-specific binding to the control probes was achieved at a VSV concentration of 5×10⁸ PFUs/mL. The commercially available antibody specific for VSV-G demonstrated minimal binding of approximately 0.12 nm.
4. Discussion
The demand for rapid pathogen detection using a simple and inexpensive platform in both the developed and developing world has increased significantly in recent decades. The results for virus detection presented here, utilizing an interferometric technique known as IRIS, demonstrate the versatile capabilities of this system for pathogen detection applications which demand rapid, sensitive, quantitative, and high-throughput measurements. Sensitive whole virus detection was achieved with complex solutions containing a wide variety of proteins, minimal sample preparation and manipulation, a robust and easily applied surface chemistry, and facile multi-probe sensor surface spotting for high-throughput sensing. Label-free measurements for whole VSV detection in Figure 2 were well correlated to fluorescent images obtained for the same probe array. Qualitative confirmation of label-free results was important to remove any uncertainty in the specificity of probe-target binding due to interactions other than antibody-antigen recognition. Fast label-free image acquisition can be a rapid method to determine the presence of whole virus or proteins in a sample, without the need for time-consuming or rigorous analyses of probe spot mass density changes, to provide a qualitative result for pathogen sensing. Flexibility with system parameters such as assay speed, sensitivity, and measurement style allows the end user to tailor data generation for different needs. Sensitivity analysis of whole virus detection demonstrated a LOD near 105 PFUs/mL with longer incubation times, exposing the diffusion-limited nature of viral transport to the antibody array. The imaging nature of the IRIS platform lends itself to integration with microfluidic sample preparation and target delivery and this may be a method to improve overall assay speed. Considering other types of diagnostic platforms such as electron microscopy, which has been cited as a rapid method for pathogen identification, a range of 106 and 108 particles/mL depending on the sample preparation method, may be required [Hazelton, Gelderblom, 2003]. Though clinically-relevant virus concentrations vary widely depending on the insulting pathogen, a common diagnostic threshold that is used to identify chronic hepatitis B infection with PCR techniques is 105 copies/mL of viral DNA [Servoss, Friedman, 2006]. SPR has been used to detect whole viruses and antibodies generated from a host response however this is a relatively new application for this type of sensor. Sensing of influenza A virus has been demonstrated with SPR; this technique has a sub-nanogram detection limit and based on the molecular weight of the virus, a value of 106 virions has been estimated as a corresponding particle number [Amano, Cheng, 2005]. As an empirical comparison, SPR has been used to detect intact virions of the insect pathogen baculovirus Autographa californica achieving a measured signal of 0.0378° for the angle shift which correlates to a LOD of 107 PFUs/mL for the virus concentration [Baac et al., 2006].
Results for VSV protein detection, a complementary approach to intact virus sensing, suggest that the identification of internal viral proteins can also be utilized to provide increased assay confidence and specificity. All of the proteins which are found in high abundance in VSV were detected demonstrating that redundant measurement of unique viral components could provide a way to identify pathogens given the possibility of antigenic mutation (ex: antigenic shift/drift) or genetic modification The use of many specific (monoclonal) antibodies in a microarray format could allow for serodiagnosis and direct pathogen detection of patient samples [Burgess et al., 2008]. Additionally, these results support the use of this platform with complex solutions as the current surface chemistry and sample preparation procedures for antigen binding provided specific detection. The utility of this becomes obvious when considering that patient samples may be derived from numerous bodily fluids and tissues. The approach utilized here can also be easily applied to larger pathogens such as bacteria and multicellular parasites considering the large and diverse amount of protein markers that may be found in such samples.
The IRIS platform has previously been used to measure DNA interactions; the simultaneous detection of PCR-amplified genetic material and isolated viral proteins is another method that could be used to increase assay/detection confidence [Özkumur et al., 2009]. Use of on-chip PCR processing could lead to a multi-faceted approach for point-of-care detection of many different infectious agents. The evolution of this system is moving toward a POC platform; elimination of the laser, photodetector, and moving components, leading to a significant reduction in device cost, have been achieved with LED illumination sources and on-chip referencing (Daaboul et al., 2010, Vedula et al., 2010). Current work funded by the Coulter Translational Partnership and Ignition Award Program at Boston University has produced a robust device with significantly reduced dimensions for improved portability.
5. Conclusions
The experiments detailed here indicate that the IRIS platform can be extended to pathogen detection in two different formats: whole virion or viral protein sensing. VSV was used to demonstrate sensitive detection down to 3.5×10⁵ PFUs/mL. Qualitative confirmation of these label-free measurements was achieved using fluorescently-labeled VSV. Additionally, discriminating viral protein detection was achieved with infected-cell lysate solutions and a simple sample preparation of detergent-lysed virus. Three different internal and external viral components were identified against control probes in complex solutions containing proteins from infected cells and those found in serum. Detection was rapid, repeatable, and demonstrates the potential of this system for inexpensive clinical and field-capable pathogen diagnostics.
Supplementary Material
Figure S1. Schematic of the IRIS data collection process. The binding measurement is performed on a functionalized layered substrate before and after incubation with a target sample. This substrate, functionalized with immobilized capture probes (ex: antibodies) is illuminated at multiple wavelengths which produces a characteristic interference signature that is dependent on the optical path length of the SiO2 plus any accumulated biomass. Changes in the biomass layer density (modeled as thickness) produce a shift in the interference signature leading to quantitative binding information. Eq. 1 approximates the reflection coefficient of a single oxide layer while Eq. 2 is used to calculate the optical phase difference between reflections from the top layer and the buried Si-SiO2 interface. Here, the incident light is perpendicular to the surface (θ=0°). Eq. 1 is fitted to the empirical spectral reflectance data to determine the optical path length difference at each image pixel which is interpreted as material thickness at that location and is subsequently converted to biomass surface density.
Acknowledgments
We would like to thank Marcella Chiari and members of the Institute of Molecular Recognition, National Research Council of Italy, for the kind use of the copolymeric surface chemistry used in these studies. Funding for this research was generously provided by the US Army Research Laboratories (ARL) grant W911NF-06-2-0040 and the National Institutes of Health (NIH) grant R21 GM074872-01A1.
Footnotes
Publisher's Disclaimer: This is a PDF file of an unedited manuscript that has been accepted for publication. As a service to our customers we are providing this early version of the manuscript. The manuscript will undergo copyediting, typesetting, and review of the resulting proof before it is published in its final citable form. Please note that during the production process errors may be discovered which could affect the content, and all legal disclaimers that apply to the journal pertain.
References
- Stamboulian D, Bonvehi PE, Nacinovich FM, Cox N. Infect Dis Clin North Am. 2000;14 (1):141–166. doi: 10.1016/s0891-5520(05)70222-1. [DOI] [PubMed] [Google Scholar]
- Amano Y, Cheng Q. Anal Bioanal Chem. 2005;381 (1):156–164. doi: 10.1007/s00216-004-2927-0. [DOI] [PubMed] [Google Scholar]
- Charlton B, Crossley B, Hietala S. Comp Immunol Microbiol Infect Dis. 2009;32 (4):341–350. doi: 10.1016/j.cimid.2008.01.009. [DOI] [PubMed] [Google Scholar]
- Baner J, Gyarmati P, Yacoub A, Hakhverdyan M, Stenberg J, Ericsson O, Nilsson M, Landegren U, Belak S. J Virol Methods. 2007;143 (2):200–206. doi: 10.1016/j.jviromet.2007.03.004. [DOI] [PubMed] [Google Scholar]
- Baxi MK, Baxi S, Clavijo A, Burton KM, Deregt D. Vet J. 2006;172 (3):473–481. doi: 10.1016/j.tvjl.2005.07.007. [DOI] [PubMed] [Google Scholar]
- Boonham N, Walsh K, Smith P, Madagan K, Graham I, Barker IJ. Virol Methods. 108:181–187. doi: 10.1016/s0166-0934(02)00284-7. [DOI] [PubMed] [Google Scholar]
- Krug RM. Antiviral Res. 2003;57 (1,2):147–150. doi: 10.1016/s0166-3542(02)00207-3. [DOI] [PubMed] [Google Scholar]
- Olsen EV, Sorokulova IB, Petrenko VA, Chen I–H, Barbaree JM, Vodyanoy VJ. Biosens Bioelectron. 2006;21 (8):1434–1442. doi: 10.1016/j.bios.2005.06.004. [DOI] [PubMed] [Google Scholar]
- Bisoffi M, Hjelle B, Brown DC, Branch DW, Edwards TL, Brozik SM, Bondu-Hawkins VS, Larson RS. Biosens Bioelectron. 2008;23 (9):1397–1403. doi: 10.1016/j.bios.2007.12.016. [DOI] [PubMed] [Google Scholar]
- Campbell GA, Mutharasan R. Anal Chem. 2006;78 (7):2328–2334. doi: 10.1021/ac0517491. [DOI] [PubMed] [Google Scholar]
- Campbell GA, Mutharasan R. Environ Sci Technol. 2007;41 (5):1668–1674. doi: 10.1021/es061947p. [DOI] [PubMed] [Google Scholar]
- Campbell GA, Mutharasan R. Anal Chem. 2007;79 (3):1145–1152. doi: 10.1021/ac060982b. [DOI] [PubMed] [Google Scholar]
- Campbell GA, Mutharasan R. Biosens Bioelectron. 2008;23 (7):1039–1045. doi: 10.1016/j.bios.2007.10.017. [DOI] [PubMed] [Google Scholar]
- Homola J. Anal Bioanal Chem. 2003;377 (3):528–539. doi: 10.1007/s00216-003-2101-0. [DOI] [PubMed] [Google Scholar]
- Chinowsky TM, Soelberg SD, Baker P, Swanson NR, Kauffman P, Mactutis A, Grow MS, Atmar R, Yee SS, Furlong CE. Biosens Bioelectron. 2007;22 (9,10):2268–2275. doi: 10.1016/j.bios.2006.11.026. [DOI] [PubMed] [Google Scholar]
- Feltis BN, Sexton BA, Glenn FL, Best MJ, Wilkins M, Davis TJ. Biosens Bioelectron. 2008;23 (7):1131–1136. doi: 10.1016/j.bios.2007.11.005. [DOI] [PubMed] [Google Scholar]
- Özkumur E, Needham JW, Bergstein DA, Gonzalez R, Cabodi M, Gershoni JM, Goldberg BB, Ünlü MS. Proc Natl Acad Sci USA. 2008;105 (23):7988–7992. doi: 10.1073/pnas.0711421105. [DOI] [PMC free article] [PubMed] [Google Scholar]
- Özkumur E, Ahn S, Yalcin A, Lopez CA, Cevik E, Irani R, DeLisi C, Chiari M, Ünlü MS. Biosens Bioelectron. 2010;25 (7):1789–1795. doi: 10.1016/j.bios.2009.12.032. [DOI] [PMC free article] [PubMed] [Google Scholar]
- Tani H, Komoda Y, Matsuo E, Suzuki K, Hamamoto I, Yamashita T, Moriishi K, Fujiyama K, Kanto T, Hayashi N, Owsianka A, Patel AH, Whitt MA, Matsuura Y. J Virol. 2007;81 (16):8601–8612. doi: 10.1128/JVI.00608-07. [DOI] [PMC free article] [PubMed] [Google Scholar]
- Özkumur E, Lopez CA, Yalcin A, Connor JH, Chiari M, Ünlü MS. IEEE J Sel Top Quantum Electron. 2010;16 (3):635–646. [Google Scholar]
- Daaboul GG, Vedula RS, Ahn S, Lopez CA, Reddington A, Özkumur E, Ünlü MS. Biosens Bioelectron. 2010 doi: 10.1016/j.bios.2010.09.038. [DOI] [PubMed] [Google Scholar]
- Özkumur E, Yalcin A, Cretich M, Lopez CA, Bergstein DA, Goldberg BB, Chiari M, Ünlü MS. Biosens Bioelectron. 2009;25 (1):167–172. doi: 10.1016/j.bios.2009.06.033. [DOI] [PMC free article] [PubMed] [Google Scholar]
- Vedula RS, Daaboul GG, Reddington A, Özkumur E, Bergstein DA, Ünlü MS. J Mod Opt. 2010;57 (16):1564–1569. [Google Scholar]
- Cretich M, Pirri G, Damin F, Solinas I, Chiari M. Anal Biochem. 2004;332 (1):67–74. doi: 10.1016/j.ab.2004.05.041. [DOI] [PubMed] [Google Scholar]
- Pirri G, Damin F, Chiari M, Bontempi E, Depero LE. Anal Chem. 2004;76 (5):1352–1358. doi: 10.1021/ac0352629. [DOI] [PubMed] [Google Scholar]
- Yalcin A, Damin F, Özkumur E, di Carlo G, Goldberg BB, Chiari M, Ünlü MS. Anal Chem. 2009;81 (2):625–630. doi: 10.1021/ac801954x. [DOI] [PMC free article] [PubMed] [Google Scholar]
- Cretich M, Breda D, Damin F, Borghi M, Sola L, Ünlü MS, Burastero SE, Chiari M. Anal Bioanal Chem. 2010;398 (4):1723–1733. doi: 10.1007/s00216-010-4077-x. [DOI] [PubMed] [Google Scholar]
- Yanik AA, Huang M, Kamohara O, Artar A, Geisbert TW, Connor JH, Altug H. Nano Lett. 2010 doi: 10.1021/nl103025u. [DOI] [PMC free article] [PubMed] [Google Scholar]
- Thomas D, Newcomb WM, Brown JC, Wall JS, Hainfeld JF, Trus BL, Steven AC. J Virol. 1985;54 (2):598–607. doi: 10.1128/jvi.54.2.598-607.1985. [DOI] [PMC free article] [PubMed] [Google Scholar]
- Hazelton PR, Gelderblom HR. Emerging Infect Dis. 2003;9 (3):294–303. doi: 10.3201/eid0903.020327. [DOI] [PMC free article] [PubMed] [Google Scholar]
- Servoss JC, Friedman LS. Infect Dis Clin North Am. 2006;20 (1):47–61. doi: 10.1016/j.idc.2006.01.005. [DOI] [PubMed] [Google Scholar]
- Baac H, Hajos JP, Lee J, Kim D, Kim SJ, Shuler ML. Biotech Bioeng. 2006;94 (4):815–819. doi: 10.1002/bit.20882. [DOI] [PubMed] [Google Scholar]
- Burgess STG, Kenyon F, O’Looney N, Ross AJ, Kwan MC, Beattie JS, Petrik J, Ghazal P, Campbell CJ. Anal Biochem. 2008;382 (1):9–15. doi: 10.1016/j.ab.2008.07.017. [DOI] [PubMed] [Google Scholar]
Associated Data
This section collects any data citations, data availability statements, or supplementary materials included in this article.
Supplementary Materials
Figure S1. Schematic of the IRIS data collection process. The binding measurement is performed on a functionalized layered substrate before and after incubation with a target sample. This substrate, functionalized with immobilized capture probes (ex: antibodies) is illuminated at multiple wavelengths which produces a characteristic interference signature that is dependent on the optical path length of the SiO2 plus any accumulated biomass. Changes in the biomass layer density (modeled as thickness) produce a shift in the interference signature leading to quantitative binding information. Eq. 1 approximates the reflection coefficient of a single oxide layer while Eq. 2 is used to calculate the optical phase difference between reflections from the top layer and the buried Si-SiO2 interface. Here, the incident light is perpendicular to the surface (θ=0°). Eq. 1 is fitted to the empirical spectral reflectance data to determine the optical path length difference at each image pixel which is interpreted as material thickness at that location and is subsequently converted to biomass surface density.


