

Abstract
NMR spectroscopy is a powerful analytical tool for both qualitative and quantitative analysis. However, accurate quantitative analysis in complex fluids such as human blood plasma is challenging, and analysis using one-dimensional NMR is limited by signal overlap. It is impractical to use heteronuclear experiments involving natural abundance 13C on a routine basis due to low sensitivity, despite their improved resolution. Focusing on circumventing such bottlenecks, this study demonstrates the utility of a combination of isotope tagged NMR experiments to analyze metabolites in human blood plasma. 1H-15N HSQC and 1H-13C HSQC experiments on the isotope tagged samples combined with the conventional 1H one-dimensional and 1H-1H TOCSY experiments provide quantitative information on a large number of metabolites in plasma. The methods were first tested on a mixture of 28 synthetic analogues of metabolites commonly present in human blood; twenty-seven metabolites in a standard NIST (National Institute of Standards and Technology) human blood plasma were then identified and quantified with an average coefficient of variation of 2.4 % for 17 metabolites and 5.6% when all the metabolites were considered. Carboxylic acids and amines represent a majority of the metabolites in body fluids and their analysis by isotope tagging enables a significant enhancement of the metabolic pool for biomarker discovery applications. Improved sensitivity and resolution of NMR experiments imparted by 15N and 13C isotope tagging is attractive for both the enhancement of the detectable metabolic pool and accurate analysis of plasma metabolites. The approach can be easily extended to many additional metabolites in almost any biological mixture.
Keywords: Metabolites, Quantitation, Plasma, Metabolomics, 1H NMR, Heteronuclear correlation, Isotope tagging, Amines, Carboxylic acids
Introduction
Nuclear magnetic resonance (NMR) spectroscopy is increasingly used in metabolomics for the analyses of multiple metabolites in biofluids and tissue. Metabolomics promises a number of important applications in biomedicine including a more detailed understanding of biological processes, the discovery of the biomarkers associated with numerous diseases, pharmaceutical development and toxicology.1-6 It is increasingly recognized that because of its high reproducibility and quantitative nature, NMR is very attractive. In particular, the improved resolution of two-dimensional (2D) NMR methods is considered very useful for metabolomics applications.7-11 However, a major drawback of 2D NMR is that the cross-peak volume in the spectrum is influenced by numerous experimental or intrinsic parameters including the nonuniform excitation profile of the radio frequency pulses, number and duration of the pulses, inter-pulse delays, relaxation times and the magnitude of indirect spin-spin couplings. The high sensitivity of peak intensities (or volumes) to these parameters has limited the use of 2D (particularly 1H homonuclear 2D) experiments for quantitative analysis in metabolomics.
To overcome the limitations of quantitation and to improve the analysis, new higher resolution 2D approaches utilizing 1H-13C heteronuclear 2D experiments (HSQC) have been proposed.12,13 One approach is to utilize the information from 2D 1H-13C NMR spectra of standard compounds obtained under identical conditions and relate the peak heights in the samples to standard mixtures;12 another is to utilize calibration curves obtained using 1H-13C HSQC spectra for individual metabolites to determine the metabolite concentrations13. Most recently, a more general approach that does not require measurements of standard compounds was proposed.14 This method utilizes correction factors derived theoretically from the solution of the Bloch equations and the analysis of product operator formalism incorporating longitudinal (T1) and transverse (T2) relaxation parameters, 1H-13C heteronuclear J-coupling and various delays used in the pulse sequence.
A major drawback of using the 1H-13C HSQC experiment for quantitative analysis, is the lack of sensitivity arising from low metabolite concentration and natural abundance of 13C (1.1 % natural abundance). To compensate this limitation, unusually long acquisition times (nearly 10 hrs or more) are typically required since the NMR sensitivity scales with the square-root of the number of scans. Moreover, although 1H-13C HSQC greatly enhances resolution when compared with 1D NMR, given the complexity of the biological samples, the resolution obtainable from a single 2D experiment is not always adequate for analyzing a large number of metabolites.
In the present study, with the idea of circumventing the drawbacks of resolution and sensitivity, we utilize a combination of isotope tagging approaches and 2D NMR methods to accurately analyze human plasma metabolites. A number of the most common metabolites in blood plasma were quantified using this approach after validating the experimental protocols using a mixture of synthetic compounds. Metabolites containing carboxyl and amino groups were tagged with 15N or 13C, respectively, before detection by 2D NMR. We have recently shown the proof-of-principle approaches to introduce isotope tags using simple chemical derivatization methods and that the NMR spectra of the tagged metabolites improve both resolution and sensitivity.15-18 The combination of advanced isotope tagging methods with conventional 1D and 2D NMR methods as described in the present study enables the quantitative analysis of a large number of metabolites in human blood on a routine basis.
Experimental Section
Chemicals and blood plasma
Twenty-eight metabolite standards (Table 1), 4,4-dimethyl-4-silapentane-1-sulfonic acid (DSS), maleic acid, ethanolamine (all from Sigma–Aldrich, St. Louis, MO), 4-(4,6-dimethoxy [1,3,5] triazin-2-yl)-4-methylmorpholinium chloride (DMT-MM) (Acros, Geel, Belgium), 15N-ethanolamine, 13C-formic acid (Cambridge Isotope Laboratories, Andover, MA), N, N-dicyclohexylcarbodiimide and N-hydroxysuccinimide (Sigma-Aldrich) were used without further purification. An ultra-pure primary quantitative standard, tris(hydroxymethyl)aminomethane, (99.9%) was obtained from Mallinckrodt Baker Inc. Phillipsburg, NJ. Human blood plasma (10 × 1 mL) was procured from the National Institute of Standards and Technology (NIST, Gaithersburg, MD). Frozen plasma samples were transported to Purdue under dry ice and stored at −80 °C until used for the analysis.
Table 1.
Synthetic analogues of metabolites used for the quantitative analyses of human plasma metabolites.
| Serial Number | Standard compound | Estimated approximate blood plasma concentrations* (μM) | Actual NMR calibrated concentrations in the mixture (μM) used for spiking& |
|---|---|---|---|
| 1 | 3-hydroxybutyrate | 60 | 59.2 ± 0.9 |
| 2 | Acetate | 80 | 73.7 ± 1.1 |
| 3 | L-Alanine | 300 | 287.1 ± 4.5 |
| 4 | L-Arginine | 80 | 90.1 ± 1.4 |
| 5 | Citrate | 30 | 28.1 ± 0.4 |
| 6 | Creatinine | 40 | 31.6 ± 0.6 |
| 7 | Formate | 40 | 32.5 ± 0.5 |
| 8 | L-glutamic acid | 50 | 53.8 ± 0.3 |
| 9 | L-Glutamine | 300 | 292.1 ± 2.8 |
| 10 | L-Glycine | 200 | 172.6 ± 2.7 |
| 11 | L-Histidine | 80 | 83.7 ± 0.6 |
| 12 | L-Isoleucine | 50 | 50.7 ± 0.2 |
| 13 | Lactate | 1000 | 959.5 ± 15.1 |
| 14 | L-Leucine | 80 | 80.7 ± 1.2 |
| 15 | L-Lysine | 100 | 75.3 ± 2.3 |
| 16 | L-Methionine | 20 | 19.2 ± 0.03 |
| 17 | L-Phenylalanine | 70 | 71.1 ± 1.1 |
| 18 | L-Proline | 100 | 93.3 ± 1.5 |
| 19 | L-Threonine | 100 | 90.0 ± 1.9 |
| 20 | L-Tryptophan | 30 | 29.1 ± 0.4 |
| 21 | L-Tyrosine | 80 | 80.9 ± 0.3 |
| 22 | L-Valine | 200 | 183.2 ± 1.5 |
| 23 | Succinate | 10 | 9.9 ± 0.1 |
| 24 | Betaine | 50 | 44.6 ± 0.7 |
| 25 | 4-hydroxy-L-proline | 50 | 53.4 ± 0.8 |
| 26 | L-Serine | 100 | 93.3 ± 0.7 |
| 27 | L-Asparagine | 40 | 43.9 ± 0.7 |
| 28 | Taurine | 30 | 27.7 ± 0.1 |
Obtained from the combination of database search and comparison of the relative peak integrals in the NMR spectra.
The errors are standard deviations from two measurements.
Calibration of the standard solutions
Twenty-eight metabolites that commonly occur in human blood plasma were selected based on entries in the human metabolite database (HMDB),19 the analysis of isotope labeled 1H-13C HSQC and 1H-15N HSQC spectra, as well as 1D and 2D 1H-1H TOCSY spectra of a human plasma sample. Stock solutions (20 mM) for the synthetic analogues of all these 28 metabolites (Supplementary Table S1) and internal standards, DSS (5 mM), maleic acid (20 mM) and ethanolamine (20 mM), were prepared. The concentration of the DSS solution was calibrated using 1H NMR against a primary stoichiometric standard, tris(hydroxymethyl)aminomethane (22.4 mM), prepared in the lab. The calibrated DSS solution was then used to calibrate all other standard solutions. Briefly, solutions of the synthetic analogues of the 28 metabolites and internal standards were divided into 5 groups as shown in Supplementary Table S2. The grouping of samples in Table S2 was such that the 1H NMR peaks for at least one proton from each compound in the group were isolated for the measurement of the peak integral. For each group, the one-dimensional (1D) 1H NMR spectrum was recorded, and based on the integrated area of the isolated peaks with reference to DSS, exact concentrations of the standard solutions were determined (Supplementary Table S1).
Mixture analysis
A mixture of the 28 synthetic analogues of the metabolites was prepared using the stock solutions such that the final concentration of each standard compound was matched approximately to its expected concentration in human blood plasma19 (Table 1). From this mixture, three identical sets of samples (Set 1, Set 2 and Set 3) were prepared (see Supplementary Material; Flow Diagram 1); each set consisted of four solutions, 2× 500 μL and 2× 1000 μL of the mixture. All solutions were then dried under vacuum. To the samples from Set 1, maleic acid solution (92 nmol) was added as an internal reference and the solutions were diluted to 500 μL using doubly distilled water. The carboxylic acid class of metabolites was then tagged with 15N-labeled ethanolamine following the established procedure17 (see Supplementary Material). To each sample from Set 2, ethanolamine solution (200 nmol) was added as an internal reference and the solution diluted to 500 μL using doubly distilled water. Amines and amino acids were subjected to 13C isotope tagging using a 13C-formic acid reaction following the established procedure18 (see Supplementary Material). Finally, to the samples from Set 3, DSS (9.44 nanomol) was added as an internal reference and reconstituted in 560 μL of phosphate buffer (pH=7.4) in D2O and transferred to 5 mm NMR tubes for 1D and 1H-1H 2D TOCSY NMR experiments.
Isotope tagging of plasma metabolites
Cold methanol (4° C; 9.6 mL) was added to 4.8 mL of the NIST plasma, vortexed, and then kept for 30 min at -20 °C. The precipitated protein pellet was removed after centrifuging at 13,200 g for 10 min. The supernatant was divided into 12 equal parts and divided into three groups, each group consisting of four samples (see Supplementary Material; Flow Diagram 2). In each group, two samples served as controls and the remaining two were spiked with 400 μL of the stock solution mixture of 28 synthetic samples. All three groups of samples were then dried in vacuum. One group was used to label metabolites containing carboxylic acid groups with 15N-ethanolamine, and the second group was used to label metabolites containing amine groups with 13C-formic acid, after the addition of internal standards, either maleic acid or ethanolamine, appropriately. Identical procedures were used for isotope tagging the plasma metabolites. To the third group of samples, DSS (9.44 nanomol) was added as an internal reference and reconstituted in 560 μL of phosphate buffer (pH=7.4) in D2O. Samples from all the three preparations were transferred to 5 mm NMR tubes after adjusting the pH and solution conditions as described earlier for the mixture of standards.
NMR experiments
NMR experiments were performed at 298 K on a Bruker Avance-III-800 equipped with a room temperature 1H inverse detection Z-gradient probe or a Bruker DRX-500 spectrometer equipped with a 1H inverse detection Z-gradient cryo-probe. 1D NMR experiments for the five groups of standard samples (Supplementary Table S2), the mixture of 28 synthetic analogues, and the plasma extracts were performed using a one pulse sequence with residual water signal suppression by pre-saturation during relaxation delay. Thirty-two scans with 64 k time domain data points were collected with a sufficiently long recycle delay (20 s) to ensure complete recovery of the magnetization between scans. For the 15N isotope tagged samples, 1H-15N 2D HSQC experiments were performed employing an INEPT transfer delay of 5.5 ms corresponding to a 1JNH of 90 Hz. Spectral widths of approximately 10 kHz in 1H and 5 kHz in 15N dimensions were used for the 800 MHz experiments. For 13C isotope tagged samples, sensitivity-enhanced 1H-13C 2D HSQC experiments were performed employing an INEPT transfer delay of 2.5 ms corresponding to a 1JC-H of 200 Hz. Spectral widths of approximately 10 kHz for the 1H dimension and 600 Hz for 13C were used at 800 MHz. For both 1H-15N HSQC and 1H-13C HSQC 2D experiments, 128 free induction decays were collected along the indirect (t1) dimensions using 4 transients per increment and 2s or 3s recycle delay, resulting in a total acquisition time of 18 min for the 1H-15N HSQC and 28 min for the 1H-13C HSQC. Phase-sensitive data were obtained using echo-anti-echo mode with nitrogen (for 1H-15N HSQC) or carbon (for 1H-13C HSQC) decoupling during acquisition (t2 dimension) using the GARP (Globally Optimized Alternating-phase Rectangular Pulses) sequence. 1H-1H 2D TOCSY experiments were performed for the neat (non-derivatized) samples with a spectral width of 6 kHz (500 MHz) or 12 kHz (800 MHz) in both the dimensions. The residual water signal was suppressed by presaturation. 400 free induction decays were collected with t1 increments using 8 transients per increment and 2s recycle delay, resulting in a total acquisition time of 116 min (500 MHz) or 111 min (800 MHz).
All 1D data were Fourier transformed with a 0.3 Hz line broadening function. The 2D data were zero-filled to 1,024 points in the t1 dimension after forward linear prediction to 512 points and Fourier-transformed after multiplying by a squared sine-bell window function shifted typically by π/4 or π/2 along both the dimensions. All NMR data were processed with Bruker Topspin 2.0 on a Redhat Linux platform and Bruker XWINNMR 3.5 on a SGI / IRIX platform. An automatic baseline correction using a polynomial of degree 5 was used to correct the baseline in both 1D and 2D spectra.
Peaks in the 1D and 2D NMR spectra were assigned to various metabolites based on literature reports.17-19 Integrals for well resolved peaks in 1D and 2D spectra were obtained with respect to the peak for the internal standard DSS, maleic acid or ethanolamine. Integral limits for each peak in the 2D spectra were selected such that the selected region encompassed the whole peak and that no other peak interfered with the selection. Once chosen for each type of 2D spectrum, the same sets of integral limits were used for all other samples. Concentrations of the plasma metabolites were determined by comparing the peak integrals from the spectra obtained with and without spiking with the synthetic analogues, and also by directly comparing the peak integrals of the plasma metabolites with those from the standards. The accuracy, reproducibility and errors were estimated from two to eight measurements, depending on the detection of the resolved peak for a particular metabolite in one or more types of spectra, for both synthetic mixtures and plasma samples. The 1H-15N HSQC, 1H-13C HSQC and 1H-1H TOCSY experiments and the data analyses were performed by independent persons.
Results
The standard solutions of the synthetic analogues of the plasma metabolites and internal standards (maleic acid and ethanolamine), prepared based on their weights, were calibrated using 1D 1H NMR. The actual concentration of the standard solutions prepared based on the weight varies depending on the purity and hygroscopic nature of the compounds and hence, it is important to calibrate the standard solutions especially for accurate quantitative analysis. The DSS solution, which was first calibrated using a primary stoichiometric standard, tris(hydroxymethyl)aminomethane, was used for calibrating all the standard solutions (Supplementary Table S2). The difference between the concentrations determined based on sample weight and calibration using 1D NMR varied as much as 10% for all but three metabolites, which varied up to nearly 20% (Supplementary Table S1) due to hygroscopic nature of the metabolites or sample impurities.
Analysis of synthetic metabolite mixture
A mixture of 28 metabolites was analyzed using both 15N and 13C isotope tagging approaches. Fig. 1 shows 2D spectra of the mixture of 28 compounds with 15N and 13C isotope tagging, as well as without tagging. The integrated 2D peak volumes were obtained and then used to calculate the metabolite concentrations. Fig. 2 shows the concentration of the compounds thus determined. As can be seen in the figure, an excellent match between the metabolite concentrations derived from NMR methods and the actual values was obtained. Further, as shown in Supplementary Figure S1, a correlation of the NMR derived values with the expected values showed a very good agreement for all low and high concentration metabolites (R2 > 0.99).
Figure 1.
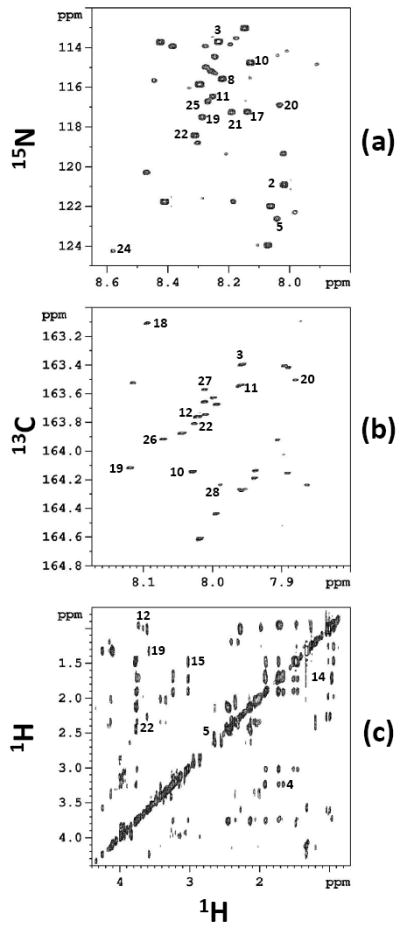
2D spectra of mixtures of 28 synthetic compounds obtained with or without isotope tagging: (a) 1H-15N HSQC spectrum with15N tagging of carboxylic acids (b) 1H-13C HSQC spectrum with 13C tagging of amines and amino acids; and (c) 1H-1H TOCSY spectrum of the neat mixture. All the spectra were obtained on a 800 MHz spectrometer. The labeled peaks correspond to the numbered metabolites in Table 2.
Figure 2.
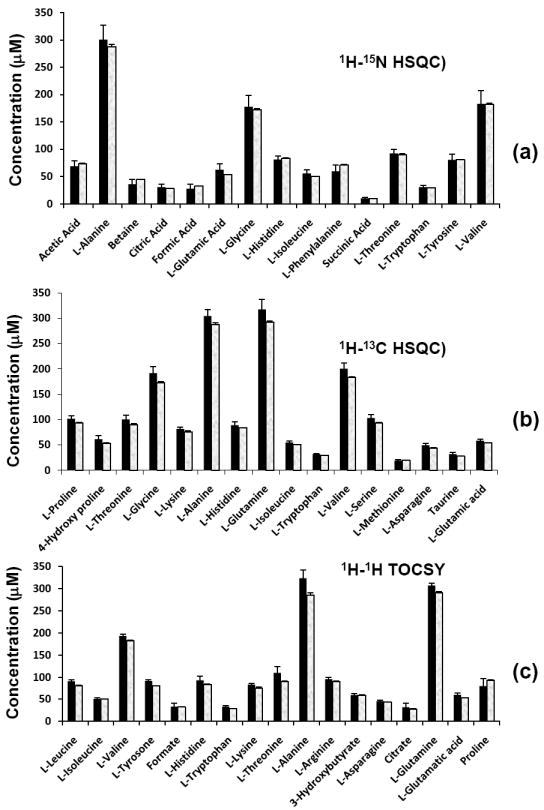
Concentration of 28 standard metabolites obtained by combining 2D NMR experiments with and without 15N or 13C tagging: (a) obtained from 1H-15N HSQC NMR after 15N tagging; (b) obtained from 1H-13C HSQC NMR after 13C tagging and (c) obtained from 1H-1H TOCSY NMR of the neat mixture. The shaded bar on the right in each pair represents the actual concentration of the metabolite.
Quantitation of plasma metabolites
The 1D 1H NMR spectrum of the plasma sample obtained without isotope labeling is highly complex, with only a relatively small number of metabolite signals being isolated from other signals (Supplementary Figure S2). 2D HSQC spectra of plasma samples tagged with 15N and 13C isotopes provide resolved peaks for a much larger number of carboxylic acid and amine containing metabolites. Fig. 3 shows 2D spectra of the plasma obtained with and without 15N or 13C tagging. The 2D TOCSY spectrum of the same plasma sample also provided a number of well resolved peaks (Fig. 3c). However, unlike the HSQC spectra, the TOCSY spectrum showed a number of redundant peaks for the same metabolite, which increases the complexity of the spectrum.
Figure 3.
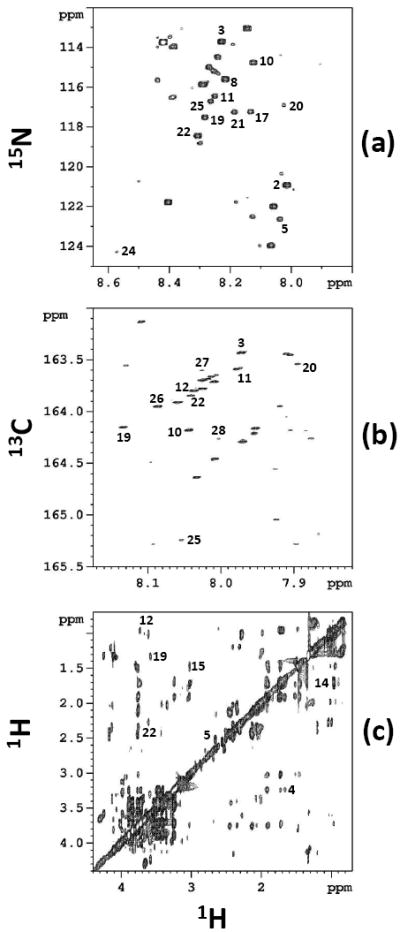
2D spectra of NIST plasma obtained with and without isotope tagging: (a) 1H-15N HSQC spectrum obtained after 15N tagging of carboxylic acids (b) 1H-13C HSQC spectrum obtained after 13C tagging of amines and amino acids; and (c) 1H-1H TOCSY spectrum of the neat mixture. All the spectra were obtained on a 800 MHz spectrometer. The labeled peaks correspond to the numbered metabolites in Table 2.
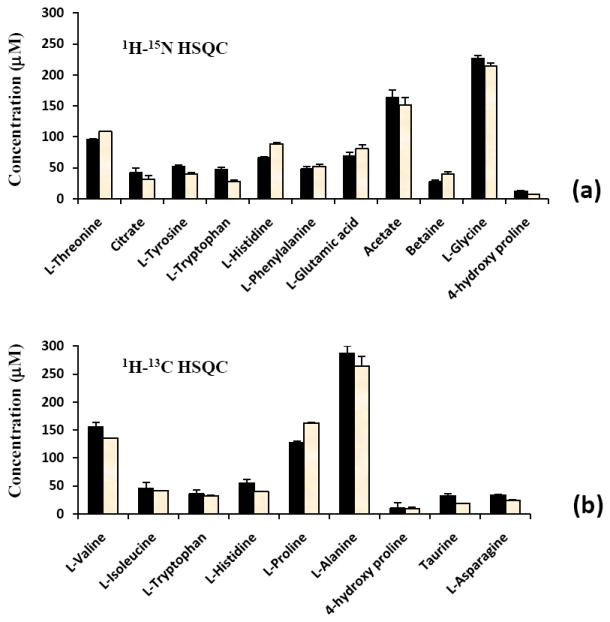
Quantitation of the plasma metabolites followed an identical procedure used for the determination of the concentrations of metabolites in the synthetic mixture. The integrated peak areas/volumes in the 1D/2D spectra of the neat and the spiked plasma samples were obtained and the metabolite concentrations determined. Twenty-seven metabolites that were identified in human plasma were analyzed in duplicate measurements with and without 15N and 13C isotope tagging. Fig. 4 depicts the concentration of the metabolites thus determined. The 1H, 13C and 15N chemical shifts for the blood plasma metabolites analyzed in this study are shown in Table 2 and the derived concentrations using a combination of four different NMR methods is shown in Table 3. Further, the concentration of the carboxylic acid and amino metabolites were also determined by directly comparing the 2D peak integrals with those for the corresponding standard compound. Comparison of the metabolites concentration determined with and without spiking is shown in Fig. 5. Notably, the values determined from both approaches agree well.
Figure 4.
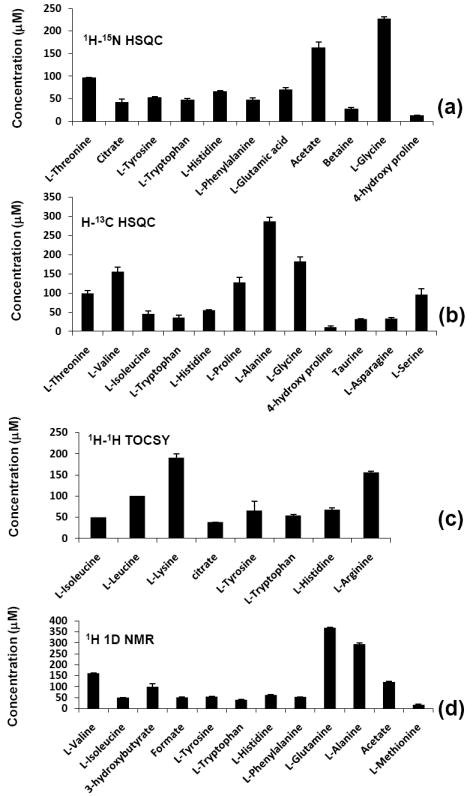
Concentration of metabolites in the NIST plasma obtained using 1D/2D NMR experiments with and without isotope tagging: (a) obtained from 1H-15N HSQC NMR after 15N tagging; (b) obtained from 1H-13C HSQC NMR after 13C tagging; (c) obtained from 1H-1H TOCSY NMR of neat plasma; and (d) obtained from 1D NMR of the neat plasma sample.
Table 2.
The 1H, 13C and 15N chemical shifts of the peaks used in the analysis of NIST plasma metabolites.
| Experiment: 1H-15N HSQC | Experiment: 1H-13C HSQC | ||||||
|---|---|---|---|---|---|---|---|
| Label | Metabolite | 1H (ppm) | 15N (ppm) | Label | Metaolite | 1H (ppm) | 13C (ppm) |
| 2 | Acetate | 8.01 | 120.93 | 3 | L-Alanine | 7.96 | 163.40 |
| 3 | L-Alanine | 8.23 | 113.70 | 10 | L-Glycine | 8.03 | 164.15 |
| 5 | Citrate | 8.04 | 122.62 | 11 | L-Histidine | 7.97 | 163.56 |
| 8 | L-Glutamic acid | 8.21 | 115.58 | 12 | L-Isoleucine | 8.03 | 163.81 |
| 10 | L-Glycine | 8.12 | 114.78 | 18 | L-Proline | 8.10 | 163.10 |
| 11 | L-Histidine | 8.25 | 116.42 | 19 | L-Threonine | 8.12 | 164.12 |
| 17 | L-Phenylalanine | 8.13 | 117.19 | 20 | L-Tryptophan | 7.88 | 163.51 |
| 19 | L-Threonine | 8.28 | 117.52 | 22 | L-Valine | 8.05 | 163.88 |
| 20 | L-Tryptophan | 8.03 | 116.90 | 25 | 4-hydroxy proline | 8.04 | 165.21 |
| 21 | L-Tyrosine | 8.18 | 117.25 | 26 | L-Serine | 8.07 | 163.92 |
| 22 | L-Valine | 8.30 | 118.43 | 27 | L-Asparagine | 8.01 | 163.57 |
| 24 | Betaine | 8.57 | 124.28 | 28 | Taurine | 7.99 | 164.23 |
| 25 | 4-hydroxy proline | 8.26 | 116.74 | ||||
| Experiment: 1H 1D NMR | Experiment: 1H-1H TOCSY | ||||||
|---|---|---|---|---|---|---|---|
| Label | Metabolite | 1H (ppm) | Label | Metabolite | 1H (ppm) F2 dimension | 1H (ppm) F1 dimension | |
| 1 | 3-hydroxybutyrate | 1.19 | 4 | L-Arginine | 1.68 | 3.23 | |
| 2 | Acetate | 1.91 | 5 | Citrate | 2.65 | 2.51 | |
| 3 | L-Alanine | 1.47 | 11 | L-Histidine | 7.07 | 7.06 | |
| 7 | Formate | 8.45 | 12 | L-Isoleucine | 3.66 | 0.98 | |
| 9 | L-Glutamine | 2.13 | 13 | Lactate | 1.32 | 1.32 | |
| 11 | L-Histidine | 7.06 | 14 | L-Leucine | 0.95 | 1.70 | |
| 12 | L-Isoleucine | 1.01 | 15 | L-Lysine | 3.02 | 1.48 | |
| 16 | L-Methionine | 2.13 | 19 | L-Threonine | 3.57 | 1.33 | |
| 17 | L-Phenylalanine | 7.42 | 20 | L-Tryptophan | 7.53 | 7.72 | |
| 20 | L-Tryptophan | 7.74 | 21 | L-Tyrosine | 6.90 | 7.18 | |
| 21 | L-Tyrosine | 6.89 | 22 | L-Valine | 3.60 | 2.27 | |
| 22 | L-Valine | 1.03 | |||||
| 29 | Glucose | 5.23 | |||||
Table 3.
NIST plasma metabolite concentrations obtained using a combination of NMR experiments with or without isotope tagging.
| Label | Metabolite | NIST Plasma concentration (μM)& | Label | Metabolite | NIST Plasma concentration (μM)& |
|---|---|---|---|---|---|
| 1 | 3-hydroxybutyrated | 99.3 ± 13.1 | 16 | L-Methionined | 16.6 ± 2.8 |
| 2 | Acetatea,d | 142.0 ± 3.0 | 17 | L-Phenylalaninea.d | 50.6 ± 3.8 |
| 3 | L-Alaninea,b,d | 279.4 ± 18.9 | 18 | L-Prolineb | 127.6 ± 13.1 |
| 4 | L-Argininec | 155.9 ± 16.0 | 19 | L-Threoninea,b,c | 107.3 ± 16.7 |
| 5 | Citratea,c | 40.1 ± 2.3 | 20 | L-Tryptophana,b,c,d | 45.9 ± 8.1 |
| 7 | Formated | 51.2 ± 2.1 | 21 | L-Tyrosinea,c,d | 58.9 ± 7.2 |
| 8 | L-Glutamic acida | 69.3 ± 5.3 | 22 | L-Valinea,b,c,d | 159.7 ± 11.6 |
| 9 | L-Glutamined | 368.5 ± 2.3 | 24 | Betainea | 27.3 ± 2.8 |
| 10 | L-Glycinea,b | 204.5 ± 31.2 | 25 | 4-hydroxy prolinea,b | 11.5 ± 1.3 |
| 11 | L-Histidinea,b,c,d | 63.1 ± 5.7 | 26 | L-Serineb | 95.8 ± 15.0 |
| 12 | L-Isoleucineb,c,d | 48.2 ± 2.4 | 27 | L-Asparagineb | 33.4 ± 2.8 |
| 13 | Lactatec | 2403.6 ± 127.6 | 28 | Taurineb | 32.4 ± 0.8 |
| 14 | L-Leucinec | 100.1 ± 0.1 | 29 | Glucosed | 8778.5 ± 62.8 |
| 15 | L-Lysinec | 190.8 ± 21.9 |
The errors are standard deviations;
obtained from 1H-15N HSQC;
obtained from 1H-13C HSQC;
obtained from 1H-1H TOCSY; and
obtained from 1H 1D NMR.
Two samples were used for each experiment resulting in two, four, six or eight independent measurements for each metabolite.
Figure 5.
Comparison of the concentrations of (a) carboxylic acid and (b) amino metabolites in the NIST plasma obtained with spiking (left bars) and without spiking (right bars) with the standard compounds.
Discussion
1H NMR spectroscopy is an attractive tool for the quantitative analysis of multiple metabolites from intact biological samples. Considering its ease of use, reproducibility and high-throughput nature, 1D 1H NMR spectroscopy is often used for metabolomics based studies. However, it is challenging to analyze the 1D NMR spectrum of plasma in an absolute quantitative fashion as it contains a large number of overlapping signals due to hundreds of metabolites present at variable concentrations. The multiplicity of the signals due to J-coupling makes 1D 1H NMR spectra of plasma particularly challenging. The interference from macromolecules such as proteins and lipids adds to the complexity and causes baseline distortions in the spectra. Such overlap and baseline issues substantially affect the accuracy of the quantitative analysis using 1D NMR. To offset such limitations, a majority of the studies that use 1D NMR resort to comparisons of the relative intensities of the 1D NMR signals between disease and healthy samples. While the use of relaxation edited techniques such as Carr-Purcell-Meoboom-Gill (CPMG) experiment, serum/plasma deproteinization, and line fitting approaches significantly improves the analysis of metabolites,20 such methods are not ideal. Diffusion-sensitized 1D NMR spectroscopy, which uses data from two separate 1D experiments, one obtained using low diffusion gradients and the other using high gradients to suppress macromolecular background signals effectively, was shown to be useful for the quantitative analysis of blood plasma metabolites.21 However, spectral overlap still significantly limits the number of metabolites that can be analyzed.
2D NMR promises quantitative analysis of a large number of metabolites on a routine basis. An important requirement is that the cross-peaks in 2D spectra should be devoid of overlaps for reliable quantitative results; however, this criterion is not often met for a large number of metabolites by a single 2D experiment due to the extremely high complexity of plasma. The advantage of the new 2D NMR approaches used here is that the use chemoselective isotope tags greatly reduce the complexity of the spectra, since only a single peak is observed for the metabolites with a single functional group (see Fig. 1 and Fig. 3). The reduced complexity of the spectra due to the absence of less interesting chemical signals is particularly important for the analysis of low-concentration metabolites (Fig. 2 and Fig. 4). This method, however, does not work for the analysis of lipoproteins, which represents a major class of metabolites in blood plasma, and which have been effectively been analyzed using a multivariate deconvolution approach.22,23
An important criterion for the quantitative analysis method to be robust is that it does not require the use of spiking standards for each sample. To test this, we also determined the concentration of 15N and 13C isotope tagged metabolites in plasma by comparing the 2D peak integrals with those from the synthetic analogues. It may be interesting to note that as shown in Fig. 5, the values thus determined using both 15N and 13C isotope tagging agree well with those determined based on spiking with synthetic analogues. Therefore, it is sufficient to obtain the integral for each synthetic analogue only once, which can be used for the analysis of any number of samples. Utilization of 2D HSQC experiments involving the isotopes has the additional advantage since both the magnitude of the coupling and the relaxation properties of the nuclear pairs (15N/13C and 1H) do not appreciably vary across the metabolites of interest and hence provide the relative cross peak intensities that are less sensitive to instrumental settings.
In this study, we quantified 27 metabolites with an average CV of 2.4 % for 17 metabolites and 5.6% when all the metabolites were considered. When the results from all the four NMR methods were combined for the same metabolites, the average CV’s were 4.8% and 8.7%, respectively. We note that, as the metabolite library expands, we can quantify additional metabolites from the same and already acquired 2D data by comparison of the peak integrals with those from the standards. Mass spectrometry (MS), another very useful method for quantitative analysis, is highly sensitive and provides quantitative information on a larger number of metabolites. However, MS invariably involves the combination of a separation method such as gas chromatography or liquid chromatography for accurate analysis and often renders the obtained results to be sensitive to the specific column and separation parameters and especially the ionization conditions. In addition, a standard compound is needed for each quantified metabolite.
In conclusion, this investigation presents quantitative analysis of over 25 plasma metabolites using 15N and 13C isotope tagging methods. Carboxylic acids and amines represent a majority of the metabolites in body fluids and their analysis by isotope tagging significantly enhances the detectable metabolic pool for biomarker discovery applications. The combination of improved sensitivity and resolution, and less time required when compared to natural abundance heteronuclear NMR methods, is attractive for the routine and accurate analysis of metabolites in complex biological samples. Although, the isotope tagging methods use 2D NMR experiments, each 2D experiment requires only 30 min or less (<10 min with a cryoprobe), and hence the approach can be useful for high throughput analysis of human plasma as well as other biological fluids. Further, combination of the isotope tagging approach with latest advancements in NMR technology, such as detection using micro-coil probes, for example, can significantly minimize the volume of biofluid samples required for routine analysis.
Supplementary Material
Acknowledgments
This work was supported by the National Institutes of Health Grant 1 R01GM085291-01 and 3R01GM085291-02S1. The authors would like to thank Dr. Art Castle at the NIH/NIDDK for useful suggestions regarding this work. DR is a member of the Purdue Center for Cancer Research and Oncological Sciences Center.
References
- 1.Nicholson JK, Lindon JC, Holmes E. Xenobiotica. 1999;29:1181–1189. doi: 10.1080/004982599238047. [DOI] [PubMed] [Google Scholar]
- 2.Clayton TA, Lindon JC, Cloarec O, Antti H, Charuel C, Hanton G, Provost JP, Le Net JL, Baker D, Walley RJ, Everett JR, Nicholson JK. Nature. 2006;440:1073–1077. doi: 10.1038/nature04648. [DOI] [PubMed] [Google Scholar]
- 3.Beckonert O, Keun HC, Ebbels TM, Bundy J, Holmes E, Lindon JC, Nicholson JK. Nat Protoc. 2007;2(11):2692–2703. doi: 10.1038/nprot.2007.376. [DOI] [PubMed] [Google Scholar]
- 4.Pan Z, Raftery D. Anal Bioanal Chem. 2007;387:525–527. doi: 10.1007/s00216-006-0687-8. [DOI] [PubMed] [Google Scholar]
- 5.Nagana Gowda GA, Zhang S, Gu H, Asiago V, Shanaiah N, Raftery D. Expert Rev Mol Diagnos. 2008;8:617–633. doi: 10.1586/14737159.8.5.617. [DOI] [PMC free article] [PubMed] [Google Scholar]
- 6.Holmes E, Wilson ID, Nicholson JK. Cell. 2008;134(5):714–717. doi: 10.1016/j.cell.2008.08.026. [DOI] [PubMed] [Google Scholar]
- 7.Dumas M-E, Canlet C, Andre F, Vercauteren J, Paris A. Anal Chem. 2002;74:2261–2273. doi: 10.1021/ac0156870. [DOI] [PubMed] [Google Scholar]
- 8.Tang H, Wang Y, Nicholson JK, Lindon JC. Anal Biochem. 2004;325:260–272. doi: 10.1016/j.ab.2003.10.033. [DOI] [PubMed] [Google Scholar]
- 9.Dumas M-E, Canlet C. J Proteome Res. 2005;4:1493–1502. doi: 10.1021/pr0500556. [DOI] [PubMed] [Google Scholar]
- 10.Xi Y, de Ropp JS, Viant MR, Woodruff DL, Yu P. Metabolomics. 2006;2:221–233. [Google Scholar]
- 11.Fonville JM, Maher AD, Coen M, Holmes E, Lindon JC, Nicholson JK. Anal Chem. 2010;82:1811–1821. doi: 10.1021/ac902443k. [DOI] [PubMed] [Google Scholar]
- 12.Lewis IA, Schommer SC, Hodis B, Robb KA, Tonelli M, Westler WM, Sussman MR, Markley JL. Anal Chem. 2007;79(24):9385–9390. doi: 10.1021/ac071583z. [DOI] [PMC free article] [PubMed] [Google Scholar]
- 13.Gronwald W, Klein MS, Kaspar H, Fagerer SR, Nürnberger N, Dettmer K, Bertsch T, Oefner PJ. Anal Chem. 2008;80(23):9288–9297. doi: 10.1021/ac801627c. [DOI] [PubMed] [Google Scholar]
- 14.Rai RK, Tripathi P, Sinha N. Anal Chem. 2009;81(24):10232–10238. doi: 10.1021/ac902405z. [DOI] [PubMed] [Google Scholar]
- 15.Shanaiah N, Desilva A, Nagana Gowda GA, Raftery MA, Hainline BE, Raftery D. Proc Natl Acad Sci(USA) 2007;104(28):11540–11544. doi: 10.1073/pnas.0704449104. [DOI] [PMC free article] [PubMed] [Google Scholar]
- 16.DeSilva MA, Shanaiah N, Nagana Gowda GA, Rosa-Pérez K, Hanson BA, Raftery D. Magn Reson Chem. 2009;47:S74–S80. doi: 10.1002/mrc.2480. [DOI] [PMC free article] [PubMed] [Google Scholar]
- 17.Ye T, Mo H, Shanaiah N, Nagana Gowda GA, Zhang S, Raftery D. Anal Chem. 2009;81(12):4882–4888. doi: 10.1021/ac900539y. [DOI] [PMC free article] [PubMed] [Google Scholar]
- 18.Ye T, Zhang S, Mo H, Tayyari F, Nagana Gowda GA, Raftery D. Anal Chem. 2010;82(6):2303–2309. doi: 10.1021/ac9024818. [DOI] [PMC free article] [PubMed] [Google Scholar]
- 19.Wishart DS, Tzur D, Knox C, Eisner R, Guo AC, Young N, Cheng D, Jewell K, Arndt D, Sawhney S, Fung C, Nikolai L, Lewis M, Coutouly MA, Forsythe I, Tang P, Shrivastava S, Jeroncic K, Stothard P, Amegbey G, Block D, Hau DD, Wagner J, Miniaci J, Clements M, Gebremedhin M, Guo N, Zhang Y, Duggan GE, Macinnis GD, Weljie AM, Dowlatabadi R, Bamforth F, Clive D, Greiner R, Li L, Marrie T, Sykes BD, Vogel HJ, Querengesser L. Nucleic Acids Res. 2007;35(Database issue):D521–D526. doi: 10.1093/nar/gkl923. [DOI] [PMC free article] [PubMed] [Google Scholar]
- 20.Weljie AM, Newton J, Mercier P, Carlson E, Slupsky CM. Anal Chem. 2006;78:4430–4442. doi: 10.1021/ac060209g. [DOI] [PubMed] [Google Scholar]
- 21.de Graaf RA, Behar KL. Anal Chem. 2003;75:2100–2104. doi: 10.1021/ac020782+. [DOI] [PubMed] [Google Scholar]
- 22.Otvos JD, Jeyarajah EJ, Bennett DW. Clin Chem. 1991;37(3):377–386. [PubMed] [Google Scholar]
- 23.Otvos JD. Clin Lab. 2002;48:171–180. [PubMed] [Google Scholar]
Associated Data
This section collects any data citations, data availability statements, or supplementary materials included in this article.