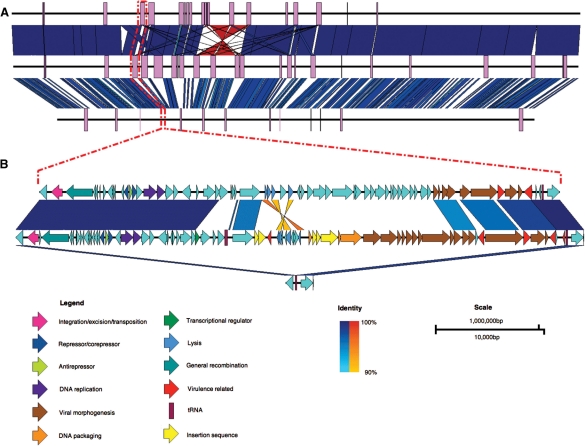
Fig. 1.
Comparison between the genomes of Escherichia coli O157:H7 str. EDL933 (top), E.coli O157:H7 str. Sakai (middle) and E.coli K12 str. MG1655 (bottom). (A) Whole-genome comparison with prophage regions shown as purple boxes. (B) A zoomed-in view showing that prophages have inserted at tRNA-Ser in the O157:H7 strains EDL933 and Sakai (prophages CP933M and Sp4, respectively), but not in K12. Dashed red lines indicate the site in the whole-genome sequences of the prophages and flanking genes shown in the bottom figure. Vertical blocks between sequences indicate regions of shared similarity shaded according to BLASTn (blue for matches in the same direction or orange for inverted matches). CDS in prophage Sp4 have been coloured according to Asadulghani et al. (2009) and functions of the CDS in CP933M have been inferred from BLAST hits and existing annotation.

