Abstract
Summary: Differential dependency network (DDN) is a caBIG® (cancer Biomedical Informatics Grid) analytical tool for detecting and visualizing statistically significant topological changes in transcriptional networks representing two biological conditions. Developed under caBIG® 's In Silico Research Centers of Excellence (ISRCE) Program, DDN enables differential network analysis and provides an alternative way for defining network biomarkers predictive of phenotypes. DDN also serves as a useful systems biology tool for users across biomedical research communities to infer how genetic, epigenetic or environment variables may affect biological networks and clinical phenotypes. Besides the standalone Java application, we have also developed a Cytoscape plug-in, CytoDDN, to integrate network analysis and visualization seamlessly.
Availability: The Java and MATLAB source code can be downloaded at the authors' web site http://www.cbil.ece.vt.edu/software.htm
Contact: yuewang@vt.edu
Supplementary information: Supplementary data are available at Bioinformatics online.
1 INTRODUCTION
Gene regulatory networks are context specific and dynamic in nature (Beyer et al., 2007; Clarke et al., 2008). Under different conditions, different regulatory components and mechanisms are activated, leading to rewired regulatory network and topological changes. Accurate detection of the topological changes in transcriptional networks between disease and normal conditions, or under different stages of cell development, would be of great biological importance. For example, a deviation from normal regulatory network topology may reveal the mechanism of pathogenesis (Hood et al., 2004), and the genes that undergo the most network topological changes may serve as biomarkers or drug targets.
We developed the differential dependency network (DDN) method to detect statistically significant topological changes in transcriptional networks between two conditions and to infer most likely mechanistic network markers (Zhang et al., 2009). DDN aims to detect and learn from gene expression data the rewiring of the underlying biological network triggered by outside stimuli or different conditions. We use local dependency models to characterize the regulatory dependencies of genes in the network and represent them as local network structures. Local dependency models decompose the entire network into a series of local networks, which serve as the basic elements of the network for statistical testing. Unlike other dependency models that consider only pairwise relationships (Choi et al., 2005; Fuller et al., 2007; Kostka and Spang, 2004; Watson, 2006) or binding triples (Qiu et al., 2007), the local dependency models select the number of dependent variables automatically by the Lasso method (Tibshirani, 1996), and thereby learn the local network structures. Subsequently, permutation tests are performed on the local dependency models under two conditions and P-values are assigned to each of the local structures. The permutation test on individual local structures assures the statistical significance of the detected network topological changes, so that only genes that exhibit network topological changes between two conditions, above a given significance level, will be identified. Lastly, the extracted subnetworks showing significant topological changes are visualized using Cytoscape (Shannon et al., 2003).
DDN is an open-source differential network analysis and network marker identification tool developed through the caBIG® In Silico Research Centers of Excellence (ISRCE) effort and is freely available to the cancer and broader biomedical research communities. As a caBIG® adopted data analytic tool, DDN will be integrated into Georgetown Database of Cancer (G-DOC) and offers users across the cancer and broader biomedical research communities a unique yet effective network analysis tool for differential pathway network inference. To harness the powerful visualization capability of Cytoscape (Shannon et al., 2003), we have also developed a Cytoscape plug-in, CytoDDN, to streamline the network analysis and visualization. Here, we applied DDN and CytoDDN to four case studies, specifically selected from diverse biological settings, to demonstrate the effectiveness and applicability of the proposed tools in identifying significant network changes and key network players.
2 DESCRIPTION
2.1 Software
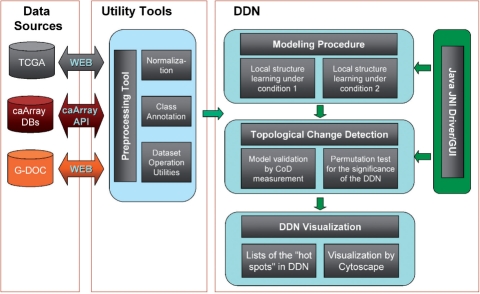
The components of DDN and their input/output flowchart are illustrated in Figure 1. We use existing caBIG® tools to load, preprocess and normalize gene expression data from in-house (i.e. G-DOC) or public databases (e.g. caArray, TCGA). The core algorithms of DDN include an efficient learning procedure to learn the local dependency models using the Lasso method, and a permutation test to detect significant network topological changes. We first implemented DDN algorithms in MATLAB and then used the MATLAB compiler to generate C++ shared libraries. Supported by a Java-based user interface, C++ shared libraries are called from Java using the Java Native Interface. DDN has been tested on Microsoft Windows and Linux platforms, and can readily run on any computer without an installed version of MATLAB.
Fig. 1.
The components and input/output of DDN.
The software takes as input the data files under two conditions and gene names, which correspond to each row of the data files. There are three user-adjustable parameters: predictive dependency threshold T, the maximum size of the gene predictor set K and P-value cutoff value, which are set to default values when the program starts. Results of DDN analysis are visualized as networks. Nodes in the network denote genes and edges with different colors represent condition-specific dependencies.
2.2 Case study
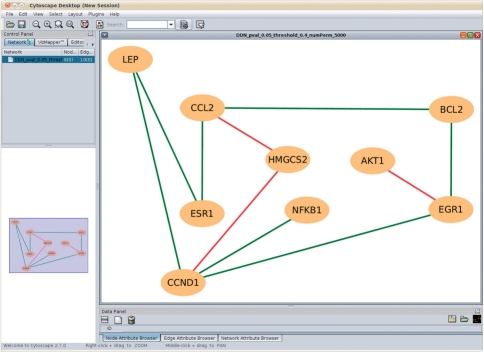
DDN has been used in several ongoing cancer research projects. Using expression data from normal adult rat mammary glands exposed in utero to E2, we have applied DDN to reveal key yet unknown transcription factors and signaling that mediates the effects of in utero estrogenic environment on later estrogen sensitivity and breast cancer risk, as shown in Figure 2.
Fig. 2.
DDN between control group and excess E2 in utero group generated by CytoDDN. The red lines represent the connections that exist only in control group, and the green lines represent the connections that exist only in excess E2 in utero group.
Since the exposure was in utero while DDN analysis was done in adulthood, the altered gene networks over time could be a consequence of transcriptional programming, possibly regulated by promoter methylation status, e.g. ER, BCL2, LEP (leptin) and EGR1. Each is known to be epigenetically regulated and differentially expressed in needle aspirate samples in women from non-BRCA1/2 breast cancer families. In addition, AKT1 can alter methylation patterns in some promoters, which may explain the nature of the AKT1-EGR1 edge present only in the control mammary glands, generating a novel hypothesis for further study.
In another application to identifying distinct clinicopathological network features between different histological subtypes of ovarian cancer, namely clear cell carcinoma and endometrioid carcinoma, DDN also provides some promising observations. As we can see in Supplementary Figure S9, different pathways detected by DDN, namely, ARID1A-POU5R and ARID1A-CTNNB1, are associated with the lead gene ARID1A in the development of endometrioid carcinoma and clear cell carcinoma, respectively. Since somatic mutation of ARID1A has been identified in both clear cell and endometrioid carcinoma of the ovary (Jones et al., 2010; Wiegand et al., 2010), it is possible that the precursor lesions may utilize different pathways involving ARID1A for their tissue-type differentiation from the same cell origin, i.e. endometriosis.
More DDN application case studies on breast cancer, ovarian cancer and muscular dystrophy are included in the Supplementary Material.
3 DISCUSSION
DDN presents a differential network analysis approach to detect significant topological changes of biological networks in response to genetic/epigenetic/environmental variants. It also provides an alternative way for defining mechanistically relevant network biomarkers. For example, genotypes (epigenetic status or environmental factors) can be used to assign samples into conditional groups, and DDN is then used to infer how the genotype status affects the phenotype(s) via rewired biological networks. The degree of connection changes may be used to prioritize the ‘hot-nodes’ in the relevant subnetworks, and Monte Carlo Markov Chain simulations may be performed to identify the ‘driver nodes’ based on their roles in determining phenotypic transitions.
We plan to incorporate biological knowledge and other datatypes into DDN to create a more comprehensive network inference. For example, by incorporating protein–protein interaction data and known biological pathway knowledge, we can further refine the structure learning algorithm to make the network inference more biologically informative. There are several workflow pipelines for using DDN. For example, we first download gene expression datasets associated with two different biological conditions from TCGA, then normalize and label the data using caBIG® tools, such as GenePattern, and feed the processed data to DDN. The network topological changes identified by DDN will be sent to iProXpress for visualization and mapping onto known signaling pathways. Eventually, the DDN analysis workflows will be compatible with the Taverna workbench and made publicly available to the research community.
Funding: National Institutes of Health, under Contract No. HHSN261200800001E and Grants CA109872, CA149147, NS029525, GM085665 (in parts); Intramural Research Program of the National Institutes of Health, National Institute on Aging (in parts).
Conflict of Interest: none declared.
Supplementary Material
REFERENCES
- Beyer A., et al. Integrating physical and genetic maps: from genomes to interaction networks. Nat. Rev. Genet. 2007;8:699–710. doi: 10.1038/nrg2144. [DOI] [PMC free article] [PubMed] [Google Scholar]
- Choi J.K., et al. Differential coexpression analysis using microarray data and its application to human cancer. Bioinformatics. 2005;21:4348–4355. doi: 10.1093/bioinformatics/bti722. [DOI] [PubMed] [Google Scholar]
- Clarke R., et al. The properties of high-dimensional data spaces: implications for exploring gene and protein expression data. Nat. Rev. Cancer. 2008;8:37–49. doi: 10.1038/nrc2294. [DOI] [PMC free article] [PubMed] [Google Scholar]
- Fuller T.F., et al. Weighted gene coexpression network analysis strategies applied to mouse weight. Mamm. Genome. 2007;18:463–472. doi: 10.1007/s00335-007-9043-3. [DOI] [PMC free article] [PubMed] [Google Scholar]
- Hood L., et al. Systems biology and new technologies enable predictive and preventative medicine. Science. 2004;306:640–643. doi: 10.1126/science.1104635. [DOI] [PubMed] [Google Scholar]
- Jones S., et al. Frequent mutations of chromatin remodeling gene ARID1A in ovarian clear cell carcinoma. Science. 2010;330:228–231. doi: 10.1126/science.1196333. [DOI] [PMC free article] [PubMed] [Google Scholar]
- Kostka D., Spang R. Finding disease specific alterations in the co-expression of genes. Bioinformatics. 2004;20:i194–i199. doi: 10.1093/bioinformatics/bth909. [DOI] [PubMed] [Google Scholar]
- Qiu P., et al. Dependence network modeling for biomarker identification. Bioinformatics. 2007;23:198–206. doi: 10.1093/bioinformatics/btl553. [DOI] [PubMed] [Google Scholar]
- Shannon P., et al. Cytoscape: a software environment for integrated models of biomolecular interaction networks. Genome Res. 2003;13:2498–2504. doi: 10.1101/gr.1239303. [DOI] [PMC free article] [PubMed] [Google Scholar]
- Tibshirani R. Regression shrinkage and selection via the Lasso. J. R. Stat. Soc. Ser. B Methodol. 1996;58:267–288. [Google Scholar]
- Watson M. CoXpress: differential co-expression in gene expression data. BMC Bioinformatics. 2006;7:509. doi: 10.1186/1471-2105-7-509. [DOI] [PMC free article] [PubMed] [Google Scholar]
- Wiegand K.C., et al. ARID1A mutations in endometriosis-associated ovarian carcinomas. N. Engl.. J. Med. 2010;363:1532–1543. doi: 10.1056/NEJMoa1008433. [DOI] [PMC free article] [PubMed] [Google Scholar]
- Zhang B., et al. Differential dependency network analysis to identify condition-specific topological changes in biological networks. Bioinformatics. 2009;25:526–532. doi: 10.1093/bioinformatics/btn660. [DOI] [PMC free article] [PubMed] [Google Scholar]
Associated Data
This section collects any data citations, data availability statements, or supplementary materials included in this article.


