Abstract
Motivation: Fluorescence in situ hybridization (FISH) is used to study the organization and the positioning of specific DNA sequences within the cell nucleus. Analyzing the data from FISH images is a tedious process that invokes an element of subjectivity. Automated FISH image analysis offers savings in time as well as gaining the benefit of objective data analysis. While several FISH image analysis software tools have been developed, they often use a threshold-based segmentation algorithm for nucleus segmentation. As fluorescence signal intensities can vary significantly from experiment to experiment, from cell to cell, and within a cell, threshold-based segmentation is inflexible and often insufficient for automatic image analysis, leading to additional manual segmentation and potential subjective bias. To overcome these problems, we developed a graphical software tool called FISH Finder to automatically analyze FISH images that vary significantly. By posing the nucleus segmentation as a classification problem, compound Bayesian classifier is employed so that contextual information is utilized, resulting in reliable classification and boundary extraction. This makes it possible to analyze FISH images efficiently and objectively without adjustment of input parameters. Additionally, FISH Finder was designed to analyze the distances between differentially stained FISH probes.
Availability: FISH Finder is a standalone MATLAB application and platform independent software. The program is freely available from: http://code.google.com/p/fishfinder/downloads/list
Contact: gilbert@bio.fsu.edu
1 INTRODUCTION
Fluorescence in situ Hybridization (FISH) is a technique used to visualize the location of specific DNA sequences within the nucleus. FISH incorporates fluorescently labeled probes that bind only to the segment of the genome with which they have a high degree of sequence similarity. Thus, FISH provides a way to visually locate a gene within the nucleus using fluorescence microscopy. The process of manual data acquisition is time consuming and subjective due to inconsistency of an investigator's decisions. Therefore, to achieve high throughput and objectivity, the method of data acquisition should be standardized as well as automated so less manual work is required from the investigator and data are objectively acquired.
One simple automated approach to extracting a cell from the background is achieved by setting a threshold value above the background level of fluorescent light intensity (Andrey et al., 2010; Shopov et al., 2000): all pixels with light intensity values higher than the threshold are considered as part of the valid nucleus, while pixels with light intensity lower than the threshold are excluded as background noise. Another similar approach is to set a fixed signal-to-noise ratio, which incorporates a fixed threshold in order to isolate and extract the valid nuclear boundary (Heintzmann et al., 2004; Pernthaler et al., 2003). When cells contain relatively homogenous 4′,6-diamidino-2-phenylindole (DAPI) fluorescence signal intensities and have sufficient contrast relative to the background, these fixed threshold-based methods often produce biologically meaningful results. However, fluorescent light intensity values vary greatly between experiments and cell nuclei because artifactual fluorescence and cytological debris are usually present in FISH experiments as well as the fact that cells have inherent biological variations in shape, size and other properties. Due to non-uniform intensities found within cells as well as in the background of FISH images, fixed threshold-based segmentation methods have inherent limitations. As a result, common threshold-based methods used by existing software programs often require manual modification from one sample to the next within the same experiment (Iannuccelli et al., 2010). Moreover, other advanced segmentation methods such as dynamic programming (DP) or pattern recognition require user interaction and/or training data for producing optimum output (Gudla et al., 2008; McCullough et al., 2008; Nandy et al., 2009).
To overcome these limitations, we have developed a highly automated graphical user interface software tool called FISH Finder, which is specifically designed to analyze FISH images effectively and objectively. The main contributions of FISH Finder are: (i) it segments fluorescently stained nuclei automatically using a statistical approach called compound Bayesian classifier to achieve contextual classification and segmentation; using this method, FISH Finder produced highly satisfactory results of radial positioning analysis in the study of subnuclear organization for seven genes (Yokochi et al., 2009). (ii) FISH Finder automatically identifies up to two FISH signals per fluorescent channel and will compute the shortest distance from fluorescent signals to the nuclear boundary or to other fluorescent signals using the Euclidean metric. FISH Finder allows for selection of up to 10 different fluorescent signal channels to be processed. (iii) Processed images can be opened for editing or re-editing (i.e. add or remove FISH signals, remove unwanted nuclear boundaries and add or adjust nuclear boundaries). (iv) Finally, it allows investigators to save the results in comma-separated values (CVS) file format that can be imported into other computational software such as R or Microsoft Excel.
2 PROGRAM FEATURES
2.1 User interface
FISH Finder is platform independent and only requires a license of MATLAB 7.1 or higher in addition to FISH Finder's MATLAB code (which is freely available for download at http://code.google.com/p/fishfinder/downloads/list). FISH Finder's graphical interface was created using the MathWorks MATLAB programming environment. FISH Finder was designed for investigators who have little or no experience using MATLAB and have no background knowledge in computer programming languages. Furthermore, the functionality of FISH Finder's graphical interface is divided into two main phases. The first phase is the automatic processing mode, which requires the investigator to specify input data for processing. Once files are specified, the program produces the necessary outputs or results for the second phase, FISH Finder's editor window, which allows the investigators to verify, modify and export results.
2.2 Input
The FISH Finder input window allows users to specify images to be processed. To achieve the ability of reading in different types of input files such as Tagged Image File Format (.tiff) image stack or DeltaVision (.dv) images stack, LOCI Bio-Format toolkit is integrated into FISH Finder (http://loci.wisc.edu/software/bio-formats). Furthermore, FISH Finder allows investigators to import a list of data folders containing multiple FISH images for processing. Investigators must specify the number of fluorescent channels to be analyzed and the order in which the DAPI channel was filtered during image acquisition before starting the image analysis process. However, the investigator does not need to specify or set any predefined values for nuclei segmentation. FISH Finder automatically determines optimal parameters for segmenting foreground from background.
2.3 Segmentation via contextual classification
The core component of FISH Finder is the automated nucleus segmentation algorithm, which requires no adjustment of segmentation parameters by an investigator. Instead of relying on a threshold-based segmentation algorithm, the problem is posed as a two-class classification problem. First, FISH Finder selects the most in-focus image using the DAPI staining channel from the image stack; this is usually the image with the highest overall intensity. Next, FISH Finder estimates the conditional probability distributions for the background and the foreground (i.e. the nuclei) pixel value distributions (i.e. the histogram of the DAPI-stained image), similar to threshold-based methods. However, classification based on the initial estimated probability distributions by thresholding is not sufficient to handle significant variations within cells and between experiments. To be robust and reliable, we use a compound Bayesian classifier to enhance the classification accuracy (Duda et al., 2000). The key difference between a threshold-based method and component Bayesian classifier is that the result from the former depends only the pixel value itself, while the result from the latter depends not only the pixel value itself, but also the values in a predefined neighborhood of surrounding pixels. In other words, the compound Bayesian classifier incorporates contextual information of pixels to be classified. Especially when variations within nuclei and in background are large, the contextual information is a key factor for more robust and accurate results. Additionally, FISH Finder iteratively re-estimates the class-conditional probability distributions based on the current classification to improve the classification—and therefore boundary accuracy—until the improvement is not significant. Importantly, this entire process is shape independent.
After segmentation through classification, FISH Finder extracts the nuclear boundaries. These boundaries are then analyzed automatically to detect incomplete nuclei. For example, if any nuclear boundary contains 20% (as set by default) or more pixels on the image boundary, then FISH Finder will consider that nucleus to be incomplete and it will not be analyzed. In cases where multiple nuclei merge together these can be manually segmented (discussed below) or can be ignored. To alleviate false segmentation of fluorescent nuclear debris occasionally seen in FISH images, the minimum cell size parameter can be optimized in FISH Finder's input window (note: the default setting of this adjustable parameter was determined during design and development of FISH Finder). For best results of segmentation with FISH Finder, we recommend that investigators analyze images of stained nuclei at a concentration in which cells are not overly clumped together.
2.4 Fluorescent probe signal extraction and positioning analysis
A fluorescent probe signal can be determined objectively by analysis of pixel intensity values within an extracted nucleus. FISH Finder computes the average light intensity of the fluorescent probe signal channel, which then serves as the threshold for selecting fluorescent probe signals. Any notable bright spots identified with higher intensity than the threshold will serve as candidates for FISH signals. Then FISH Finder reduces the number of candidate signals by analyzing the size of the signal as well as comparing the intensities of candidate signals. To accommodate variation in fluorescent probe signal strength and quality, the minimum intensity for FISH signal detection can be optimized with adjustment of the threshold in FISH Finder's input window (note: the default setting of this adjustable parameter was determined during design and development of FISH Finder).
Given the location of a FISH signal, FISH Finder determines the distance between the signal and the nearest point on the estimated nuclear boundary using the Euclidean distance measurement. FISH Finder then computes the radial distribution ratio, which is the peripheral distance of the FISH signal divided by the average radius from the estimated nuclear boundary. The average radius of a segmented nucleus is determined by finding the radius of a circle with the same area as the segmented nucleus.
2.5 Result verification and editing
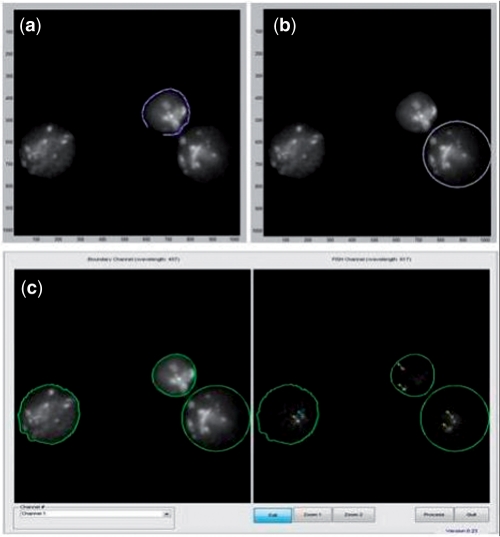
After processing image datasets, investigators can immediately choose to open FISH Finder's editing screen, which allows investigators to import folders of processed data (Fig. 2). The editing screen enhances the investigator's ability to edit the image data by allowing them to add or remove nuclei, to adjust a nuclear boundary and to add or remove FISH signals (Figs 1–3). FISH Finder incorporates two methods for redrawing boundaries of nuclei: polygon segmentation and ellipse segmentation. Polygon segmentation allows an investigator to manually select points around the nucleus to be segmented. The boundary points chosen by the user are not automatically smoothed, therefore accurate boundary segmentation is directly dependent upon the location and the number of chosen points (generally, a greater number of exact boundary points chosen results in more accurate segmentation). The ellipse segmentation allows an investigator to redraw a nuclear boundary by manipulating the size and shape of the boundary selection tool, which is restricted to the shape of ellipse. Generally, segmentation with the ellipse segmentation function is not as accurate to the actual nuclear border as the polygon segmentation function. However, the ellipse segmentation function is useful for quick segmentation studies that are not dependent upon accurate boundary segmentation, such as analysis of inter-probe distances. Finally, FISH Finder exports results of analysis as CVS files, which can be imported into many computer software programs (such as R and Microsoft Excel) for further analysis.
Fig. 2.
FISH Finder's boundary editing functions. (a) The polygon segmentation function allows users to manually add or redraw the nuclear boundary by using the left mouse click button to select points around the nucleus to be segmented. (b) The ellipse segmentation function allows users to manually add or redraw the nuclear boundary by manipulating the size and shape of the elliptical selection tool by holding and dragging the left mouse click button on the selection tool. (c) Results of both the polygon and ellipse segmentation function.
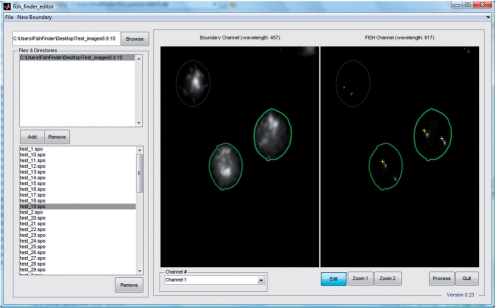
Fig. 1.
FISH Finder editor window showing results from the segmentation process. Segmented nuclei containing two identified FISH signals are outlined in bright green, segmented nuclei containing only one identified signal are outlined in light green and segmented nuclei with no identified signals are outlined in dark green. Signals can be added or removed by selecting the Edit button and then selecting the point of interest on the image using the right mouse click button (signals identified by FISH Finder are labeled by a yellow cross-hair; signals marked by an investigator in FISH Finder's editing screen are labeled by a blue cross-hair). Segmented nuclei can be removed by clicking the middle mouse click anywhere inside the boundary.
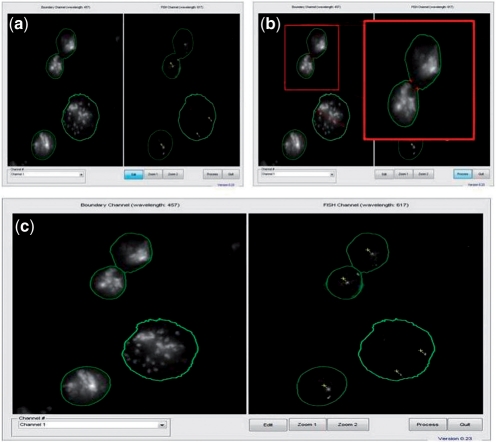
Fig. 3.
FISH Finder's nuclei division function. (a) Results of automated analysis show the segmented boundaries of two nuclei adjoined. (b) The nuclei division function allows users to select two neutral points between adjoined nuclei to be divided. Division points are determined by first selecting the edit button at the bottom of the Editor screen, and then points are chosen by the user on the image itself using the left mouse click button. (Enlarged image shows the two points selected for division as two red crosshairs.) (c) Results of the nuclei division function showing adjoined nuclei divided as two separate nuclear boundaries (left, DAPI; right, FISH signals).
3 RESULTS
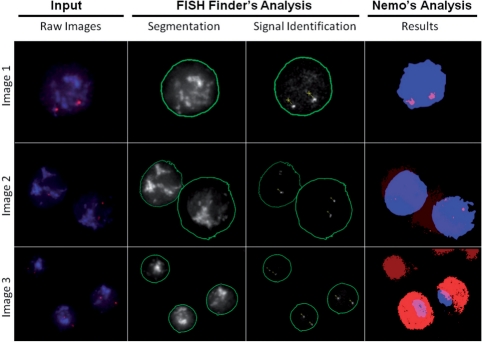
To evaluate the performance of our adaptive threshold method of segmentation in comparison with a fixed threshold method, we compared FISH Finder with Nemo (Iannuccelli et al., 2010). We tested both FISH Finder and Nemo using 64 FISH images containing 84 nuclei from a FISH experiment in which nuclei from mouse embryonic stem cells (ESCs) were stained with DAPI and a single bacterial artificial chromosome (BAC)-derived probe was hybridized to its complimentary DNA sequence within nuclei. FISH images were acquired using Applied Precision's Delta Vision fluorescent light microscope producing images in the (.dv) format. FISH Finder and Nemo were both tested on a desktop computer running Windows Vista operating system with an Intel Core 2 Quad 2.5 GHz processor. The analysis of each program was conducted using default input parameters and settings. This comparison demonstrates Nemo's inability to accurately segment nuclear boundaries in all tested images in contrast to FISH Finder's high efficiency and accuracy of nuclei segmentation (Fig. 4).
Fig. 4.
Comparison of results with three types of typical images obtained in FISH experiments. Shown are the raw (.dv) images, FISH Finder's unedited results of segmentation and signal identification, and Nemo's results of segmentation and signal identification. Image 1 demonstrates FISH Finder's accurate boundary segmentation and signal identification compared with Nemo's underestimation of the nuclear boundary with nonetheless accurate signal identification. Results of analysis for Image 2 demonstrate failure of nuclei segmentation and signal identification for both programs; showing over- and underestimation of a nuclear boundary and failure to identify one of four signals by FISH Finder and underestimation of nuclear boundaries and failure to identify all signals by Nemo. Image 3 shows FISH Finder's accurate nuclei segmentation and signal identification compared with Nemo's results of inaccurate segmentation and false-positive FISH signal identification.
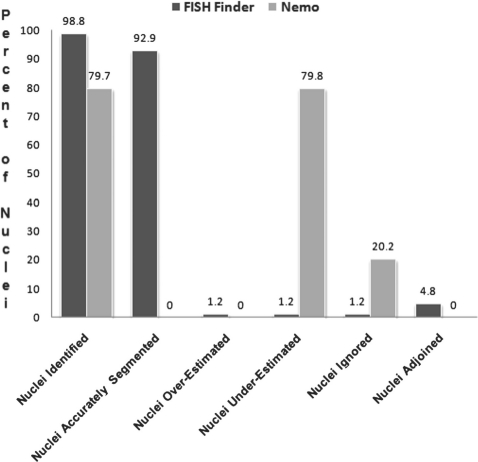
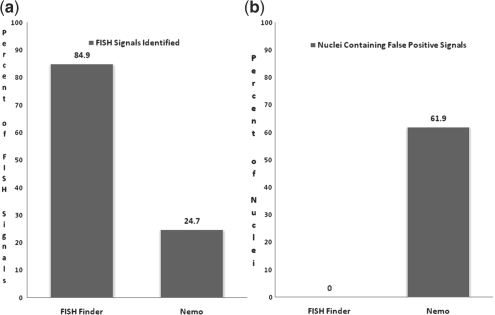
To compare the performance of FISH Finder and Nemo, we examined the unedited results of segmentation analysis from each program for the following categories: nuclei Identification, i.e. percentages of nuclei that are precisely identified as valid nuclei to be further analyzed; nuclei accurately segmented, i.e. percentages of nuclei with boundaries accurately segmented and not over- or underestimated; nuclei overestimated, i.e. percentage of nuclei with segmented boundaries larger than actual boundaries determined by eye; nuclei underestimated, i.e. percentage of nuclei with segmented boundaries smaller than actual nuclear boundaries determined by eye; nuclei ignored, i.e. percentage of nuclei that were not identified as valid nuclei to be analyzed; and nuclei adjoined, i.e. percentage of nuclei with adjoining segmented boundaries (Fig. 5). Using the same test image set, we also compared the results of accurate FISH signal identification and rate of false-positive FISH signal identification (Fig. 6). FISH Finder outperformed Nemo in every category except nuclei overestimated and nuclei adjoined. Additionally, the time required for analysis by FISH Finder was significantly less than that of Nemo, where processing with FISH Finder took ∼30 min compared with ∼5 days with Nemo.
Fig. 5.
Analysis of unedited results from FISH Finder and Nemo.
Fig. 6.
(a) Comparison of accurate FISH signal identification. FISH finder accurately identified 84.9% of FISH signals compared with Nemo which accurately identified 24.7%. (b) Comparison from analysis of FISH Finder and Nemo showing percentage of nuclei containing false-positive FISH signals. Nemo identified false-positive FISH signals in 61.9% of nuclei compared with FISH Finder in which 0% of nuclei contained false-positive signals.
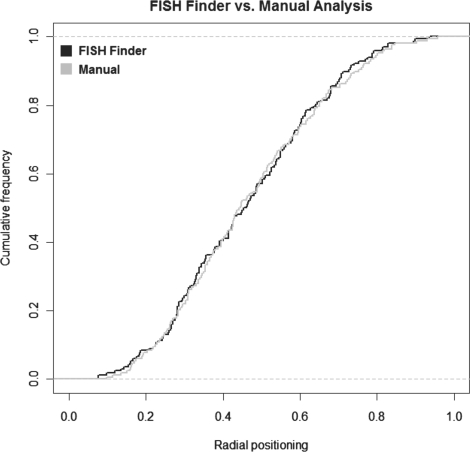
We next compared the edited results of FISH Finder's analysis to the results of manual analysis of radial positioning. Results from testing Nemo with the image set did not produce enough valid data points in order to fairly quantify and compare graphically. In order to produce valid data to compare, Nemo would require optimization of input parameters for each individual FISH image, in contrast to FISH Finder which does not require user-defined input parameters for automatic segmentation analysis. Using Applied Precision's Softworx program, manual analysis was conducted by measuring distance of each signal to the nuclear boundary as well as measuring the average diameter as judged by eye. The peripheral distances are then computed as a ratio of the average radius for each nucleus to determine the radial distribution of a target locus being studied. Figure 7 shows the cumulative distribution of radial ratios of FISH Finder results and manual analysis revealing a close correspondence. For our analysis, we were unable to fairly compare Nemo's results of image analysis due to the high percentage of inaccurately segmented nuclei as well as the high rate of false signal identification present in the processed image results.
Fig. 7.
FISH Finder's analysis of distance to periphery compared with results of manual analysis.
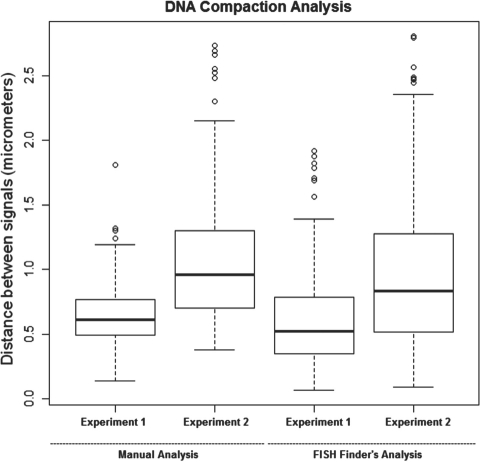
In addition to radial position analysis, FISH Finder will also compute the shortest distance between FISH signals of alternate fluorescent staining (Fig. 8). To compare FISH Finder's analysis of inter-probe distances to manual measurements, we analyzed two experiments, one providing an example of a compacted region (Experiment 1) and the other showing a de-compacted region (Experiment 2). In each case the two differentially labeled BACs were ∼700 kb apart. Results revealed that Fish Finder accurately determined the distances between loci preserving organizational trends observed by manual data collection.
Fig. 8.
FISH Finder's analysis of inter-probe distances compared with manual analysis.
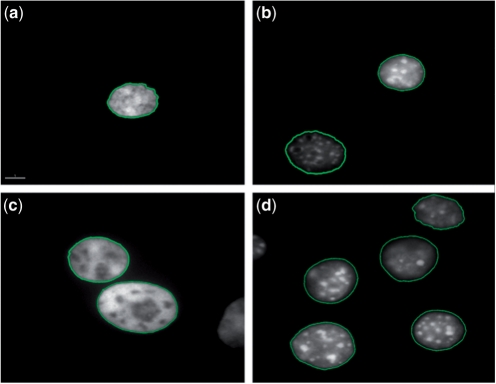
FISH Finder was developed using FISH images acquired from experiments on ESCs from the species Mus musculus, which has an unusual distribution of heterogeneously compacted DNA revealing regions of dense and loose compacted DNA when stained with DAPI. In fact, FISH Finder was used to objectively analyze FISH experiments in a study of the effects of the histone methyltransferase G9a on the subnuclear position of seven genes (Yokochi et al., 2009). To confirm FISH Finder's potential for application to other cell types or species as well as 2D and 3D FISH analysis, here we show in all cases nuclei segmented accurately to the edge of DAPI staining for 2D-fixed Chinese Hamster ovary (CHO) cells, 2D-fixed C127 mouse fibroblasts cells, 2D-fixed human lymphoblast cells with acute lymphoblastic leukemia (ALL) and 3D-fixed mouse ESCs (Fig. 9).
Fig. 9.
Segmentation of (a) 2D-fixed human ALL nucleus. (b) 2D-fixed Mouse C127 nucleus. (c) 2D-fixed CHO nuclei. (d) 3D-fixed mouse ESC nuclei.
We have also attempted to systematically compare FISH Finder with a tool proposed by Gudla et al. (2008). Since this tool was designed to analyze images collected at lower magnification containing a high density of aggregated cells, whereas FISH Finder was designed to analyze well separated cells at higher magnification, it was not possible to make a fair comparison of the performance of these programs.
4 CONCLUSION
FISH Finder is an important analysis tool capable of automatically extracting nuclear boundaries via compound Bayesian classifier, localizing FISH signals and saving data in the CVS format for future reference, significantly enhancing investigators' ability to verify data. Consequently, FISH Finder minimizes errors due to manual FISH analysis by reducing the cognitive bias of an investigators' judgmental process. More importantly, FISH Finder is a highly efficient user-friendly software tool capable of high-throughput FISH image analysis.
The functionality of FISH Finder can be enhanced and extended in several ways. For example, it can be generalized to segment cell nuclei in three dimensions: one way is to segment the images in a Z-stack one by one; the resulting segmentation can then be combined into 3D models of nuclei by interpolating signed distance functions to the segmented nuclear boundaries. With 3D models, the distance from FISH probes to the nuclear boundary in the 3D space can be computed, leading to biologically more accurate results. While most biologists prefer using familiar tools for the analysis, common analysis tools can be readily incorporated into FISH Finder itself. Additionally, FISH Finder can be modified and adapted to analyze other fluorescent signal types such as chromosome territories or identification of doublets and singlets for replication timing analysis or identification of more than two FISH signals for evaluating aneuploidy. We have included a ‘New Issues’ tab on the program download web page where users can start a forum for problems or suggestions.
While FISH Finder produces satisfactory results on all datasets we have used, it is based on a discriminative model, even though it is more robust and accurate than some other systems by employing a contextual classifier via compound Bayesian classifier. A fundamentally different approach is to adopt a generative model-based approach (e.g. Tu and Zhu, 2002), that is, a model that can explain the observed pixel patterns. One such a model would be a parametric description of each nucleus and the number of nuclei in an image; for example, for the image shown in Figure 9d, an ideal result would consist of five nuclei with different shapes. Intrinsic advantages of a generative model would allow 3D measurements within a nucleus as well as modeling of interactions among nuclei, leading to more accurate results even when multiple nuclei are very close to each other. This is being investigated.
ACKNOWLEDGEMENTS
We would like to thank the following people for their contributions to the Development of Fish Finder: Ichiro Hiratani, Mari Itoh and Junjie Lu.
Funding: National Institutes of Health (GM083337).
Conflict of Interest: none declared.
REFERENCES
- Andrey P., et al. Statistical analysis of 3D images detects regular spatial distributions of centromeres and chromocenters in animal and plant nuclei. PLoS Comput. Biol. 2010;6:e1000853. doi: 10.1371/journal.pcbi.1000853. [DOI] [PMC free article] [PubMed] [Google Scholar]
- Duda R., et al. Pattern Classification. New York: Wiley-Interscience Publication; 2000. [Google Scholar]
- Gudla P.R., et al. A high-throughput system for segmenting nuclei using multiscale techniques. Cytometry A. 2008;73:451–466. doi: 10.1002/cyto.a.20550. [DOI] [PMC free article] [PubMed] [Google Scholar]
- Heintzmann R., et al. Double-pass Fourier transform imaging spectroscopy. Opt. Express. 2004;12:753–763. doi: 10.1364/opex.12.000753. [DOI] [PubMed] [Google Scholar]
- Iannuccelli E., et al. NEMO: a tool for analyzing gene and chromosome territory distributions from 3D-FISH experiements. Bioinformatics. 2010;26:696–697. doi: 10.1093/bioinformatics/btq013. [DOI] [PubMed] [Google Scholar]
- McCullough P.D., et al. Segmentation of whole cells and cell nuclei from 3-D optical microscope images using dynamic programming. IEEE Trans. Med. Imaging. 2008;27:723–734. doi: 10.1109/TMI.2007.913135. [DOI] [PMC free article] [PubMed] [Google Scholar]
- Nandy K., et al. Automatic nuclei segmentation and spatial FISH analysis for cancer detection. Eng. Med. Biol. Soc. 2009:6718–6721. doi: 10.1109/IEMBS.2009.5332922. [DOI] [PMC free article] [PubMed] [Google Scholar]
- Pernthaler J., et al. Automated enumeration of groups of marine picoplankton after fluorescence in situ hybridization. Appl. Environ. Microbiol. 2003;69:2631–2637. doi: 10.1128/AEM.69.5.2631-2637.2003. [DOI] [PMC free article] [PubMed] [Google Scholar]
- Shopov A., et al. Improvements in image analysis and fluorescence imcroscopy to discriminate and enumerate bacteria and viruses in aquatic sample. Aquat. Microb. Ecol. 2000;22:103–110. [Google Scholar]
- Tu Z., Zhu S.-C. Image segmentation by data-driven Markov chain Monte Carlo. IEEE Trans. Pattern Anal. Mach. Intell. 2002;24:657–673. [Google Scholar]
- Yokochi T., et al. G9a selectively represses a class of late-replicating genes at the nuclear periphery. Proc. Natl. Acad. Sci. USA. 2009:19363–19368. doi: 10.1073/pnas.0906142106. [DOI] [PMC free article] [PubMed] [Google Scholar]


