

Abstract
Lateral gene transfer (LGT) plays a major role in prokaryote evolution with only a few genes that are resistant to it; yet the nature and magnitude of barriers to lateral transfer are still debated. Here, we implement directed networks to investigate donor–recipient events of recent lateral gene transfer among 657 sequenced prokaryote genomes. For 2,129,548 genes investigated, we detected 446,854 recent lateral gene transfer events through nucleotide pattern analysis. Among these, donor–recipient relationships could be specified through phylogenetic reconstruction for 7% of the pairs, yielding 32,028 polarized recent gene acquisition events, which constitute the edges of our directed networks. We find that the frequency of recent LGT is linearly correlated both with genome sequence similarity and with proteome similarity of donor–recipient pairs. Genome sequence similarity accounts for 25% of the variation in gene-transfer frequency, with proteome similarity adding only 1% to the variability explained. The range of donor–recipient GC content similarity within the network is extremely narrow, with 86% of the LGTs occurring between donor–recipient pairs having ≤5% difference in GC content. Hence, genome sequence similarity and GC content similarity are strong barriers to LGT in prokaryotes. But they are not insurmountable, as we detected 1530 recent transfers between distantly related genomes. The directed network revealed that recipient genomes of distant transfers encode proteins of nonhomologous end-joining (NHEJ; a DNA repair mechanism) far more frequently than the recipient lacking that mechanism. This implicates NHEJ in genes spread across distantly related prokaryotes through bypassing the donor–recipient sequence similarity barrier.
In prokaryote genomes, genes come to reside in the DNA via clonal replication, lateral gene transfer (LGT), and combinations thereof (Milkman and Bridges 1990). Genomic studies leave no doubt that LGT plays a qualitatively and quantitatively substantial role in prokaryote genome evolution (Doolittle 1999; Ochman et al. 2000), with virtually all genes affected by it and only a few genes, if any, that are genuinely resistant to it (Sorek et al. 2007). The impact of LGT on our understanding of the network-like—as opposed to the tree-like—nature of microbial evolution is far-reaching, as is its impact on human health via pathogenicity islands (Groisman and Ochman 1996).
The temporal process of lateral gene acquisition can be divided into three stages (Ochman et al. 2000; Thomas and Nielsen 2005): DNA import into the cytoplasm, integration of the acquired DNA into the genome, and adaptive/selective processes acting within the genome that influence clonal inheritance to subsequent generations (Perez and Groisman 2009). Prokaryotes rapidly delete nonfunctional or otherwise unneeded DNA from their genomes (Moran 2002), such that the fixation or loss of acquired DNA within the genome is highly dependent on its utility to the recipient under selectable environmental conditions. The nature of the enzymatic mechanisms of DNA integration into the genome following the import into the cytoplasm usually depends on the mechanism of DNA transfer, of which four main types are distinguished: transformation (Chen and Dubnau 2004), transduction (Thomas and Nielsen 2005), conjugation (Chen et al. 2005), and gene transfer agents (Lang and Beatty 2007).
In order to be expressed, acquired genes either have to be inserted near, or acquired with a recognized promotor. Genes that are inserted within existing operons (Davids and Zhang 2008) or have a promotor of similar GC content as the recipient genomes (Sorek et al. 2007) have a higher probability to become fixed within the recipient, notwithstanding codon bias and amelioration (Ochman et al. 2000; Ragan et al. 2006). LGT generates genealogies among genomes with unidirectional donor–recipient relationships, corresponding to directed networks (Barabási et al. 2000).
A directed network is a graphical representation of a set of entities, or vertices, linked by edges that represent the connections or interactions between these entities. A directed network of N vertices can be fully defined by a matrix, A = [aij]N*N, with aij ≠ 0 if a directed edge is pointing from node i to node j, and aji ≠ 0 if a directed edge is pointing from node j to node i. The out and in degrees of any given vertex are defined as the number of edges that are directed from or into the vertex, respectively (Fig. 1; Palla et al. 2005, 2007; Leicht and Newman 2008; Foster et al. 2010). In the case of LGT and genomes, the edge weight aij counts the number of genes transferred from genome i to genome j, and the out and in degrees correspond to the number of connecting donors and recipients per genome.
Figure 1.

(A) A directed network. The circles represent nodes in the network. Arrows represent directed edges connecting between nodes. Edge weights are denoted by Arabic numerals attached to the edge. (B) A binary matrix representation of the directed network. If there exists a directed edge from node i to node j in the matrix, then cell aij = 1. Otherwise, aij = 0. The number of ingoing edges (IN degree) of each node is defined as the sum of the corresponding column. The number of outgoing edges (OUT degree) of each node is the sum of the corresponding row. (C) A weighted matrix representation of the directed network. Cells in the matrix correspond to the edge weight of edges connecting between nodes i and j. The column sums are the total edge weight of ingoing edges. The row sums are the total edge weight of outgoing edges.
Directed networks are still quite rare in the literature because they demand specific information about the polarized nature of connections (edges) between entities (vertices), for example, who-to-whom telephone calls (Palla et al. 2007), internet browsing paths (Barabási et al. 2000), metabolic pathways (Jeong et al. 2000), or microRNA targeting schemes (Tsang et al. 2010). In the case of prokaryote genome sequence data, the LGT donor–recipient relationships are not known a priori, but they can be estimated for recently acquired DNA sequences through analyses of codon bias, GC content, and nucleotide pattern frequencies (Garcia-Vallve et al. 2000; Nakamura et al. 2004).
Here we report the use of directed networks of recent acquired genes to study LGT-mediated prokaryote genome evolution. The directed networks allow us to formulate and test a wide range of hypotheses regarding LGT patterns and mechanisms operating in nature.
Results
A directed network of recent LGT
To obtain a matrix of recent LGTs, we first scanned the completely sequenced genomes of 657 prokaryote species encoding 2,129,548 proteins for recently acquired genes. We used the criterion of genic GC content that deviated from the genome as a whole (Ochman et al. 2000). This identified 446,854 protein-coding genes (21% of the total) as recently acquired, corresponding to 20 ± 9% recent gene acquisitions per genome, whereby the number of acquired genes per genome correlates positively with genome size (r = 0.93, P ≪ 0.01, using Spearman test). This estimate for the fraction of foreign genes per genome is consistent with other studies using similar methods (Garcia-Vallve et al. 2000; Nakamura et al. 2004).
Within this set of 446,854 acquisitions, we then sought potential donors. While identifying recent acquisitions is relatively straightforward, determining possible donors is far more difficult. Our process of donor identification involves a serial application of GC content, sequence similarity, and individual gene tree comparisons with the goal of finding the genome within our sample or ancestral node within the respective gene tree that would correspond to the most likely donor within the genome sample (for details, see the Methods section). This does not, of course, identify the exact biological donor, which is unlikely to be included in our small sample, but identifies the most likely donor among the genomes available. The method is conservative and specifies a donor for 32,028 (7%) of the recently acquired genes. In those cases, we have good information about the nature of the recipient and some information about the nature of the donor. We call these cases directed recent LGT events, or dLGTs.
For most of the acquired genes (85%) we found no homologs that satisfy the sequence similarity and nucleotide content variation threshold criteria that we set for calling a dLGT. For the remaining 8% acquired genes we could not infer the LGT reliably. The number of completely sequenced genomes per genus explains 29% (P ≪ 0.01, using Spearman test) of the variation in the proportion of dLGT to gene acquisitions per species; hence, the genome sample is a limiting factor for donor identification. With increasing sample size, larger proportions of dLGTs among the recent LGTs will ensue.
All 32,028 polarized lateral recipient–donor protein-coding gene transfer events were summarized into a directed LGT network (Fig. 2A). The total data comprises 657 contemporary species and 656 ancestral species (internal nodes in the reference tree). Discarding all genomes and ancestors for which no donor–recipient relations were inferred results in a smaller network comprising 715 vertices that are either contemporary genomes (545) or ancestors (170). The vertices are connected by 3021 directed edges that are the actual inferred gene transfer events, pointing from the donor vertex to the recipient vertex. Edge weights (aij) in this network are the number of genes that were transferred from donor i to recipient j. The total of all edge weights is the number of protein-coding gene transfers in the network.
Figure 2.

(A) The directed network of recent lateral gene transfers. Node color corresponds to the taxonomic group of donors and recipients listed at the bottom. Connected components of endosymbionts are marked with numbers: (1) Helicobacter, (2) Coxiella, (3) Bartonella, (4) Leptospira, (5) Legionella, (6) Ehrlichia. Clusters of cyanobacteria are marked with letters: (a) high-light adapted Prochlorococcus, (b) low-light adapted Prochlorococcus, (c) marine Synechococcus, (d) other Synechococcus, (e) Nostocales and Chroococcales. Enlarged images of clusters (right) are marked with asterisks. Species names are written by the vertices. Annotations of transferred genes appear next to the edges. (B) Community structure within the largest connected component of the dLGT network (for the entire network, see Supplemental Fig. S2). Vertices that are grouped into the same module are colored the same. (C) Pathogens in the largest connected component of the dLGT network (for the entire network, see Supplemental Fig. S6). The arrow marks a nonpathogen (Bukholderia thailandensis) within a pathogenic community.
Biological examples within the directed network
The dLGT network contains a main connected component of 430 vertices and 63 additional connected components including between two and 44 vertices, with 285 vertices in total. The small components are species that are connected by recent LGT events among themselves, but no dLGT was identified between them and species included in the main connected component, on the basis of the present sample. These small groups typically comprise intracellular pathogens or endosymbionts, such as Legionella pneumophila, Leptospira interrogans, and the like, whose host-associated life style is a barrier to LGT, although they are sometimes able to exchange genes among themselves (Russell and Moran 2005). The endosymbiont-specific connected components are an important internal positive control for this directed network approach to LGT, because from the underlying biology of these organisms we know that they should be rarely connected via recent LGT to other species. The dLGT network method recovers that result. Cyanobacteria form seven distinct connected components within the network. These include high-light adapted Prochlorococcus (10 nodes), two connected components of low-light adapted Prochlorococcus (three and two nodes), three connected components of Synecococcus (eight, two, and two nodes), and Chroococcales with Nostocales (four nodes). In other words, the cyanobacteria in our network are assorted into dLGT donor–recipient-connected components both by genus and by habitat.
The network comprises 662 acquiring genomes and 658 donating genomes, with 598 genomes that are specified as both. Most of the species within the network are connected with only a few other vertices. The number of donors per acquiring species (in degree) ranges between one and 34, with 25% (164) of the vertices connected to a single donor (Fig. 3A). A total of 25 (4%) species are connected to more than 15 different donors; these are mainly found within Enterobacteriales (γ-proteobacteria), Burkholderiales (β-proteobacteria), and staphylococci (Bacilli). The species harboring the highest frequency of recent acquisitions is Citrobacter koseri str. ATCC-BAA-895 (γ-proteobacteria), with 146 in degree proteins. C. koseri is a bacterium that can reside either as a free-living species in soil and water or as a human commensal; it is notable that all of the donors connected to it are Enterobacteriales.
Figure 3.

Distribution of connectivity and edge weight in the dLGT network.
The number of recipients per donating species (out degree) ranges between one and 25 recipients, with a majority of a single recipient per donor (159; 25%) (Fig. 3A). The most frequently donating species is E. coli str. HS, and all of its 25 recipients are Enterobacteriales. Vertex in and out degrees are positively correlated (rs = 0.78, P ≪ 0.01); hence, species in the dLGT network are similarly connected as recipients and donors. Both species in and out degrees are weakly correlated with genome size (rs = 0.38 and rs = 0.39, respectively, P ≪ 0.01).
The distribution of edge weight within the dLGT network is linear in log–log scale; hence, most of the donor–recipient connections only entail a few genes (Fig. 3B). Edges of a single transferred gene are frequent within the dLGT network (1098; 36% of the total), while edges of >20 genes are rare (354; 12%). Most of the heavy edges are concentrated within the heavily connected clusters, which are in turn connected by weaker edges (Supplemental Fig. S1). Edges connecting vertices from the same higher taxonomic group have significantly higher weights than those connecting vertices from different groups (P ≪ 0.01, using the Kolmogorov-Smirnov test).
Community structure in the directed network of recent LGT
Communities within a network are groups of vertices that are more densely connected among each other than with vertices outside of the group. We examined community structure within the dLGT network using a modularity optimization method that makes an explicit use of the information contained in edge directions (Leicht and Newman 2008). That procedure reveals 85 communities containing between two and 55 vertices, with a median of three vertices per community (Fig. 1B). The main cluster in the dLGT network includes 18 connected communities. Only eight communities include species from different higher taxonomic groups, while the rest of the communities are taxonomically homogeneous. The largest taxonomically heterogeneous community is within the main cluster (community 1 in Fig. 2B). It includes 55 vertices from β-proteobacteria (33), γ-proteobacteria (15), δ-proteobacteria (four), α-proteobacteria (two), and Euryarchaeota (one). The vertices within the communities are connected by 2383 edegs, of which 2341 (98%) are within the same taxonomic group, and 42 (2%) are between species from different groups. The top recipient in this module is Herminiimonas arsenicoxydans, a heterotrophic β-proteobacterium that was isolated from heavy metal contaminated sludge from an industrial water-treatment plant (Muller et al. 2006). The donors connected to H. arsenicoxydans are Parvibaculum lavamentivorans, an α-proteobacterium isolated from urban sewage treatment plants (Schleheck et al. 2000), and Xanthomonas campestris str. vesicatoria 85-10, a plant parasitic γ-proteobacterium that can live in both soil and water. All of the seven genes transferred from P. lavamentivorans to H. arsenicoxydans are hypothetical proteins. One of the two genes that H. arsenicoxydans acquired from X. campestris is an integrase that also has homologs in other soil bacteria such as Burkhoderiales and Pseudomonadales (Muller et al. 2007), suggesting that a soil phage might be common to and link these genomes.
The most heavily connected higher taxa are β-proteobacteria and γ-proteobacteria, with 64 (42%) edges out of the 150 edges that link higher taxa in the network, and including 13 conjugation/transferase genes and three integrases. Most of the transfers occur among soil bacteria such as Burkholderiales, Xanthomonadales, and Pseudomonadales. Another common order in this subset is the Alteromonadales, represented by the Shewanella sp. str. ANA-3. This γ-proteobacterium was isolated from an arsenate-treated wooden pier located in a brackish estuary (Saltikov et al. 2003). The genus Shewanella usually resides in marine habitats, so that their link to this subset is probably due to gene exchange with aquatic Burkholderiales.
The second most frequent subset of recent intergroup edges is that of Clostridium and Bacillus species (32 edges). Most of the edges connect soil-dwelling bacteria such as Bacillus cereus str. ATCC 10987 and Clostridium kluyveri str. DSM 555. Three edges in the dLGT network connect between human pathogens from these groups, the Finegoldia magna str. ATCC 29328 and Streptococcus pyogenes str. MGAS10750. The 32 genes transferred between these groups comprise both conjugative transposons and phage proteins, implicating both conjugation and transduction in transfer mechanisms.
Although ancient LGT between eubacteria and archaebacteria is very common and well documented among genomes within our sample, for example, Thermotoga maritima (Nelson et al. 1999) or Methanosarcina mazei strain Gö1 (Deppenmeier et al. 2002), only one recent LGT edge connects eubacteria to archaebacteria in Figure 2A, with a recent transfer of a methyltransferase from Geobacter uraniumreducens str. Rf4 to the uncultured methanogenic archaeon RC-I. The recipient was isolated from the rice rhizosphere (Erkel et al. 2006), while the donor belongs to the Geobacteraceae that resides both in soil and water and is probably capable of nitrogen fixation (Holmes et al. 2004). We note, however, that the genome sample of archaebacterial species in the public databases is very limited.
A striking observation from the dLGT network is that most dLGT occurs between donors and recipients within the same taxonomic group (these are nodes having the same color in Fig. 2A). Closely related species from the same taxonomic group usually have similar genomes. The high frequency of edges among closely related genomes implies that the majority of recent LGT occurs among similar species having similar genomes, as has often been suggested from individual case studies (Mau et al. 2006). The present network analysis provides the means to specifically test this idea for many genomes simultaneously with regard to recent LGT events.
Recent LGT frequency correlates to pairwise genome similarity
Early genetic studies in the E. coli and B. subtilis systems showed that the frequency of gene acquisition via recombination is dependent upon the similarity of donor and recipient genes (Majewski and Cohan 1998). We asked whether this same tendency could be observed at the whole-genome level for 657 sequenced genomes. Here we used three different donor–recipient genome similarity measures calculated directly from the genome sequences of the donor and recipient. The first is similarity of genome sequence (Sgs), calculated as the proportion of ≥20-bp subsequences in the recipient genome that are found in a perfect match with the donor genome, providing a proxy for the likelihood of gene acquisition mediated by homologous recombination. The Sgs is similar to the recently suggested average nucleotide identity (ANI) measure that positively correlates with DNA–DNA hybridization in prokaryotes (Richter and Rosselló-Móra 2009) (rs = 0.85, P = 5.16 x 10⁻¹⁶, n = 54). Hence, the Sgs is also equivalent with phylogenetic proximity. The second is similarity of proteomes (Spr), calculated as the proportion of recipient genome proteins that share an orthologous protein family (orthogroup) with the donor proteome; it is a proxy for similar ecological lifestyles based on gene content (Chaffron et al. 2010). The third is similarity of GC content (Sgc), which is calculated as the similarity between the genomic GC content of the donor and recipient.
The Sgs and Spr measures are nonsymmetric; hence, in the comparison of a species pair, the designation of donor and recipient may yield slightly different results. These genome similarity measures correlate, but not strictly so, with phylogenetic classification (Supplemental Fig. S3). For example, in a comparison between Donor: Escherichia coli str. CFT073 and Recipient: E. coli APEC 01, the following similarity measures are calculated: Sgs = 86.2%, Spr = 81.3%, and Sgc = 99.3%. With the same donor and a recipient from different species, but still within the E. coli complex, Shigella flexneri str. 2a, the similarity measures are: Sgs = 60%, Spr = 72.3%, and Sgc = 96.6%. For a recipient from within the enterobacteriales (same order), Salmonella typhi, the values are Sgs = 8.6%, Spr = 64.7%, and Sgc = 98.4%. These values may change across taxonomic groups and ecological niches.
Particularly low Sgs values are observed among cyanobacteria. A comparison between Donor: Prochlorococcus marinus str. MED4 and Recipient: Prochlorococcus marinus str. MIT 9313 results in: Sgs = 0.92%, Spr = 73.3%, and Sgc = 92.8%. A comparison of the same donor with Recipient: Synechococcus sp. str. WH8102 results in Sgs = 0.034%, Spr = 54.2%, and Sgc = 71.4%. The low Spr in cyanobacterial species is attributable to the different ecological niches they inhabit (Rocap et al. 2003), while the low Sgs is due to their different genomic GC content, meaning different codon usage.
All possible species pairs in our genome set can be readily divided into two groups—those that are connected by a dLGT edge (connected genomes) and those that are not (disconnected genomes). The median in all three genome-similarity measures is significantly higher for connected genomes (Fig. 4; P ≪ 0.01 using the Wilcoxon test) than for unconnected genomes. Thus, dLGT recipients are more likely to acquire genes from donors of similar genome sequence, similar proteome, and/or similar genomic GC content than from genomes that are more distant by those criteria.
Figure 4.

Comparison of genome similarity measures for donor–recipient pairs and disconnected pairs.
All three genome-similarity measures correlate significantly with the number of transferred genes from the donor to the recipient. Directed gene acquisition frequency is positively correlated with genome sequence similarity Sgs (rs = 0.41, P ≪ 0.01), proteome similarity Spr (rs = 0.42, P ≪ 0.01), and Sgc (rs = 0.4, P ≪ 0.01). However, several species pairs having high genome similarity by all measures stood out by having very low frequencies of dLGT. Upon closer inspection, we find that many of those are pairs that include one or two host-associated species. Closely related endosymbionts (e.g., two Legionella strains) are highly similar by all similarity measures, yet they rarely donate or acquire genes because their symbiotic relation with the host is a barrier to LGT in many cases. Excluding symbiotic species from the correlation tests increases correlation between the number of transferred genes and genome sequence similarity (rs = 0.55, P ≪ 0.01), proteome similarity (rs = 0.53, P ≪ 0.01), and GC content similarity (rs = 0.47 P ≪ 0.01). A multiple correlation analysis using all three similarity measures as predictors of the frequency of transferred genes yielded a model of total R2 = 26% explained variability in the number of transferred genes. The variation in Sgs contributes 25% to the total explained variability, while variation in Spr contributed only 1%. GC similarity measure (Sgc) did not increase the variability explained by the model and was therefore omitted. We note, however, that the range of Sgc is highly limited within the network ranging between 75% and 99% GC content similarity (Fig. 4), with 86% of the donor–recipient having Sgc > 95%, and 53% of the pairs having Sgc > 99%. Accordingly, for the hundreds of genomes contained within this directed network, prokaryotes preferentially assimilate genes from donors with similar genome attributes in terms of sequence identity, GC content, and gene content.
The distribution of both Sgs and Spr show that the frequency of recently transferred genes in the dLGT network has a peak around 50% donor–recipient similarity, with a tail toward 100% similarity (Fig. 4). This occurs because the majority of recombination events between almost identical genomes cannot be detected by sequence comparison due to insufficient sequence divergence. Genomes having close to 100% similarity are always from the same species (Supplemental Fig. 3A). Hence, the resolution achieved using our LGT detection method yields a minimum of intraspecific recombination events within the dLGT network. The LGT events that are detected at high genome similarity levels are attributable to genes polymorphic for presence or absence within the population.
Recent LGT between distantly related species
Despite the prevalence of recent LGT from closely related donor genomes in the dLGT network, there remains a substantial fraction of transfers donated by species that are only distantly related to the recipient. For example, if we collapse the network so as to only depict dLGTs at the intergeneric level or higher, 157 vertices remain that are linked by 376 edges carrying 1530 proteins (Supplemental Fig. S4). Most of the small clusters in the complete dLGT network are condensed to vertices in the intergeneric network because they comprise intrageneric donors and recipients only. The edges that remain consist of intergeneric recent lateral gene transfers (irLGTs). The irLGT genus-level network includes one main connected component of 109 nodes with 145 genera, two smaller connected components of Actinobacteria and α-proteobacteria, and 12 additional tiny connected components of two or three genera each. Most of the irLGTs occur among Proteobacteria, again specifically within γ-proteobacteria and β-proteobacteria, and most events involve only one donor and recipient (Supplemental Fig. S4B). The median edge weight is one gene per edge (Supplemental Fig. S4C), similar to the dLGT network.
The establishment of DNA acquired by transduction is mediated by phage enzymes (Ochman et al. 2000; Thomas and Nielsen 2005) and LGT via conjugation and transformation typically involves homologous recombination (HR). But DNA acquired from a more distantly related donor is expected to be less similar to that of the recipient than DNA acquired during an intrageneric LGT, and the minimal requirements for homologous recombination—two anchors of 20–30 bp bearing nearly 100% similarity to the recipient chromosome in Bacillus subtilis (Majewski and Cohan 1999) or one anchor of identical 25 bp in E. coli (Lovett et al. 2002)—will often not be met. In such cases, other information-processing pathways must be involved in the incorporation of the acquired DNA within the recipient chromosomes. We turned our attention to nonhomologous end-joining.
LGT is mediated by nonhomologous end-joining
Nonhomologous end-joining (NHEJ) is a major DNA double-strand break repair (DSBR) mechanism that was first described in mammalian cells (Bassing and Alt 2004; Lieber et al. 2004). NHEJ involves the religation of two broken ends of a chromosome in the absence of long sequence homology. NHEJ can function either with only a few bases homology between the repaired chromosome ends, known as microhomology, or without microhomology in a blunt-directed repair. During religation, exogenous DNA may be captured in the chromosome, leading to insertion of DNA into the genome. In eukaryotes, DNA inserted into the genome by NHEJ during evolution may include foreign DNA fragments such as mitochondrial DNA, transposable elements, and viral DNA (Moore and Haber 1996; Ricchetti et al. 1999; Lin and Waldman 2001a; Lin and Waldman 2001b; Nakai et al. 2003; Hazkani-Covo and Covo 2008). The classical eukaryotic NHEJ machinery includes the KU70/80 heterodimer (KU), XRCC4, Ligase IV, and DNA-PKcs proteins (Bassing and Alt 2004; Lieber et al. 2004). A prokaryotic NHEJ pathway was predicted from whole-genome analyses, and later shown to be functional in B. subtillis (Aravind and Koonin 2001; Weller et al. 2002). The prokaryotic NHEJ is similar to the eukaryotic system in its reliance on a DNA end-binding Ku protein and a dedicated ATP-dependent DNA ligase (Lig4 in eukaryotes and LigD in prokaryotes). Contrary to the eukaryotic system that includes various factors promoting the end processing and ligation stages, in the prokaryotic system the ATP-dependent ligase includes an additional nuclease domain that enables interaction between the Ku and the LigD proteins, thus forming a two-component NHEJ system (Shuman and Glickman 2007).
There are 141 genomes in our sample that encode both Ku and LigD, 116 of which are inferred recipients in the dLGT network. If NHEJ is indeed involved in gene acquisition by LGT, then those genomes harboring Ku and LigD proteins should have a higher frequency of intergeneric dLGT than genomes that lack the nonhomologous end-joining proteins.
To test this, we divided the genomes in our sample according to the presence of both Ku and LigD proteins (NHEJ+), or the absence of one or both proteins (NHEJ–), and examined the distribution of Sgs, Spr, and Sgc for all donor–recipient pairs, comparing NHEJ+ and NHEJ– recipients. The average recipient genome similarity to the donor, using Sgs and Spr, is significantly lower in the NHEJ+ than the NHEJ– group (P = 0.029 and P = 1.4 x 10⁻⁷, respectively, using the Wilcoxon test) (Fig. 5). No significant difference in genomic GC content similarity was found between the two groups (P = 0.26, using the Wilcoxon test). To test for a possible bias in this result due to our genome sample, we repeated the test using all 657 sampled genomes regardless of their inclusion in the dLGT network, but found no significant difference in the genome similarity measures between the two groups. This shows that more frequent acquisition from distant donors in NHEJ+ genomes is not biased by the genome sample and that Sgs is the more sensitive measure among the three. The microhomologies typical of insertion via NHEJ (Hazkani-Covo and Covo 2008) could not be detected in the present data, probably due to the insufficiently dense genome sample.
Figure 5.

Comparison of genome similarity measures between NHEJ-positive and NHEJ-negative recipients.
Types of genes and types of genomes
Sorting all genes within the dLGT into functional categories using the COG scheme (Tatusov et al. 2003) revealed that the functional distribution of transferred genes is not random (P < 1 × 10⁻¹⁶, using the χ2 test) with most of the classified genes performing metabolism functions (7306; 29%). The most frequently transferred classes are amino acid transport and metabolism, energy production and conversion, and carbohydrate transport and metabolism. Genes involved in cellular processes and signaling comprise 3623 (14.4%), while information storage and processing genes are transferred less often than the other categories (2802; 11.1%) (Fig. 6). The distribution of donor–recipient genome similarity using all three measures is significantly different among the four main functional categories (Kruskal-Wallis test, Sgs: P < 1 × 10⁻¹⁵; Sgc: P < 1 × 10⁻¹⁶; Spr: P < 1 × 10⁻¹⁶). Donor–recipient similarity for transferred genes in the information storage and processing category is significantly lower than all other functional categories by all genome similarity measures (α = 0.05, using Tukey post hoc comparisons).
Figure 6.

Frequency of transferred genes by functional category and donor–recipient genome similarity.
Most of the transferred genes are either unclassified in the COG database or are classified in COG as unknown (11,470; 45.5%). The distribution of recipient taxa within the unknown genes shows that β-proteobacteria and Clostridia recipients include disproportionately higher numbers of unknown genes in the dLGT network. In contrast, Bacilli and γ-proteobacteria recipients (Supplemental Fig. S5) contain more classified genes than their proportion in the dLGT network.
What kinds of organisms are involved in recent LGT? Using NCBI's organism information table (http://www.ncbi.nlm.nih.gov/genomes/lproks.cgi) we classified 433 sequenced species in the dLGT network into 261 pathogens and 172 nonpathogens. Most of the edges within the network connect pathogenic recipients and donors (Fig. 2C). To test whether this result is biased by our genome sample, which contains a majority of pathogens (299 vs. 254 nonpathogens), we compared these frequencies with the expected number of edges among all 657 genomes regardless of their inclusion in the dLGT network. The observed edge frequency within the pathogens/nonpathogens groups is independent of the genome sample alone (P = 0.06, using the χ2 test), with edges from a pathogenic donor to a pathogenic recipient over-represented in the network. Pathogenic species have a significantly higher in degree and out degree in comparison to nonpathogenic species (P < 1 × 10⁻¹⁶ in both cases using the one-tailed Kolmogorov-Smirnov test; Supplemental Fig. S7). However, donor–recipient pairs having Sgs <10% reveal similar in and out degrees for edges connecting to pathogens and nonpathogens, respectively (P < 1 × 10⁻¹⁶ using the Kolmogorov-Smirnov test). Moreover, pairs of pathogenic donor and recipient connected by a LGT event have a significantly higher Sgs and Spr than other pathogenic and nonpathogenic donor and recipient combinations (P < 1 × 10⁻¹⁶ using the Kruskal-Wallis and Tukey post-hoc comparisons). Hence, for closely related donors and recipients, pathogens receive and donate genes by LGT more frequently than nonpathogenic species. The modules in the dLGT can be classified with regard to pathogenicity of the connected species. A total of 39 modules comprise only nonpathogens, 27 modules comprise only pathogens, 17 modules are mixed pathogens and nonpathogens, and the remaining two are of an unclassified species (Fig. 2C). Module no. 4 (Fig. 2B,C, arrow) is an example of a mixed community that includes five pathogens, four nonpathogens, and 18 unclassified species. In this module we detected abundant recent LGT between the nonpathogenic Burkholderia thailandensis str. E246 and pathogenic Burkholderia, including B. pseudomallei strains K96243, 1710b, and 1106a, and B. mallei strains ATCC 23344, NCTC 10229, SAVP1, and NCTC 10247. B. thailandensis and B. pseudomallei are considered as two distinct species (Gevers et al. 2005); however, their genomes are highly similar in sequence and content (Yu et al. 2006). The abundant lateral gene transfer among these genomes is thought to be mediated mainly by transduction (Summer et al. 2007). We find evidence for LGT by transduction in the transferred phage genes such as phage minor tail protein (Donor: B. pseudomallei str. K96243 to Recipient: B. thailandensis str. E246) and phage major tail tube protein (Donor: B. pseudomallei str. 1710b to Recipient: B. thailandensis str. E246). The dLGT network reveals that nonpathogens can sometime mediate gene transfer between pathogenic populations.
Discussion
Directed networks in which donor–recipient relations are coded as polarized vectors, as they occur in nature, open up fundamentally new avenues of pursuit in the investigation of microbial genome dynamics. Among 2,129,548 proteins in 657 prokaryotic genomes, we identified 446,854 as having been recently acquired on the basis of their aberrant nucleotide pattern properties relative to the rest of their genome. For 32,028 of those genes we inferred the identity of the donor among the present sample based on sequence identity, GC content, and phylogenetic reconstruction. With improved genome sampling or in metagenomic data of finite complexity, such as intestinal flora (Warnecke et al. 2007), the proportion of specifiable donors in the data, hence, the density of the directed network for recent transfers should improve.
The dLGT network reveals a high correlation between donor–recipient genome similarity and lateral gene-transfer frequency. Hence, the majority of recent LGT events in the dLGT network occur among closely related species. This finding is in agreement with earlier suggestions that there exists a gradient of LGT frequency that is higher within taxonomic groups and lower between taxonomic groups (Gogarten et al. 2002; Puigbò et al. 2010). The high LGT frequency between similar genomes can be largely explained by the mechanisms for LGT in prokaryotes. The incorporation of acquired DNA into the recipient genome in both transformation and conjugation is commonly mediated by homologous recombination (Thomas and Nielsen 2005). Thus, gene acquisition by these two LGT mechanisms has an inherent donor–recipient sequence similarity threshold. In contrast, during gene acquisition by transduction the DNA is incorporated into the recipient chromosome by the phage enzymes (Ochman et al. 2000); hence, the donor-recipient genome similarity barrier is less apparent. The reconstructed gene transfers of integrons and phage parts in the dLGT network are evidence that some of the reconstructed LGTs in the network were mediated by transduction. Consequently, our results suggest that the genome similarity barrier applies also to phage-mediated gene transfer. This implies that most of the phages are transferring DNA between similar species. Indeed, a similar scenario is described for bacteriophages of the oceanic cyanobacterium Prochlorococcus (Sullivan et al. 2003).
Examples of gene acquisition from distantly related donors are documented in the literature (Nelson et al. 1999; Mongodin et al. 2005) and are also apparent in our dLGT network. It follows that donor–recipient genome similarity is not always a barrier to LGT. We demonstrated that genomes encoding the nonhomologous end-joining (NHEJ) proteins Ku and LigD are significantly more likely to acquire DNA from a distantly related donor genome than genomes lacking NHEJ. While we cannot exclude the possibility that our result is biased by a hidden genomic variable related to LGT and covariates with NHEJ presence/absence, in the lack of evidence to that effect we conclude that NHEJ has a role in LGT within prokaryotes. NHEJ is not the only mechanism to bypass the genome similarity barrier to LGT. For example, transformation frequencies at different genomic loci of Acinetobacter baylyi, which lacks the NHEJ proteins, were shown to vary up to 10,000-fold (Ray et al. 2009). Moreover, Chayot et al. (2010) recently showed that DNA acquisition in E. coli can be mediated in vitro by a mechanism that is independent of homologous recombination. E. coli, which lacks the NHEJ pathway, possesses an alternative end-joining mechanism (A-EJ) for DNA double-strand break repair (Chayot et al. 2010). The A-EJ mechanism recruits the RecBCD complex for end-restriction and Ligase A for DNA ligation. Chayot et al. (2010) showed that an acquisition of antibiotic resistance gene in E. coli can be mediated by the A-EJ proteins, demonstrating the possible role of DSBR end-joining mechanisms in LGT. This suggests the existence of yet unexplored roles of DNA repair mechanisms for integrating acquired DNA into prokaryotic genomes.
Our results show that the functional distribution of transferred genes is not random, as suggested earlier (Choi and Kim 2007). The abundance of metabolic genes and scarceness of informational genes within the dLGT network are in agreement with the complexity hypothesis (Jain et al. 1999), according to which informational genes are transferred less frequently than those in the operational class. The overall similarity of donor–recipient genomes is lesser for transferred genes in the information storage and processing category in comparison to the other functional categories. This finding seems at first counterintuitive with regard to the complexity hypothesis. However, the low similarity between the donor and recipient might actually explain how these genes are still transferred. Sorek et al. (2007) showed that information genes can be readily acquired as long as they are not expressed. Hence, it is possible, if not likely, that many of the informational genes identified here are not expressed in the recipient genomes.
For recent LGT, it appears that the lateral component of prokaryotic genome evolution can be accurately modeled with directed networks and that the accuracy should increase with increasing sample density. For more ancient acquisitions it should, in principle, be possible to approximate donors using gene phylogeny-dependent methods, and thereby further expand the application spectrum of directed networks in the study of microbial genome evolution.
Methods
Data
Fully sequenced genomes of 657 prokaryotes were downloaded from the NCBI website (www.ncbi.nlm.nih.gov April 2008 version). Our recent LGT inference operates within the framework of orthologous protein families and is assisted by a reference species tree as described in Dagan and Martin (2007). First, we classified all 2,129,548 proteins encoded within chromosomes in our genome sample into orthologous protein families. The common protein families reconstruction methods COGs (Tatusov et al. 2003) and MCL (Enright et al. 2002) are inappropriate for our purpose since they sometimes yield protein families that include paralogs in addition to orthologs, and a reciprocal best BLAST hit (rBBH) procedure outperforms many more complicated clustering algorithms (Altenhoff and Dessimoz 2009). We therefore used a greedy algorithm similar to the bits-score algorithm used in COG database (Tatusov et al. 2003), which groups all rBBHs into one orthogroup. Only BLAST hits having an E-value ≤1 × 10⁻¹⁰, amino acid identity ≥25%, and query/hit length ratio ≥80% were considered in the rBBH procedure. A new orthogroup begins with a previously unclustered seed gene and all of its rBBHs. Next, all genes included in the orthogroup are used to iteratively search for rBBHs within the genomes not yet represented in the orthogroup. Only genes identified as recently acquired by LGT (see below) were used as seeds. A comparison of the orthogroups to MCL protein families (Enright et al. 2002) shows that the orthogroups are much more exclusive, yet in the genus scale they overlap completely in 92% of the cases (Supplemental Fig. S8).
Identification of recently acquired genes
Recently acquired genes are expected to have unusual codon usage and GC content when compared with the whole proteome. Therefore, GC content may be used to detect the foreign origin of a gene (Garcia-Vallve et al. 2000; Nakamura et al. 2004). The statistical analysis of GC content is favored over codon usage because it is more statistically robust due to the smaller relative standard errors of the estimates resulting from a larger sample size (nucleotides vs. codons) and smaller number of states (two vs. 61). Genes with atypical GC content are detected by comparing their GC content with the genomic GC using the χ2 test with a false discovery rate (FDR) of 5% (Benjamini and Hochberg 1995).
Gene acquisitions within each orthogroup are superimposed upon the reference tree. If a certain group of recipients is monophyletic, then the acquisition event is reconstructed to their common ancestor (an internal node in the reference species tree). Otherwise, the acquisition event is reconstructed to the species in which it was detected. These are designated as putative recipients.
Identification of gene donor
The candidate gene-donor of each acquired gene is the genome bearing an ortholog with the highest sequence similarity to the acquired gene, excluding all orthologs that share a common acquisition event with the acquired gene. In case of equally similar candidates, all orthologs are stored as candidate donors.
In the next stage, we filtered out candidate donors whose GC content does not fit the expected content by the sequence divergence of the donor and recipient genes. For this purpose we developed an empirical model that describes the difference in GC content between donor and recipient sequences as a function of the evolutionary distance between them. The underlying data for the model are 68,923 pairwise alignments of non-LGT orthologs (genes that are not identified as recent acquisition in the previous stage) from our data set for 74 pairs of sibling species having significantly different genomic GC content (P < 0.05 using the χ2 test). From each pairwise alignment (280,836 alignments in total) we extracted the frequency and type of nucleotide substitutions (A↔T, C↔G, and A/T↔C/G). The data was binned by the frequency of nucleotide substitutions (sequence divergence) per alignment (Supplemental Fig. 9A). The 95% percentile within each bin signifies the confidence interval for the expected difference in G and C nucleotides in that sequence divergence range in α = 0.05 significance level. Because sequence divergence and the 95% percentile of A/T↔C/G substitutions frequency are linearly correlates in log–log scale, we could fit a logarithmic equation for the relation between the two variables. The result model is 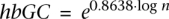 , where hbGC is the higher bound for the difference in G and C nucleotides between donor and recipient genes, and n is the total number of different nucleotides between the two sequences (Supplemental Fig. S9B). Candidate donor sequences that differ from the recipient in more G and C nucleotides than expected under the model are excluded, those that remain are called putative donors.
At this stage, we filtered for nonfunctional genes by testing for relaxation of purifying selection on the recipient gene. The recipient and donor proteins were aligned using ClustalW (Thompson et al. 1994), and were converted to codons alignment using PAL2NAL (Suyama et al. 2006). The ratio of  (Nei and Gojobori 1986) was calculated by PAML (Yang 2007). A total of 140 genes having
  were considered as pseudogenes and were excluded from the analysis.
Aberrant nucleotide pattern (or codon usage) alone is not sufficiently reliable to predict a gene as laterally transferred (Medrano-Soto et al. 2004). In the next stage of the analysis we reconstructed a phylogenetic tree for each of the putative laterally transferred genes. For each gene acquisition event, all of the putative recipients and putative donors are aligned together with two outgroup sequences. One outgroup is an ortholog from a species that branches between the putative recipients and putative donors in the reference tree. That is, assuming vertical inheritance only, this outgroup is more closely related to the putative recipients than the putative donors. The second outgroup (root outgroup) is an ortholog from a species that branches outside of the clade, including the putative recipients and donors in the reference tree (Supplemental Fig. S10). DNA sequences of the putative recipients, putative donors, and both outgroup sequences are aligned using ClustalW (Thompson et al. 1994). A phylogenetic tree is reconstructed employing the neighbor joining (Saitou and Nei 1987) approach using NEIGHBOR (Felsenstein 2005) with F84 substitution matrix. The phylogenetic trees were rooted with the root outgroup and scanned for sister clades containing only donors in one clade and only recipients in the other. Such sister clades define the source and target of the gene transfer event, and when mapped upon the reference tree, define a directed edge in the dLGT network. We repeated the analysis with phylogenetic trees reconstructed by the maximum likelihood (ML) approach using PhyML (Guindon and Gascuel 2003) with HKY substitution model and empirical base frequency estimates. The ML-dLGT network includes an additional 407 transferred genes and overlaps with the dLGT in 2886 (96%) of the edges. Trends of genome similarity measures in the comparison of NHEJ-positive and NHEJ-negative genomes (see below) are identical to those that resulted from the dLGT network.
dLGT network analysis
Community structure and modules within the dLGT network were inferred by an application of the modularity function to directed networks (Leicht and Newman 2008) using MatLab. The input for the inference script is a binary form of the dLGT network where all edges weights are set to one.
Network views were produces by Cytoscape freeware (Cline et al. 2007) using the force-directed layout (unweighted) option with default parameters. The force-directed layout is a new layout based on the “force-directed” paradigm and implemented by J. Heer as part of the prefuse toolkit (http://prefuse.org/). Input files for Cytoscape including the customized vertices and edge coloring were produced using an in-house Perl script.
Genome similarity measures
Genome sequence similarity (Sgs) between a recipient and a donor was calculated as the number of identical 20-bp segments between the two genomes, divided by the genome size (total chromosomes length) of the recipient. Identical segments 20-bp long were located using Mummer (Kurtz et al. 2004) and their total length was calculated taking into account possible overlaps, using an in-house Perl script. Proteome similarity (Spr) between a recipient and a donor was calculated as the number of orthogroups that are common to both genomes, divided by the number of orthogroups in which the recipient is represented. GC content similarity (Sgc) was calculated by:  . Statistical analysis was performed using MatLab. For the multiple correlation analysis, the log value of the predictors and variable was used. The correlation coefficient of Sgs with the ANI measure (Richter and Rosselló-Móra 2009) was calculated from ANIm estimates of 54 species included in the dLGT network using Spearman correlation.
NHEJ-positive genomes
Homologs to YkoU and YkoV proteins were identified by a reciprocal best BLAST hit procedure using the YkoU (gi:16078405) and YkoV (gi:16078406) proteins from Bacillus subtilis as the query. Only BLAST hits having an E-value ≤1 × 1−10 and ≥25% amino acids identity were considered. Genomes bearing both NHEJ proteins are designated as NHEJ positive.
Functional classification
Functional classification of recipient genes was extracted from the COG database (Tatusov et al. 2003); http://www.ncbi.nlm.nih.gov/COG/). When the COG annotation of a recipient gene was missing, the donor COG annotation was used instead.
Acknowledgments
This study was supported by the National Evolutionary Synthesis Center (NESCent) grant NSF #EF-0423641 (E.H.-C.), NESCent short-term Sabbatical (T.D.), German Federal Ministry of Education and Research (O.P., T.D., W.M.), European Research Council grant NETWORKORIGINS (W.M.), and the US National Library of Medicine grant LM010009-01 (G.L.).
Footnotes
[Supplemental material is available for this article.]
Article published online before print. Article, supplemental material, and publication date are at http://www.genome.org/cgi/doi/10.1101/gr.115592.110.
References
- Altenhoff AM, Dessimoz C 2009. Phylogenetic and functional assessment of orthologs inference projects and methods. PLoS Comput Biol 5: e1000262 doi: 10.1371/journal.pcbi.1000262 [DOI] [PMC free article] [PubMed] [Google Scholar]
- Aravind L, Koonin EV 2001. Prokaryotic homologs of the eukaryotic DNA-end-binding protein Ku, novel domains in the Ku protein and prediction of a prokaryotic double-strand break repair system. Genome Res 11: 1365–1374 [DOI] [PMC free article] [PubMed] [Google Scholar]
- Barabási AL, Albert R, Jeong H 2000. Scale-free characteristics of random networks: the topology of the World-Wide Web. Physica A 281: 69–77 [Google Scholar]
- Bassing CH, Alt FW 2004. The cellular response to general and programmed DNA double strand breaks. DNA Repair 3: 781–796 [DOI] [PubMed] [Google Scholar]
- Benjamini Y, Hochberg Y 1995. Controlling the false discovery rate—a practical and powerful approach to multiple testing. J Roy Stat Soc B Met 57: 289–300 [Google Scholar]
- Chaffron S, Rehrauer H, Pernthaler J, von Mering C 2010. A global network of coexisting microbes from environmental and whole-genome sequence data. Genome Res 20: 947–959 [DOI] [PMC free article] [PubMed] [Google Scholar]
- Chayot R, Montagne B, Mazel D, Ricchetti M 2010. An end-joining repair mechanism in Escherichia coli. Proc Natl Acad Sci 107: 2141–2146 [DOI] [PMC free article] [PubMed] [Google Scholar]
- Chen I, Dubnau D 2004. DNA uptake during bacterial transformation. Nat Rev Microbiol 2: 241–249 [DOI] [PubMed] [Google Scholar]
- Chen I, Christie PJ, Dubnau D 2005. The ins and outs of DNA transfer in bacteria. Science 310: 1456–1460 [DOI] [PMC free article] [PubMed] [Google Scholar]
- Choi IG, Kim SH 2007. Global extent of horizontal gene transfer. Proc Natl Acad Sci 104: 4489–4494 [DOI] [PMC free article] [PubMed] [Google Scholar]
- Cline MS, Smoot M, Cerami E, Kuchinsky A, Landys N, Workman C, Christmas R, Avila-Campilo I, Creech M, Gross B, et al. 2007. Integration of biological networks and gene expression data using Cytoscape. Nat Protoc 2: 2366–2382 [DOI] [PMC free article] [PubMed] [Google Scholar]
- Dagan T, Martin W 2007. Ancestral genome sizes specify the minimum rate of lateral gene transfer during prokaryote evolution. Proc Natl Acad Sci 104: 870–875 [DOI] [PMC free article] [PubMed] [Google Scholar]
- Davids W, Zhang Z 2008. The impact of horizontal gene transfer in shaping operons and protein interaction networks—direct evidence of preferential attachment. BMC Evol Biol 8: 23 doi: 10.1186/1471-2148-8-23 [DOI] [PMC free article] [PubMed] [Google Scholar]
- Deppenmeier U, Johann A, Hartsch T, Merkl R, Schmitz RA, Martinez-Arias R, Henne A, Wiezer A, Baumer S, Jacobi C, et al. 2002. The genome of Methanosarcina mazei: evidence for lateral gene transfer between bacteria and archaea. J Mol Microbiol Biotechnol 4: 453–461 [PubMed] [Google Scholar]
- Doolittle WF 1999. Phylogenetic classification and the universal tree. Science 284: 2124–2129 [DOI] [PubMed] [Google Scholar]
- Enright AJ, Van Dongen S, Ouzounis CA 2002. An efficient algorithm for large-scale detection of protein families. Nucleic Acids Res 30: 1575–1584 [DOI] [PMC free article] [PubMed] [Google Scholar]
- Erkel C, Kube M, Reinhardt R, Liesack W 2006. Genome of Rice Cluster I archaea–the key methane producers in the rice rhizosphere. Science 313: 370–372 [DOI] [PubMed] [Google Scholar]
- Felsenstein J 2005. PHYLIP (Phylogeny Inference Package). Department of Genome Sciences, University of Washington, Seattle, WA [Google Scholar]
- Foster JG, Foster DV, Grassberger P, Paczuski M 2010. Edge direction and the structure of networks. Proc Natl Acad Sci 107: 10815–10820 [DOI] [PMC free article] [PubMed] [Google Scholar]
- Garcia-Vallve S, Romeu A, Palau J 2000. Horizontal gene transfer in bacterial and archaeal complete genomes. Genome Res 10: 1719–1725 [DOI] [PMC free article] [PubMed] [Google Scholar]
- Gevers D, Cohan FM, Lawrence JG, Spratt BG, Coenye T, Feil EJ, Stackebrandt E, Van de Peer Y, Vandamme P, Thompson FL, et al. 2005. Opinion: Re-evaluating prokaryotic species. Nat Rev Microbiol 3: 733–739 [DOI] [PubMed] [Google Scholar]
- Gogarten JP, Doolittle WF, Lawrence JG 2002. Prokaryotic evolution in light of gene transfer. Mol Biol Evol 19: 2226–2238 [DOI] [PubMed] [Google Scholar]
- Groisman EA, Ochman H 1996. Pathogenicity islands: Bacterial evolution in quantum leaps. Cell 87: 791–794 [DOI] [PubMed] [Google Scholar]
- Guindon S, Gascuel O 2003. A simple, fast, and accurate algorithm to estimate large phylogenies by maximum likelihood. Syst Biol 52: 696–704 [DOI] [PubMed] [Google Scholar]
- Hazkani-Covo E, Covo S 2008. Numt-mediated double-strand break repair mitigates deletions during primate genome evolution. PLoS Genet 4: e1000237 doi: 10.1371/journal.pgen.1000237 [DOI] [PMC free article] [PubMed] [Google Scholar]
- Holmes DE, Nevin KP, Lovley DR 2004. Comparison of 16S rRNA, nifD, recA, gyrB, rpoB and fusA genes within the family Geobacteraceae fam. nov. Int J Syst Evol Microbiol 54: 1591–1599 [DOI] [PubMed] [Google Scholar]
- Jain R, Rivera MC, Lake JA 1999. Horizontal gene transfer among genomes: The complexity hypothesis. Proc Natl Acad Sci 96: 3801–3806 [DOI] [PMC free article] [PubMed] [Google Scholar]
- Jeong H, Tombor B, Albert R, Oltvai ZN, Barabási AL 2000. The large-scale organization of metabolic networks. Nature 407: 651–654 [DOI] [PubMed] [Google Scholar]
- Kurtz S, Phillippy A, Delcher AL, Smoot M, Shumway M, Antonescu C, Salzberg SL 2004. Versatile and open software for comparing large genomes. Genome Biol 5: R12 doi: 10.1186/gb-2004-5-2-r12 [DOI] [PMC free article] [PubMed] [Google Scholar]
- Lang AS, Beatty JT 2007. Importance of widespread gene transfer agent genes in alpha-proteobacteria. Trends Microbiol 15: 54–62 [DOI] [PubMed] [Google Scholar]
- Leicht EA, Newman ME 2008. Community structure in directed networks. Phys Rev Lett 100: 118703 doi: 10.1103/PhysRevLett.100.118703 [DOI] [PubMed] [Google Scholar]
- Lieber MR, Ma Y, Pannicke U, Schwarz K 2004. The mechanism of vertebrate nonhomologous DNA end joining and its role in V(D)J recombination. DNA Repair 3: 817–826 [DOI] [PubMed] [Google Scholar]
- Lin Y, Waldman AS 2001a. Capture of DNA sequences at double-strand breaks in mammalian chromosomes. Genetics 158: 1665–1674 [DOI] [PMC free article] [PubMed] [Google Scholar]
- Lin Y, Waldman AS 2001b. Promiscuous patching of broken chromosomes in mammalian cells with extrachromosomal DNA. Nucleic Acids Res 29: 3975–3981 [DOI] [PMC free article] [PubMed] [Google Scholar]
- Lovett ST, Hurley RL, Sutera VA Jr, Aubuchon RH, Lebedeva MA 2002. Crossing over between regions of limited homology in Escherichia coli. RecA-dependent and RecA-independent pathways. Genetics 160: 851–859 [DOI] [PMC free article] [PubMed] [Google Scholar]
- Majewski J, Cohan FM 1998. The effect of mismatch repair and heteroduplex formation on sexual isolation in Bacillus. Genetics 148: 13–18 [DOI] [PMC free article] [PubMed] [Google Scholar]
- Majewski J, Cohan FM 1999. DNA sequence similarity requirements for interspecific recombination in Bacillus. Genetics 153: 1525–1533 [DOI] [PMC free article] [PubMed] [Google Scholar]
- Mau B, Glasner JD, Darling AE, Perna NT 2006. Genome-wide detection and analysis of homologous recombination among sequenced strains of Escherichia coli. Genome Biol 7: R44 doi: 10.1186/fb-2006-7-5-r44 [DOI] [PMC free article] [PubMed] [Google Scholar]
- Medrano-Soto A, Moreno-Hagelsieb G, Vinuesa P, Christen JA, Collado-Vides J 2004. Successful lateral transfer requires codon usage compatibility between foreign genes and recipient genomes. Mol Biol Evol 21: 1884–1894 [DOI] [PubMed] [Google Scholar]
- Milkman R, Bridges MM 1990. Molecular evolution of the Escherichia Coli Chromosome. 3. Clonal frames. Genetics 126: 505–517 [DOI] [PMC free article] [PubMed] [Google Scholar]
- Mongodin EF, Nelson KE, Daugherty S, DeBoy RT, Wister J, Khouri H, Weidman J, Walsh DA, Papke RT, Perez GS, et al. 2005. The genome of Salinibacter ruber: Convergence and gene exchange among hyperhalophilic bacteria and archaea. Proc Natl Acad Sci 102: 18147–18152 [DOI] [PMC free article] [PubMed] [Google Scholar]
- Moore JK, Haber JE 1996. Capture of retrotransposon DNA at the sites of chromosomal double-strand breaks. Nature 383: 644–646 [DOI] [PubMed] [Google Scholar]
- Moran NA 2002. Microbial minimalism: Genome reduction in bacterial pathogens. Cell 108: 583–586 [DOI] [PubMed] [Google Scholar]
- Muller D, Simeonova DD, Riegel P, Mangenot S, Koechler S, Lievremont D, Bertin PN, Lett MC 2006. Herminiimonas arsenicoxydans sp. nov., a metalloresistant bacterium. Int J Syst Evol Microbiol 56: 1765–1769 [DOI] [PubMed] [Google Scholar]
- Muller D, Medigue C, Koechler S, Barbe V, Barakat M, Talla E, Bonnefoy V, Krin E, Arsene-Ploetze F, Carapito C, et al. 2007. A tale of two oxidation states: Bacterial colonization of arsenic-rich environments. PLoS Genet 3: e53 doi: 10.1371/journal.pgen.0030053 [DOI] [PMC free article] [PubMed] [Google Scholar]
- Nakai H, Montini E, Fuess S, Storm TA, Grompe M, Kay MA 2003. AAV serotype 2 vectors preferentially integrate into active genes in mice. Nat Genet 34: 297–302 [DOI] [PubMed] [Google Scholar]
- Nakamura Y, Itoh T, Matsuda H, Gojobori T 2004. Biased biological functions of horizontally transferred genes in prokaryotic genomes. Nat Genet 36: 760–766 [DOI] [PubMed] [Google Scholar]
- Nei M, Gojobori T 1986. Simple methods for estimating the numbers of synonymous and nonsynonymous nucleotide substitutions. Mol Biol Evol 3: 418–426 [DOI] [PubMed] [Google Scholar]
- Nelson KE, Clayton RA, Gill SR, Gwinn ML, Dodson RJ, Haft DH, Hickey EK, Peterson LD, Nelson WC, Ketchum KA, et al. 1999. Evidence for lateral gene transfer between Archaea and Bacteria from genome sequence of Thermotoga maritima. Nature 399: 323–329 [DOI] [PubMed] [Google Scholar]
- Ochman H, Lawrence JG, Groisman EA 2000. Lateral gene transfer and the nature of bacterial innovation. Nature 405: 299–304 [DOI] [PubMed] [Google Scholar]
- Palla G, Derenyi I, Farkas I, Vicsek T 2005. Uncovering the overlapping community structure of complex networks in nature and society. Nature 435: 814–818 [DOI] [PubMed] [Google Scholar]
- Palla G, Barabási AL, Vicsek T 2007. Quantifying social group evolution. Nature 446: 664–667 [DOI] [PubMed] [Google Scholar]
- Perez JC, Groisman EA 2009. Evolution of transcriptional regulatory circuits in bacteria. Cell 138: 233–244 [DOI] [PMC free article] [PubMed] [Google Scholar]
- Puigbò P, Wolf YI, Koonin EV 2010. The tree and net components of prokaryote evolution. Genome Biol Evol 2: 745–756 [DOI] [PMC free article] [PubMed] [Google Scholar]
- Ragan MA, Harlow TJ, Beiko RG 2006. Do different surrogate methods detect lateral genetic transfer events of different relative ages? Trends Microbiol 14: 4–8 [DOI] [PubMed] [Google Scholar]
- Ray JL, Harms K, Wikmark OG, Starikova I, Johnsen PJ, Nielsen KM 2009. Sexual isolation in Acinetobacter baylyi is locus-specific and varies 10,000-fold over the genome. Genetics 182: 1165–1181 [DOI] [PMC free article] [PubMed] [Google Scholar]
- Ricchetti M, Fairhead C, Dujon B 1999. Mitochondrial DNA repairs double-strand breaks in yeast chromosomes. Nature 402: 96–100 [DOI] [PubMed] [Google Scholar]
- Richter M, Rosselló-Móra R 2009. Shifting the genomic gold standard for the prokaryotic species definition. Proc Natl Acad Sci 106: 19126–19131 [DOI] [PMC free article] [PubMed] [Google Scholar]
- Rocap G, Larimer FW, Lamerdin J, Malfatti S, Chain P, Ahlgren NA, Arellano A, Coleman M, Hauser L, Hess WR, et al. 2003. Genome divergence in two Prochlorococcus ecotypes reflects oceanic niche differentiation. Nature 424: 1042–1047 [DOI] [PubMed] [Google Scholar]
- Russell JA, Moran NA 2005. Horizontal transfer of bacterial symbionts: Heritability and fitness effects in a novel aphid host. Appl Environ Microbiol 71: 7987–7994 [DOI] [PMC free article] [PubMed] [Google Scholar]
- Saitou N, Nei M 1987. The neighbor-joining method: A new method for reconstructing phylogenetic trees. Mol Biol Evol 4: 406–425 [DOI] [PubMed] [Google Scholar]
- Saltikov CW, Cifuentes A, Venkateswaran K, Newman DK 2003. The ars detoxification system is advantageous but not required for As(V) respiration by the genetically tractable Shewanella species strain ANA-3. Appl Environ Microbiol 69: 2800–2809 [DOI] [PMC free article] [PubMed] [Google Scholar]
- Schleheck D, Dong WB, Denger K, Heinzle E, Cook AM 2000. An alpha-proteobacterium converts linear alkylbenzenesulfonate surfactants into sulfophenylcarboxylates and linear alkyldiphenyletherdisulfonate surfactants into sulfodiphenylethercarboxylates. Appl Environ Microbiol 66: 1911–1916 [DOI] [PMC free article] [PubMed] [Google Scholar]
- Shuman S, Glickman MS 2007. Bacterial DNA repair by non-homologous end joining. Nat Rev Microbiol 5: 852–861 [DOI] [PubMed] [Google Scholar]
- Sorek R, Zhu Y, Creevey CJ, Francino MP, Bork P, Rubin EM 2007. Genome-wide experimental determination of barriers to horizontal gene transfer. Science 318: 1449–1452 [DOI] [PubMed] [Google Scholar]
- Sullivan MB, Waterbury JB, Chisholm SW 2003. Cyanophages infecting the oceanic cyanobacterium Prochlorococcus. Nature 424: 1047–1051 [DOI] [PubMed] [Google Scholar]
- Summer EJ, Gill JJ, Upton C, Gonzalez CF, Young R 2007. Role of phages in the pathogenesis of Burkholderia, or ‘Where are the toxin genes in Burkholderia phages?’ Curr Opin Microbiol 10: 410–417 [DOI] [PMC free article] [PubMed] [Google Scholar]
- Suyama M, Torrents D, Bork P 2006. PAL2NAL: Robust conversion of protein sequence alignments into the corresponding codon alignments. Nucleic Acids Res 34: W609–W612 [DOI] [PMC free article] [PubMed] [Google Scholar]
- Tatusov RL, Fedorova ND, Jackson JD, Jacobs AR, Kiryutin B, Koonin EV, Krylov DM, Mazumder R, Mekhedov SL, Nikolskaya AN, et al. 2003. The COG database: An updated version includes eukaryotes. BMC Bioinformatics 4: 41 doi: 10.1186/1471-2105-4-41 [DOI] [PMC free article] [PubMed] [Google Scholar]
- Thomas CM, Nielsen KM 2005. Mechanisms of, and barriers to, horizontal gene transfer between bacteria. Nat Rev Microbiol 3: 711–721 [DOI] [PubMed] [Google Scholar]
- Thompson JD, Higgins DG, Gibson TJ 1994. Clustal-W—Improving the sensitivity of progressive multiple sequence alignment through sequence weighting, position-specific gap penalties and weight matrix choice. Nucleic Acids Res 22: 4673–4680 [DOI] [PMC free article] [PubMed] [Google Scholar]
- Tsang JS, Ebert MS, van Oudenaarden A 2010. Genome-wide dissection of microRNA functions and cotargeting networks using gene set signatures. Mol Cell 38: 140–153 [DOI] [PMC free article] [PubMed] [Google Scholar]
- Warnecke F, Luginbuhl P, Ivanova N, Ghassemian M, Richardson TH, Stege JT, Cayouette M, McHardy AC, Djordjevic G, Aboushadi N, et al. 2007. Metagenomic and functional analysis of hindgut microbiota of a wood-feeding higher termite. Nature 450: 560–565 [DOI] [PubMed] [Google Scholar]
- Weller GR, Kysela B, Roy R, Tonkin LM, Scanlan E, Della M, Devine SK, Day JP, Wilkinson A, d'Adda di Fagagna F, et al. 2002. Identification of a DNA nonhomologous end-joining complex in bacteria. Science 297: 1686–1689 [DOI] [PubMed] [Google Scholar]
- Yang Z 2007. PAML 4: Phylogenetic analysis by maximum likelihood. Mol Biol Evol 24: 1586–1591 [DOI] [PubMed] [Google Scholar]
- Yu Y, Kim HS, Chua HH, Lin CH, Sim SH, Lin D, Derr A, Engels R, DeShazer D, Birren B, et al. 2006. Genomic patterns of pathogen evolution revealed by comparison of Burkholderia pseudomallei, the causative agent of melioidosis, to avirulent Burkholderia thailandensis. BMC Microbiol 6: 46 doi: 10.1186/1471-2180-6-46 [DOI] [PMC free article] [PubMed] [Google Scholar]