Abstract
Metagenomic characterization of complex biomes remains challenging. Here we describe a modification of digital karyotyping—biome representational in silico karyotyping (BRISK)—as a general technique for analyzing a defined representation of all DNA present in a sample. BRISK utilizes a Type IIB DNA restriction enzyme to create a defined representation of 27-mer DNAs in a sample. Massively parallel sequencing of this representation allows for construction of high-resolution karyotypes and identification of multiple species within a biome. Application to normal human tissue demonstrated linear recovery of tags by chromosome. We apply this technique to the biome of the oral mucosa and find that greater than 25% of recovered DNA is nonhuman. DNA from 41 microbial species could be identified from oral mucosa of two subjects. Of recovered nonhuman sequences, fewer than 30% are currently annotated. We characterized seven prevalent unknown sequences by chromosome walking and find these represent novel microbial sequences including two likely derived from novel phage genomes. Application of BRISK to archival tissue from a nasopharyngeal carcinoma resulted in identification of Epstein-Barr virus infection. These results suggest that BRISK is a powerful technique for the analysis of complex microbiomes and potentially for pathogen discovery.
The human body is a complex biome which includes trillions of individual genomes of thousands of microbial species (Kurokawa et al. 2007; Turnbaugh et al. 2007; Lampe 2008; Turnbaugh et al. 2009). Within the body are several characterized microbiomes, including that of the distal gut (Eckburg et al. 2005; Qin et al. 2010), vaginal mucosa (Oakley et al. 2008; Fredricks et al. 2009), oral mucosa (Aas et al. 2005; Keijser et al. 2008; Nasidze et al. 2009a; Nasidze et al. 2009b; Zaura et al. 2009), skin (Costello et al. 2009; Grice et al. 2009), and conjunctiva (Graham et al. 2007). While saturation deep sequencing of a complex biome is the theoretical gold standard for its characterization (Venter et al. 2004; Williamson et al. 2008), such an approach is not yet economical or practical for clinical samples and is very computationally intensive. Human microbiomes have been primarily characterized by 16S ribosomal sequencing for bacterial DNA, and to a lesser extent, by 18S and internal transcribed spacer (ITS) ribosomal sequencing for fungal DNA, but these techniques are not readily adaptable to viruses, phage, or parasites.
Several digital karyotyping methods have been used to characterize defined genomic representations (Wang et al. 2002b; Tengs et al. 2004; Leary et al. 2007). These are capable of generating high resolution karyotypes of human DNA in analyzed samples, as well as identifying foreign DNA within the sample. However, their use to date has largely been restricted to human tissue, with only a single report of digital karyotyping to characterize nonhuman DNA within cancer specimens (Duncan et al. 2009).
Here we describe biome representational in silico karyotyping (BRISK), which subjects a biome's genomic representation generated by a Type IIB restriction endonuclease (Tengs et al. 2004) to massively parallel deep sequencing. We demonstrate that many known and novel microbial sequences may be readily identified in the resulting metagenomic karyotype.
Results
Overview of the BRISK technique
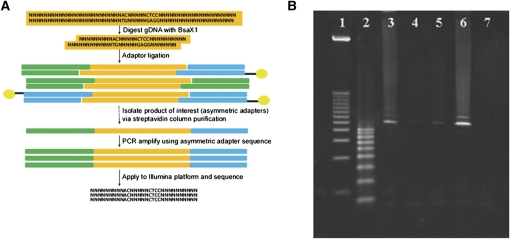
A schematic of the BRISK technique is shown in Figure 1. A Type IIB restriction endonuclease (BsaXI) with a 6-bp recognition sequencing yielding a 33-bp restriction fragment (27 bp double-stranded with two 3-bp single-stranded overhangs) is used to generate the representation. Asymmetric adaptor sequences designed to interface directly with the Illumina high-throughput sequencing method (Bentley et al. 2008) are ligated to the digested DNA; one adaptor is additionally biotinylated on the 5′ end. The ligation products are bound to a streptavidin column, gaps are repaired with a nick-translating DNA polymerase, and the desired products (those having different adaptors on each end) are melted off the column and captured. Following polymerase chain reaction-mediated amplification, the representation is directly applied to the Illumina sequencing platform.
Figure 1.
(A) Schematic of BRISK technique. (B) Representative ethidium bromide-stained agarose gel of BRISK products. (Lane 1) 1 kb DNA ladder; (lane 2) 100 bp DNA ladder; (lane 3) PCR amplification of BRISK fragments following ligation of asymmetric adaptors; (lane 4) amplification of unbound material from biotin column; (lane 5) amplification of beads following melt and elution of single-stranded DNA; (lane 6) ampification of material eluted from beads (desired product containing one long and one short adaptor); (lane 7) negative PCR control.
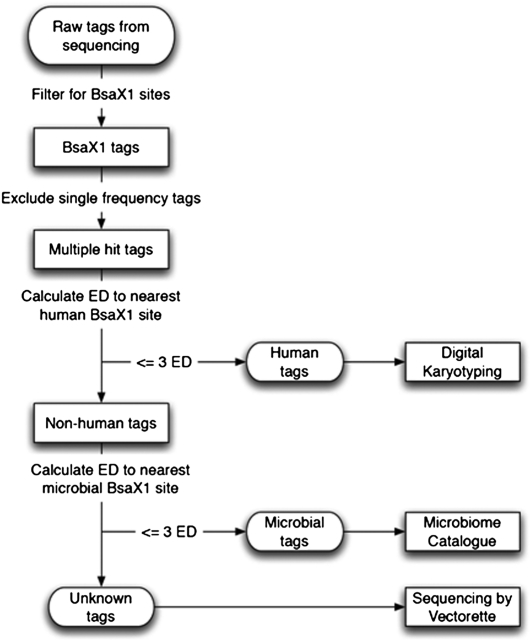
The bioinformatic analysis of sequence data is summarized in Figure 2. After sequencing, 27 bp of sequence (the double-stranded portion of the representation) is parsed and matched against an SQL database containing all tags resulting from a virtual BsaXI digest of all sequences from GeneBank divisions of primates, bacteria, invertebrates, fungi, plants, phages, and viruses (GenBank Release 178.0). In silico digestion of the reference human genome with BsaXI yields 1.3 million fragments of which 1.1 million are unique sequences. Tags matching human DNA are mapped to position, forming a karyotype with ∼4-kb resolution. Virtual digestion of bacterial, fungal, plant, and viral sequences yields 2.4 million sequence tags. Of these, only 418 tags (0.02%) are found in both human and microbial/fungal/viral databases. These tags were not used for assignment.
Figure 2.
Schematic of bioinformatic analysis applied to BRISK sequencing results. (ED) Levenstein edit distance.
Matches to microbial and viral sequences are then tallied. Microbial and viral tags are assorted in the database to two categories: unique, and ambiguous. A unique tag is found only in a single species. Ambiguous tags are found in more than one organism (for instance, between two or more species of one genus). Of the 1.7 million tags in the bacterial and viral data set, 1.2 million are unique (68.6%). A “unique” score for each microbial or viral species is calculated based on the number of sequenced tags that are unique matches for that organism. A global score is calculated for each species as well, which is a sum of the unique score and a fractional score for each ambiguous tag (for instance, a tag appearing once matching five species would weight 0.2 for any specific species). Scores are generated for each microbe or virus. To be assigned as “present”, an empirical criterion of recovery of at least two, independent, unique tags for that organism is applied.
To analyze the remaining (unmatched) tags, a Levenshtein edit distance model is employed (Yujian and Bo 2007). Empirical analysis of human and microbial tags within the database reveals that fewer than 0.086% of human tags are within 3 Levenshtein edit distances (e.g., single base changes, additions, or deletions) of the nearest microbial 27-mer tag. The average human sequence is 6.5 edit distances from the closest microbial tag. Tags greater than 3 edit distances from the nearest human match, but not matching any tags in the microbial or viral databases, are taken to represent potentially novel sequences and are subjected to further analysis.
Application to digital karyotyping
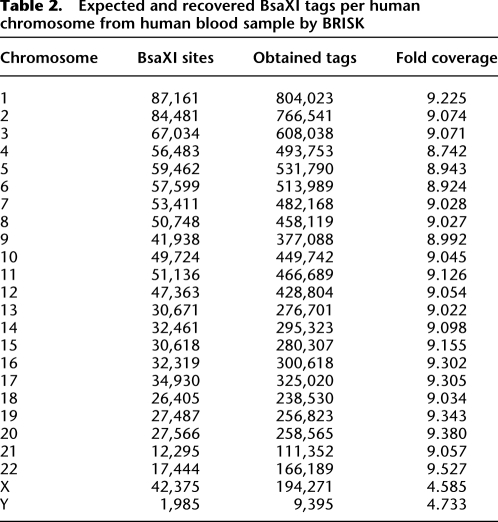
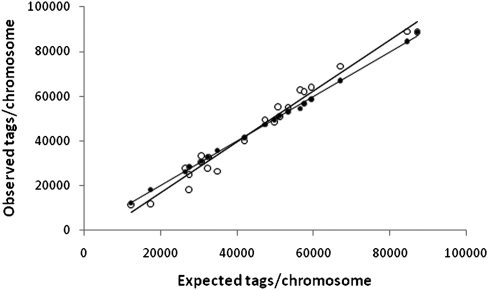
We initially characterized the digital karyotyping capabilities of BRISK by analyzing the digital karyotype of an aseptically acquired human blood sample. Starting from 3 μg of genomic DNA, a total of 12,529,752 tags were identified from the human blood sample (Table 1). Of these, 11,844,721 (95%) were perfect matches to tags in the human database. Of the 324,592 nonmatching distinct tags, 44,785 were found in other aseptically obtained human blood or human cell line samples, suggesting that these are polymorphic or undocumented human sequences. An additional 199,016 tags were within 3 Levenstein edit distances of nearest human match, again suggesting either polymorphic human sequence or amplification or sequencing error. We were thus able to assign 99.36% of tags from the human blood sample to human origin. The origin of the remaining tags is not known but may represent additional, individual polymorphism as has recently been described for human Alu sequences (Hormozdiari et al. 2011). Estimation of sequencing error was accomplished by analyzing known, single-frequency human BsaX1 sites and comparing recovered tags from an aseptically obtained human blood sample to reference human sequences. Levenshtein edit distance for each recovered tag from the reference tag was calculated, and the mode frequency for each known single-frequency site was considered as sample normative to account for polymorphisms. Deviations from normative frequency were then calculated and averaged across all sites. Based on this analysis, we estimate that sequencing error accounts for <1% of assignment of nonhuman tags. In total, 78.8% of all predicted human tags were recovered. Each predicted tag was recovered, on average, 5.51 times. The distribution of quantitative tag recovery for single-frequency tags is shown in Supplemental Figure 1A. Comparison of number of observed tags vs. expected tags by chromosome revealed very high correlation (Table 2; Fig. 3; r2 = 0.999). Mapping of individual tags to chromosome locations revealed a normal XY karyotype (Supplemental Fig. 2). No tags met criteria for match to microbial sequence. Eight tags were found to match viral sequences: six tags unique for human endogenous retrovirus H, and two tags unique for human endogenous retrovirus K.
Table 1.
BsaXI tag recovery by experiment
Table 2.
Expected and recovered BsaXI tags per human chromosome from human blood sample by BRISK
Figure 3.
Observed vs. expected recovery of sequence tags by chromosome using BRISK from human whole blood sample. (Closed circles) unamplified DNA; (open circles) phi29 amplified DNA.
Application to linearly amplified DNA
To determine whether the BRISK technique could be used effectively with small amounts of DNA amplified by linear, multiple displacement (phi29) amplification (Leviel et al. 2004; Bredel et al. 2005), we amplified 1 ng of the blood-derived human genomic DNA to yield 1 μg of total material. 4,091,327 tags were recovered from amplified material, of which 3,868,735 (95%) were perfect matches for human sequence (Table 1). 50.0% of all human tags were recovered. Comparison of the human karyotype of amplified and unamplified DNA demonstrated a high degree of linearity of the amplified material, although tag recovery was not as perfectly linear as with unamplified material (Fig. 3). Regression analysis revealed very high correlation coefficients for observed vs. expected tag counts per chromosome (r2 = 0.976 for amplified material). The distribution of recovered single-copy tags did not reveal significant skewing relative to BRISK analysis of nonamplified material (Supplemental Fig. 1B). Karyotype analysis of amplified material showed no artifactual amplifications or deletions (Supplemental Fig. 3). No microbial sequences were recovered. Three tags were recovered for human endogenous retrovirus H. These results suggest that genomic DNA samples as small as 1 ng can be effectively analyzed with near-quantitative recovery of tags by BRISK.
Application to biome characterization
The sensitivity of BRISK for detection of nonhuman DNA was tested by spiking a human blood sample with purified Escherichia coli genomic DNA. 1μg of human blood DNA was combined with 20 pg of E. coli DNA (1:50,000 by weight, ∼1% by molar genome). As this sample was analyzed in multiplex (using a 2-bp bar code embedded in the adaptor), fewer total tags were recovered. Of the 681,325 tags recovered, 2104 (0.3%) were found to be perfect matches for E. coli. Of the 988 potential distinct E. coli sequence tags, 464 were recovered. No other tags meeting criteria for any other microbial genome were identified.
We proceeded to characterize the biome of the oral mucosa using BRISK to determine its ability to identify the organisms found in a complex host microbial environment. DNA was obtained from buccal brushings of two individuals and amplified with phi29 methodology. The first sample yielded 3,400,930 tags, of which 2,523,611 (74%) were human (Table 1). One percent, or 37,874 tags, were perfect matches for the microbial database, while 839,445 (25%) matched neither human sequence nor known microbial or viral sequence. In the second sample, 3,896,003 tags were recovered, of which 1,581,395 (41%) were of human origin (Table 1). There were 112,202 tags (3%) which were perfect matches for microbial or viral sequences, and 2,202,406 (57%) sequences matched neither human nor microbial/viral databases. Human karyotypes for both samples were highly linear suggesting quantitative recovery of human DNA (data not shown).
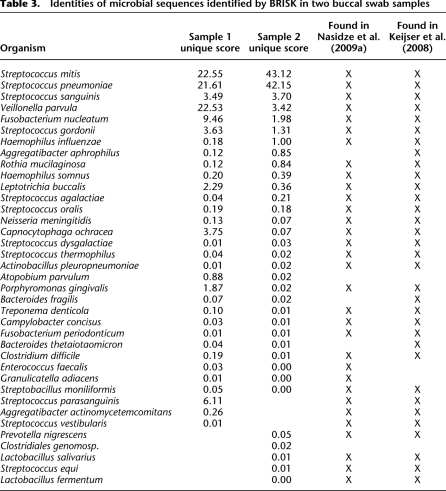
We considered a microbial species to be identified when two or more tags unique in the database to that species were recovered in an individual's buccal mucosa sample. None of the putative microbial matches were found in BRISK analysis of blood, HEK293, SW480, or HT-29 human cell lines (data not shown), suggesting that these are bona fide microbial sequences and not contaminant sequences or sequences shared between human and microbial genomes. Organisms corresponding to recovered tags found in both individuals' oral mucosa are shown in Table 3. A total of 29 species were identified in common from both patients' samples. Sequences from Streptococcus species were the most commonly recovered and accounted for 57.5% and 90.7% of all microbial tags recovered in the individual samples, respectively. Eighteen genera in total were identified. All have been previously identified in large-scale, deep sequencing of 16S DNA of the oral mucosa (Keijser et al. 2008; Nasidze et al. 2009a; Nasidze et al. 2009b; Zaura et al. 2009). While the majority of species were found in both individuals' samples, significant differences in quantitative recovery were found. In particular, Veillonella parvula, a gram-negative, anaerobic bacterium found as commensal in multiple human mucosal sites, accounted for 22.5% of tags in the first sample, but only 3.4% of tags in the second. A total of eight species were detected in only one individual's saliva, the most prevalent being Streptococcus parasanguinis, which constituted 6.1% of recovered tags from the first subject's sample but was not found in the second subject.
Table 3.
Identities of microbial sequences identified by BRISK in two buccal swab samples
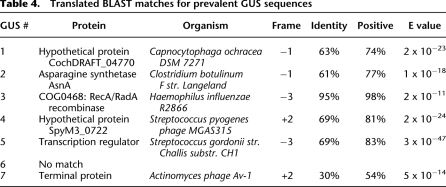
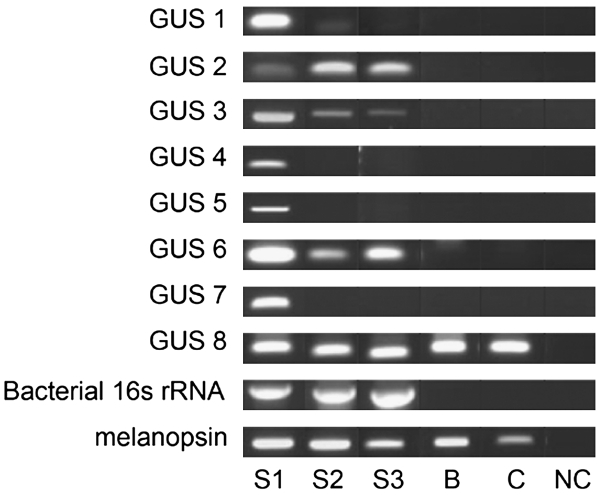
In both samples, the majority of apparent nonhuman tags were not found in the NCBI database (25% and 57% of total tags, respectively). We selected the 20 most abundantly recovered unknown tags found in saliva of one individual but not blood or cell line DNA for further analysis. Using the vectorette genomic DNA walking technique (Ko et al. 2003), we successfully generated additional genomic sequence ranging from 298 to 991 bp from eight of these tags (Supplemental Table 1). Analysis against the NCBI database revealed that all but one tag were unique and novel sequences in the nonredundant DNA database. We termed these sequences Genome Unknown Sequences (GUS). The eighth tag was found to be from a human gene sequence identified in a genome build subsequent to the build utilized in our bioinformatic software. To identify possible organisms accounting for these sequences, a translated BLAST search was performed for each sequence. While only GUS 3 was a near-perfect match (for Haemophilus influenza), five of the six remaining GUS tags yielded high probability matches (Table 3). All were homologous to microbially derived sequences, including two phage sequences [GUS 4 for a Streptococcus pyogenes phage (E value 2 × 10⁻²⁴) and GUS 7 for an Actinomyces phage (E value 5 × 10⁻¹⁴) (Table 4)]. We generated unique PCR primers for the novel sequences, targeting sequences outside the original BsaXI tag. As shown in Figure 4, three tag sequences (GUS 2, 3, and 6) were found in saliva of all individuals but not found in blood or HEK293 cell line DNA. The remaining three GUS tags appeared unique to the individual in whom they were identified.
Table 4.
Translated BLAST matches for prevalent GUS sequences
Figure 4.
Distribution of genomically unknown sequences (GUS) in the oral mucosa of three normal human volunteers. PCR primers were designed for each of eight GUS tags and performed on salivary DNA samples from three individuals (S1–S3). S1 was the individual from whom each GUS was originally identified. (B) is PCR performed on blood-derived DNA from subject 1; (C) is PCR performed on DNA derived from HEK293 cells. (NC) is a no-template DNA negative control. Universal bacterial 16S primers were used as positive control for the presence of bacterial DNA. Melanopsin (OPN4)-specific primers were used as positive control for the presence of human DNA. After sequence extension by vectorette-assisted genome walking, GUS 8 was identified as a human DNA sequence from clone RP11-318L16 on chromosome 1.
Application to pathogen detection in carcinoma
One of the attractive features of digital karyotyping in pathogen detection and discovery is the ability to find potential pathogens associated with specific disease conditions. Most cases of nasopharyngeal carcinoma are associated with Epstein-Barr virus (EBV, HHV-4), which is thought to be causative of disease (Thompson and Kurzrock 2004). To determine if BRISK has adequate sensitivity to detect a virally mediated carcinoma, we subjected two fixed, parafin-embedded microscope slides of a nasopharyngeal carcinoma specimen to the method following phi29 amplification of recovered DNA. A total of 1,970,031 human sequences were recovered. Of these, there were 81,799 tags (4.1%) which were perfect matches for HHV-4. Additionally, 16, 826 tags were recovered that were perfect matches for either Delftia acidovorans, Stenotrophomonas maltophilia, Propionibacterium acnes, or Cupravidus metalidurans. It is assumed that the latter were bacterial contaminants found on the surface of the pathology specimen slides.
Discussion
The characterization of the human microbiome is important for the understanding of disease. Various sites in the human body house trillions of microbes, phages, and viruses, whose presence may be essential to development of diseases such as Type I diabetes (Wen et al. 2008), obesity (Turnbaugh et al. 2009), and cancer (Lampe 2008). Individual sites such as the oral mucosa, intestinal tract, and skin harbor unique microbiomes that vary between individuals and change over time (Turnbaugh et al. 2009). Numerous potential pathogens are also part of the normal commensal flora. Methods for characterization of the human microbiome have included large scale “universal” 16S (bacterial) and 5.8 S and 28S (fungal) DNA sequencing (for review, see Petrosino et al. 2009), array-based techniques for detection of viral sequences (Wang et al. 2002a; Palacios et al. 2007), large scale shotgun sequencing (Qin et al. 2010), and shotgun proteomics (Verberkmoes et al. 2009). These techniques are all powerful methods for determination of the members of a microbiome community, but all make significant assumptions about the nature of members (i.e., bacterial, fungal, viral).
Large scale saturation shotgun DNA sequencing of complex biomes (Venter et al. 2004) represents the gold standard for characterization of DNA-based life forms but is extremely resource-intensive and not practical at present for use on individual human subject or patient samples. Digital karyotyping techniques (Wang et al. 2002b; Tengs et al. 2004) represent an approximation of total shotgun sequencing, in which a defined representation (in our case, 27-bp sequence per 4096-bp average for 6-bp recognition site, or 0.66% of total genome) can be sequenced to near-saturation. This technique has recently been used to identify microbial sequences associated with human cancers (Duncan et al. 2009) but has not been previously used to characterize complex microbiomes.
The BRISK technique represents a conceptual extension of the RECORD method (Tengs et al. 2004), allowing specific amplification of Type IIB endonuclease restriction fragments without cloning and direct application of these fragments to a massively parallel DNA sequencing platform. The technique may be performed as described on very small amounts of material (on the order of 1 ng starting genomic DNA when phi29 amplification is employed). The technique is quite rapid, requiring ∼6 h from sample acquisition to initiation of DNA sequencing. Because the representation is defined by the BsaXI restriction site, all known human, microbial, viral, fungal, and parasitic tags can be a priori predicted, allowing for very rapid bioinformatics analysis; complete analysis of samples containing >106 sequence tags can be completed in ∼15 min on a standard desktop personal computer. Because of the large number of tags generated in this technique, resolution of the digital karyotype approaches the theoretical limit of 4 kb and allows precise mapping of amplifications and deletions.
We chose to examine the oral mucosa using BRISK, as this is a relatively well-characterized site with respect to bacterial flora. The BRISK analysis was able to identify nearly 30 species in common between two individuals. The genera identified have all been previously identified in large-scale studies as present in normal oral mucosa and constitute the majority of previously identified species. BRISK analysis of the oral microbiome suggests that greater than 90% of nonhuman sequences in the mouth have not been previously sequenced in any context. Some of these sequences undoubtedly belong to species whose 16S or other sequences are known. Interestingly, however, when we examined seven of the most prevalent of these sequences by chromosome walking, the majority of sequences remained uncharacterized. Conceptual translation of these sequences revealed only one candidate likely to be a direct match for a known microbe. Two of the six remaining sequences appear to be phage-derived. With the recent suggestion that a phage may be a determinant of pathogenicity in diseases such as meningitis (Bille et al. 2008), means to detect such sequences may be of importance (Tinsley et al. 2006).
The BRISK method does have limitations for the characterization of complex biomes. As a DNA-based technique, BRISK cannot detect RNA viruses or microRNA signatures without modification (i.e., reverse transcription). The sensitivity for detection of foreign DNA with BRISK is dependent on the relative abundance of the foreign organism and its genome size, making very small foreign genomes [such as the polyoma virus responsible for Merkel cell tumors (Feng et al. 2008)] difficult to detect. Similarly, although BRISK provides some quantitative information on abundance in the form of “tag counts,” knowledge of the relative genome size is required for more precise quantitation. Finally, BRISK does require use of a massively parallel DNA sequencing apparatus, which may not be readily available.
Despite these limitations, BRISK represents a rapid and highly sensitive method for characterization of complex microbiomes, in addition to being a sensitive means for performing digital karyotyping. With new sequence information arising from human microbiome research, the utility of this approach will increase. BRISK will be well-suited to analysis of particular microbiomes over time, as analyses are directly comparable from one time point to the next; such analysis would likely be more efficient and cost-effective than repeated deep sequencing, for example. BRISK should find substantial application in the characterization of human and other microbiota.
Methods
Subjects
DNA was collected from venous blood and buccal swabs of healthy volunteers. This study was performed with informed consent, under Institutional Review Board approval of the Washington University Medical School and University of Washington Medical School.
Preparation of genomic DNA
Genomic DNA (gDNA) was extracted from the HEK293T cell line (ATCC, CRL-11268) and E. coli (Invitrogen) using the DNEasy Blood and Tissue kit (Qiagen). Human blood gDNA was extracted using the Paxgene kit (Qiagen), and gDNA from buccal brushings was harvested using the Purgene C kit (Qiagen). The gDNA was eluted into deionized, distilled water (ddH2O). 3 μg gDNA was used for each analysis.
BsaXI digest of gDNA
After extraction, the gDNA was digested using a type IIB restriction endonuclease, BsaXI (New England Biolabs), using the manufacturer's recommended buffer and reaction conditions at 37°C for 16 h.
Preparation of adaptors
Adaptors complementary to the solid-phase bridge oligonucleotides on the Illumina Genome Analyzer's flow cell were synthesized and purified by high-performance liquid chromatography (Integrated DNA Technologies). The longer adaptor was 5′-AATGATACGGCGACCACCGAGATCTACACTCTTTCCCTACACGACGCTCTTCCGATCTMMNNN-3′, where the MM represents two pre-determined bases (AA, TT, CC, GG) used as the barcode for multiplex sequencing, and NNN represents a 5′ degenerate overhang to hybridize with the 3-bp 3′ overhang on the restriction fragment. The complement for this adaptor was 5′-MMAGATCGGAACAGCGTCGTGTAGGGAAAGAGTGTAGATCTCGGTGGTCGCCGTATCATT-3′.
The shorter tag was biotinylated: 5′-Bio-CAAGCAGAAGACGGCATACGAGCTCTTCCGATCNNN-3′. The complement to this adaptor was 5′-CTAGCCTTCTCGAGCATACGGCAGAAGACGAAC-3′.
The adaptors were reconstituted in ddH2O to create a 10 mM solution. The adaptors were annealed by placing the equimolar mix in a boiling-water bath for two minutes, then removing the bath from the heat source and allowing to cool to room temperature (∼3 h). The double stranded adaptors were diluted in 1× TE to a working solution of 1 mM.
Ligation of adaptors to BsaXI restriction fragments
Restriction fragments were ligated to the adaptors using T4 DNA ligase (New England Biolabs) under standard conditions, modified by additional ATP (Sigma-Aldrich) at 1 μM. Ligation was carried out at 4°C for 1 h.
Separation of products on a biotin-streptavidin column
The ligated tags were separated on a Dynabead column (Invitrogen) using magnetic stand (Invitrogen) to isolate the asymmetric ligation product of interest. First, the beads were washed twice with 2× binding and wash buffer (10 mM Tris-HCl at pH 7.5; 1mM EDTA; 2M NaCl). The beads were resuspended in a half-volume of 2× binding and wash buffer, and the ligation product was added to the column. After shaking on a horizontal rotator for 20 min, the supernatant was removed, and the beads were washed twice with 1× binding and wash buffer.
Nick-translation using Bst DNA polymerase
Bound products were incubated with 0.4 mM dNTPs (Sigma) and Bst DNA polymerase (New England Biolabs) under the manufacturer's recommended conditions. After shaking at 65°C for 20 min, the supernatant was removed, and the beads were washed twice with 1× binding and wash buffer.
Collection of the ssDNA library containing the asymmetric product of interest
To remove the product of interest (i.e., 33-bp tag with one short and one long adaptor ligated), ssDNA was melted from the column using a solution of 100 mM NaCl and 125 mM NaOH. After addition of the melt solution, the column was shaken on a vertical rotator for 10 min. The supernatant was removed on the magnet and neutralized using an equal volume of a neutralization solution made of buffer PBI from the Qiaquick PCR purification kit (Qiagen) and 0.15% acetic acid.
PCR amplification of the ssDNA library
To amplify the product of interest, PCR using Phusion Taq (Finnzymes) was performed. The sequence of the 5′ primer for this reaction was: 5′-AATGATACGGCGACCACCGAGATCT-3′; the sequence of the 3′ primer for this reaction was: 5′-CAAGCAGAAGACGGCATACGAGCTCTTCCGATC-3′. The PCR was performed using a rapid cycling method with 25 cycles of: 94°C for 30 sec and 72°C for 15 sec. To prepare samples for high-throughput sequencing, ten identical PCR products were combined and purified using the Qiaquick PCR purification kit (Qiagen).
Bioinformatic analysis of sequencing results
All available human and microbial genomes from NCBI were downloaded in Feb. 2007 and virtually digested with the BsaXI restriction enzyme to produce a library of 33-bp tags mapped to their respective sources and locations. To analyze the sequencing information, raw sequences that matched the restriction enzyme site were identified and only tags that appeared more than once were analyzed. The 27 bp surrounding the DNA recognition sequence was used for analysis. The resulting tags were filtered against the library of tags from the human genome by finding the shortest edit distance (ED) from each sample tag to the library tag. Based upon an empirically-derived, distribution-based analysis, a cutoff of 3 ED was used to classify a tag as a match to the human genome. All remaining tags were similarly matched against all sequenced bacterial, viral, and fungal genomes that were present in the nonredundant NCBI database. Individual tags that were 3 ED from the nearest known genomes were classified as a “genomically unknown sequence” (GUS). GUS tags were then BLAST-searched against the entire NCBI nonredundant database. For tags matching sequences in the microbial database, analysis was performed at the level of genus, as many subspecies of particular microbial genera had identical tags.
The frequency of the tag in the sample (observed) was divided by the frequency of the tag in the virtually digested human genome (expected); this value was rounded to the nearest whole number to create a score for each organism in the sample. For in silico karyotyping, single-frequency human library tags unique to each chromosome were identified. Chromosome distribution maps were generated by dividing observed tag density over expected tag density per contiguous 1000 unique tags.
Perl source code for all analysis software used in this study is available from the corresponding author.
Genome-walking protocol to extend GUS tags
A vectorette protocol (Ko et al. 2003) was used to find adjacent sequence to GUS tags. Vectorette libraries of phi29 amplified buccal mucosal DNA from the original sample were constructed using eight restriction enzymes (BglII, BclI, BstBI, BsaHI, XbaI, SpeI, MfeI, EcoRI; New England Biolabs). The restriction products were ligated to vectorette adaptors annealed to an imperfect complement that created a bubble structure in each adaptor. The four types of vectorette adaptors were complementary to the four types of overhangs created by the restriction enzymes. The sequence for the four vectorette adaptors were as follows:
Vect 57 GATC 5′-GATCGAAGGAGAGGACGCTGTCTGTCGAAGGTAAGGAACGGACGAGAGAAGGGAGAG-3′;
Vect 57 CTAG 5′-CTAGGAAGGAGAGGACGCTGTCTGTCGAAGGTAAGGAACGGACGAGAGAAGGGAGAG-3′;
Vect 57 TTAA 5′-AATTGAAGGAGAGGACGCTGTCTGTCGAAGGTAAGGAACGGACGAGAGAAGGGAGAG-3′;
Vect 55 GC 5′-CGGAAGGAGAGGACGCTGTCTGTCGAAGGTAAGGAACGGACGAGAGAAGGGAGAG-3′
The sequence for the mismatched complement was as follows:
Vect 53 5′-CTCTCCCTTCTCGAATCGTAACCGTTCGTACGAGAATCGCTGTCCTCTCCTTC-3′.
Before ligation, the adaptors were mixed with the restriction products at a final concentration of 0.02 μM and incubated at 65°C for 5 min. To ensure optimal annealing, the block containing samples was removed from the heat source and allowed to cool to room temperature and then placed at 4°C for 1 h. Subsequently, the T4 DNA ligase (New England Biolabs), T4 DNA ligase buffer (New England Biolabs), and 10 μM ATP (Sigma-Aldrich) were added, and the reaction was incubated at 16°C overnight.
After construction, the DNA library was used for PCR with primers to the unique GUS tag and primers to the vectorette adaptors at a final concentration of 0.25 μM. HotStarTaq (Qiagen) was used under standard conditions in a step-down PCR. Three samples of each DNA digest in the library were run at a low, medium, and high temperature during each anneal step to determine if bands were true products or secondary to PCR artifacts. The temperature conditions for the PCR were 95°C for 14 min; denaturing at 95°C for 1 min, annealing across a gradient of 63–72°C for 1 min, extension at 72°C for 2 min for 5 cycles; denaturing at 95°C for 1 min, annealing across a gradient of 59–68°C for 1 min, then extension at 72°C for 2 min for 5 cycles; denaturing at 95°C for 45 sec, annealing across a gradient of 55–64°C for 1 min, then extension at 72°C for 2 min for 10 cycles; denaturing at 95°C for 45 sec, then annealing across a gradient for 51–60°C for 1 min, then extension at 72°C for 2 min for 10 cycles; final extension was done at 72°C for 10 min.
Products from this PCR were separated on a 2% Tris-Acetate-EDTA agarose gel, and bands appearing across all annealing temperatures for a particular set of DNA in the library were extracted using the DNA Clean and Concentrator (Zymo Research). These products were transformed and cloned using the Topo TA pCR 2.1 kit (Invitrogen). Cloned plasmids were extracted using the Qiaprep Spin Miniprep Kit (Qiagen), and the DNA was subjected to standard dye-terminator sequencing.
Confirmation of sequences obtained from genome walking
To confirm that sequences extracted by genome walking were present in the sample, PCR primers were designed outside the original tag sequence and used to amplify the initial DNA sample. The PCR used Fisher Bioreagents Taq DNA polymerase (Fisher) under standard conditions. The temperature conditions for the PCR were 94°C for 2 min; denaturing at 94°C for 30 sec, annealing at a temperature determined by primer Tm for 30 sec, and extension at 72°C for 30 sec for 20 cycles, and then a final extension at 72°C for 5 min.
Acknowledgments
We thank Terri Gibler for technical support for earlier versions of this technique. This work was supported by the Burroughs-Wellcome Clinical Scientist Award in Translational Science (R.N.V.G.), the Danforth Foundation (R.N.V.G.), Fight for Sight (V. Muthappan), and Medical Scholar and Unrestricted Grants from Research to Prevent Blindness (V.M., R.N.V.G.). This work was supported in part by NIH CORE Grant P30EY001730.
Footnotes
[Supplemental material is available for this article. The sequencing data from this study have been submitted to GenBank (http://www.ncbi.nlm.nih.gov/Genbank/) under accession nos. FI185049.1, FI185051.1, FI185052.1, FI185053.1, FI185054.1, and FI185056.1.]
Article published online before print. Article, supplemental material, and publication date are at http://www.genome.org/cgi/doi/10.1101/gr.115758.110.
References
- Aas J, Paster B, Stokes L, Olsen I, Dewhirst F 2005. Defining the normal bacterial flora of the oral cavity. J Clin Microbiol 43: 5721–5732 [DOI] [PMC free article] [PubMed] [Google Scholar]
- Bentley D, Balasubramanian S, Swerdlow H, Smith G, Milton J, Brown C, Hall K, Evers D, Barnes C, Bignell H, et al. 2008. Accurate whole human genome sequencing using reversible terminator chemistry. Nature 456: 53–59 [DOI] [PMC free article] [PubMed] [Google Scholar]
- Bille E, Ure R, Gray S, Kaczmarski E, McCarthy N, Nassif X, Maiden M, Tinsley C 2008. Association of a bacteriophage with meningococcal disease in young adults. PLoS ONE 3: e3885 doi: 10.1371/journal.pone.0003885 [DOI] [PMC free article] [PubMed] [Google Scholar]
- Bredel M, Bredel C, Juric D, Kim Y, Vogel H, Harsh GR, Recht LD, Pollack JR, Sikic BI 2005. Amplification of whole tumor genomes and gene-by-gene mapping of genomic aberrations from limited sources of fresh-frozen and paraffin-embedded DNA. J Mol Diagn 7: 171–182 [DOI] [PMC free article] [PubMed] [Google Scholar]
- Costello E, Lauber C, Hamady M, Fierer N, Gordon J, Knight R 2009. Bacterial community variation in human body habitats across space and time. Science 326: 1694–1697 [DOI] [PMC free article] [PubMed] [Google Scholar]
- Duncan C, Leary R, Lin J, Cummins J, Di C, Schaefer C, Wang T, Riggins G, Edwards J, Bigner D, et al. 2009. Identification of microbial DNA in human cancer. BMC Med Genomics 2: 22 doi: 10.1186/1755-8794-2-22 [DOI] [PMC free article] [PubMed] [Google Scholar]
- Eckburg P, Bik E, Bernstein C, Purdom E, Dethlefsen L, Sargent M, Gill S, Nelson K, Relman D 2005. Diversity of the human intestinal microbial flora. Science 308: 1635–1638 [DOI] [PMC free article] [PubMed] [Google Scholar]
- Feng H, Shuda M, Chang Y, Moore P 2008. Clonal integration of a polyomavirus in human Merkel cell carcinoma. Science 319: 1096–1100 [DOI] [PMC free article] [PubMed] [Google Scholar]
- Fredricks D, Fiedler T, Thomas K, Mitchell C, Marrazzo J 2009. Changes in vaginal bacterial concentrations with intravaginal metronidazole therapy for bacterial vaginosis as assessed by quantitative PCR. J Clin Microbiol 47: 721–726 [DOI] [PMC free article] [PubMed] [Google Scholar]
- Graham J, Moore J, Jiru X, Goodall E, Dooley J, Hayes V, Dartt D, Downes C, Moore T 2007. Ocular pathogen or commensal: A PCR-based study of surface bacterial flora in normal and dry eyes. Invest Ophthalmol Vis Sci 48: 5616–5623 [DOI] [PubMed] [Google Scholar]
- Grice E, Kong H, Conlan S, Deming C, Davis J, Young A, Bouffard G, Blakesley R, Murray P, Green E, et al. 2009. Topographical and temporal diversity of the human skin microbiome. Science 324: 1190–1192 [DOI] [PMC free article] [PubMed] [Google Scholar]
- Hormozdiari F, Alkan C, Ventura M, Hajirasouliha I, Malig M, Hach F, Yorukoglu D, Dao P, Bakhshi M, Sahinalp SC, et al. 2011. Alu repeat discovery and characterization within human genomes. Genome Res (in press). [DOI] [PMC free article] [PubMed] [Google Scholar]
- Keijser BJ, Zaura E, Huse SM, van der Vossen JM, Schuren FH, Montijn RC, ten Cate JM, Crielaard W 2008. Pyrosequencing analysis of the oral microflora of healthy adults. J Dent Res 87: 1016–1020 [DOI] [PubMed] [Google Scholar]
- Ko W, David R, Akashi H 2003. Molecular phylogeny of the Drosophila melanogaster species subgroup. J Mol Evol 57: 562–573 [DOI] [PubMed] [Google Scholar]
- Kurokawa K, Itoh T, Kuwahara T, Oshima K, Toh H, Toyoda A, Takami H, Morita H, Sharma V, Srivastava T, et al. 2007. Comparative metagenomics revealed commonly enriched gene sets in human gut microbiomes. DNA Res 14: 169–181 [DOI] [PMC free article] [PubMed] [Google Scholar]
- Lampe J 2008. The Human Microbiome Project: Getting to the guts of the matter in cancer epidemiology. Cancer Epidemiol Biomarkers Prev 17: 2523–2524 [DOI] [PubMed] [Google Scholar]
- Leary R, Cummins J, Wang T, Velculescu V 2007. Digital karyotyping. Nat Protoc 2: 1973–1986 [DOI] [PubMed] [Google Scholar]
- Leviel K, Olarte M, Sullivan PF 2004. Genotyping accuracy for whole-genome amplification of DNA from buccal epithelial cells. Twin Res 7: 482–484 [DOI] [PubMed] [Google Scholar]
- Nasidze I, Li J, Quinque D, Tang K, Stoneking M 2009a. Global diversity in the human salivary microbiome. Genome Res 19: 636–643 [DOI] [PMC free article] [PubMed] [Google Scholar]
- Nasidze I, Quinque D, Li J, Li M, Tang K, Stoneking M 2009b. Comparative analysis of human saliva microbiome diversity by barcoded pyrosequencing and cloning approaches. Anal Biochem 391: 64–68 [DOI] [PubMed] [Google Scholar]
- Oakley B, Fiedler T, Marrazzo J, Fredricks D 2008. Diversity of human vaginal bacterial communities and associations with clinically defined bacterial vaginosis. Appl Environ Microbiol 74: 4898–4909 [DOI] [PMC free article] [PubMed] [Google Scholar]
- Palacios G, Quan P, Jabado O, Conlan S, Hirschberg D, Liu Y, Zhai J, Renwick N, Hui J, Hegyi H, et al. 2007. Panmicrobial oligonucleotide array for diagnosis of infectious diseases. Emerg Infect Dis 13: 73–81 [DOI] [PMC free article] [PubMed] [Google Scholar]
- Petrosino J, Highlander S, Luna R, Gibbs R, Versalovic J 2009. Metagenomic pyrosequencing and microbial identification. Clin Chem 55: 856–866 [DOI] [PMC free article] [PubMed] [Google Scholar]
- Qin J, Li R, Raes J, Arumugam M, Burgdorf KS, Manichanh C, Nielsen T, Pons N, Levenez F, Yamada T, et al. 2010. A human gut microbial gene catalogue established by metagenomic sequencing. Nature 464: 59–65 [DOI] [PMC free article] [PubMed] [Google Scholar]
- Tengs T, LaFramboise T, Den RB, Hayes DN, Zhang J, DebRoy S, Gentleman RC, O'Neill K, Birren B, Meyerson M 2004. Genomic representations using concatenates of Type IIB restriction endonuclease digestion fragments. Nucleic Acids Res 32: e121 doi: 10.1093/nar/gnh120 [DOI] [PMC free article] [PubMed] [Google Scholar]
- Thompson MP, Kurzrock R 2004. Epstein-Barr virus and cancer. Clin Cancer Res 10: 803–821 [DOI] [PubMed] [Google Scholar]
- Tinsley C, Bille E, Nassif X 2006. Bacteriophages and pathogenicity: More than just providing a toxin? Microbes Infect 8: 1365–1371 [DOI] [PubMed] [Google Scholar]
- Turnbaugh P, Ley R, Hamady M, Fraser-Liggett C, Knight R, Gordon J 2007. The human microbiome project. Nature 449: 804–810 [DOI] [PMC free article] [PubMed] [Google Scholar]
- Turnbaugh P, Hamady M, Yatsunenko T, Cantarel B, Duncan A, Ley R, Sogin M, Jones W, Roe B, Affourtit J, et al. 2009. A core gut microbiome in obese and lean twins. Nature 457: 480–484 [DOI] [PMC free article] [PubMed] [Google Scholar]
- Venter J, Remington K, Heidelberg J, Halpern A, Rusch D, Eisen J, Wu D, Paulsen I, Nelson K, Nelson W, et al. 2004. Environmental genome shotgun sequencing of the Sargasso Sea. Science 304: 66–74 [DOI] [PubMed] [Google Scholar]
- Verberkmoes N, Russell A, Shah M, Godzik A, Rosenquist M, Halfvarson J, Lefsrud M, Apajalahti J, Tysk C, Hettich R, et al. 2009. Shotgun metaproteomics of the human distal gut microbiota. ISME J 3: 179–189 [DOI] [PubMed] [Google Scholar]
- Wang D, Coscoy L, Zylberberg M, Avila P, Boushey H, Ganem D, DeRisi J 2002a. Microarray-based detection and genotyping of viral pathogens. Proc Natl Acad Sci 99: 15687–15692 [DOI] [PMC free article] [PubMed] [Google Scholar]
- Wang T, Maierhofer C, Speicher M, Lengauer C, Vogelstein B, Kinzler K, Velculescu V 2002b. Digital karyotyping. Proc Natl Acad Sci 99: 16156–16161 [DOI] [PMC free article] [PubMed] [Google Scholar]
- Wen L, Ley R, Volchkov P, Stranges P, Avanesyan L, Stonebraker A, Hu C, Wong F, Szot G, Bluestone J, et al. 2008. Innate immunity and intestinal microbiota in the development of Type 1 diabetes. Nature 455: 1109–1113 [DOI] [PMC free article] [PubMed] [Google Scholar]
- Williamson S, Rusch D, Yooseph S, Halpern A, Heidelberg K, Glass J, Andrews-Pfannkoch C, Fadrosh D, Miller C, Sutton G, et al. 2008. The Sorcerer II Global Ocean Sampling Expedition: Metagenomic characterization of viruses within aquatic microbial samples. PLoS ONE 3: e1456 doi: 10.1371/journal.pone.0001456 [DOI] [PMC free article] [PubMed] [Google Scholar]
- Yujian L, Bo L 2007. A normalized Levenshtein distance metric. IEEE Trans Pattern Anal Mach Intell 29: 1091–1095 [DOI] [PubMed] [Google Scholar]
- Zaura E, Keijser BJ, Huse SM, Crielaard W 2009. Defining the healthy “core microbiome” of oral microbial communities. BMC Microbiol 9: 259 doi: 10.1186/1471-2180-9-259 [DOI] [PMC free article] [PubMed] [Google Scholar]


