

Abstract
Ruthenium dipyridophenazine (dppz) complexes are sensitive luminescent probes for hydrophobic environments. Here, we apply multiple-frequency fluorescence lifetime imaging microscopy (FLIM) to Δ and Λ enantiomers of lipophilic ruthenium dppz complexes in live and fixed cells, and their different lifetime staining patterns are related to conventional intensity-based microscopy. Excited state lifetimes of the enantiomers determined from FLIM measurements correspond well with spectroscopically measured emission decay curves in pure microenvironments of DNA, phospholipid membrane or a model protein. We show that FLIM can be applied to monitor the long-lived excited states of ruthenium complex enantiomers and, combined with confocal microscopy, give new insight into their biomolecular binding and reveal differences in the microenvironment probed by the complexes.
Keywords: Ruthenium dipyridophenazine complex, Biomolecular binding, Membrane, Excited state lifetime, Emission spectroscopy
Ruthenium dipyridophenazine (dppz) complexes have evolved as luminescent probes owing to their high affinity for DNA, and the “light switch effect” that makes them brightly luminescent in hydrophobic environments and virtually non-luminescent in aqueous solutions.1–10 The chiral ruthenium dppz complex enantiomers with their characteristic propeller shapes have been used as diastereomeric probes of DNA11 and to probe the handedness of DNA helices.12 The two enantiomers show large differences in both emission quantum yield and excited state lifetime when bound to DNA in spite of the fact that both DNA affinity and binding geometry (intercalation) are very similar. These photophysical differences are most likely due to slightly different locations of the dppz-ligand in the intercalation pocket for Δ and Λ, respectively.5,11,13–15 Apart from their well characterized DNA-binding properties, ruthenium(II) complexes also show potential as luminescent probes for other bioenvironments, such as RNA16,17 and lipid membranes.18–21 The large Stokes shift, red emission wavelengths, high photostability, and the fact that the excited state properties can be systematically tuned by ligand substitution, make these metal ligand complexes attractive as fluorescent probes in cellular imaging applications in comparison to conventional organic fluorescent dyes. Since the photoluminescence lifetime is independent of fluorophore concentration, light intensity and photobleaching,22 it is an ideal parameter to remotely monitor the local environment of the probe. Ruthenium polypyridyl complexes have been used as oxygen sensing probes,23–25 and their ability to monitor the microenvironment may enable probing of cellular events and biomolecular interactions26 by fluorescence lifetime imaging microscopy (FLIM).
In this study, the two enantiomers of an alkyl ether substituted Ru(phen)2dppz2+ complex (where phen is 1,10-phenantroline) denoted D4 in Chart 1, and their interaction with calf thymus DNA, phospholipid vesicles and bovine serum albumin, as well as their cellular localization, binding preference and differences in excited state lifetimes in CHO-K1 cells, have been investigated by multiple-frequency FLIM and confocal laser scanning microscopy (CLSM). Additionally, photophysical characterization by steady state emission and pulsed laser spectroscopy of the enantiomers in various pure environments has been performed and compared to microscopy data. Little is known about diastereomeric differences for ruthenium complexes regarding affinity to the plasma membrane, cellular uptake27 or biomolecular binding and, to the best of our knowledge, this is the first time FLIM has ever been used to reveal differences in enantiomeric intracellular staining in mammalian cells.
Chart 1.
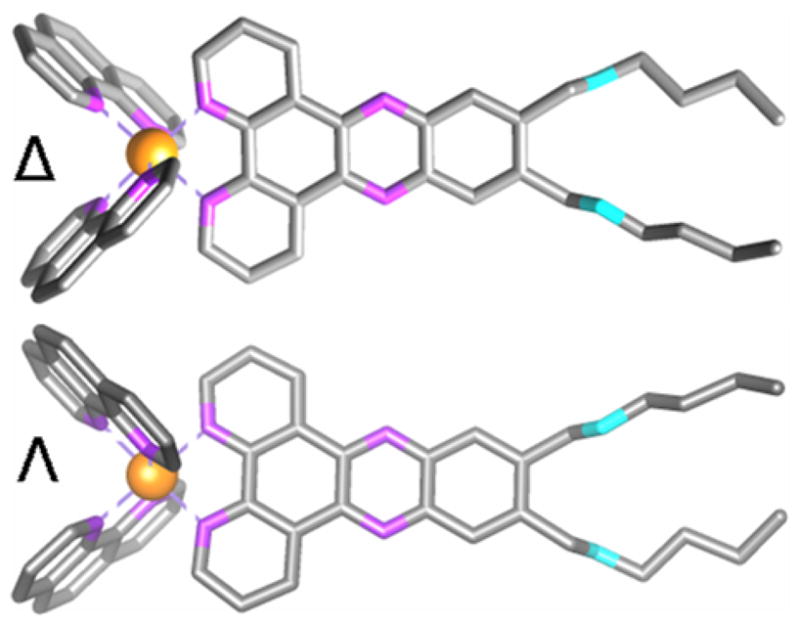
Molecular structure of Δ- and Λ-D4. Ruthenium are shown in orange, nitrogen in purple and oxygen in cyan. Hydrogens are omitted for clarity.
The CLSM images of Δ- and Λ-D4 in fixed CHO-K1 cells in Figure 1 show the emission intensities in the cytoplasm to be very similar for the two enantiomers. However, Δ shows much brighter emission inside the nucleus but less intensity in the nucleolus, as when compared to Λ for which the emission in the nucleolus is most intense (Figure 1, intensity profiles).
Figure 1.
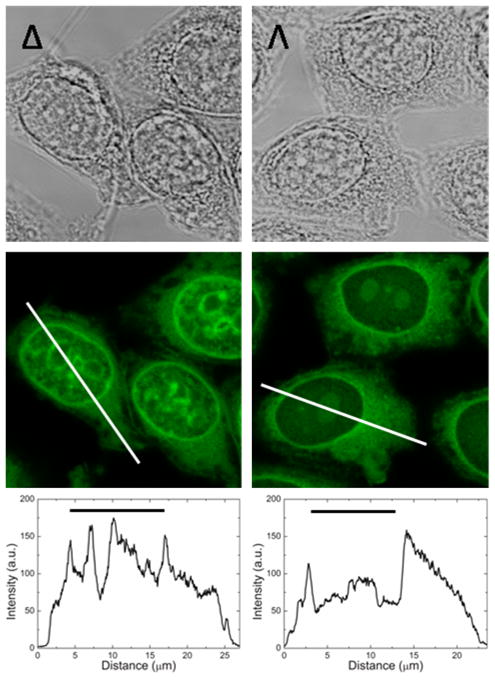
Representative transmission (upper) and emission confocal laser scanning (middle) images of the intracellular distribution of Δ- and Λ-D4 in fixed CHO-K1 cells. The lower panel shows intensity profile plots resolving intracellular differences in emission intensity of the two enantiomers. The black horizontal bars indicate the location of the nucleus. Laser intensity and photo multiplier gain are the same in both images, and intensities are thus directly comparable.
The different emission intensities in the nuclei for Δ and Λ revealed by confocal microscopy could be due to diverse concentrations, and hence affinity to the constituents of the nucleus, or to a difference in photophysical properties, or both. To gain further insight on the influence of the microenvironment of the complexes, excited state lifetimes for the enantiomers in different bio-environments were measured. Multiple-frequency FLIM and time-resolved emission decay measurements were performed on the enantiomers bound to calf thymus DNA (ctDNA), phospholipid vesicles (LUV), and Bovine serum albumin (BSA) and the obtained lifetimes are presented in Table 1, together with fractional intensities. As expected, the lifetime of the two enantiomers differ significantly when bound to DNA; Δ shows a 5–7 times longer apparent lifetime than Λ, when fitted to a biexponential decay function.14 Importantly, the lifetimes obtained from FLIM are consistently in the same range as those from the time-resolved emission measurements. Both enantiomers show monoexponential decay rates and similar lifetimes when embedded in the lipid bilayer of LUVs, although with the presence of a component too fast for the time resolution of the instrument, attributed to scattering from the vesicles. The LUV values also correspond well to the ones obtained for similar racemic complexes reported previously.20 When the lifetimes of the LUV-bound complexes are measured with FLIM, two lifetimes are needed to accurately fit the data, and the apparent lifetimes are slightly shorter, but still in the same range, as the emission decay results. Data for complexes bound to BSA can be nicely fitted with a two-exponential decay function, and the apparent lifetimes are comparable for both enantiomers and similar to those in LUVs.
Table 1.
Emission decay parameters for Δ- and Λ-D4 (5μM) measured by time-resolved emission and FLIM in calf thymus DNA (30 μM), phospholipid vesicles (LUV) (150 μM), and Bovine serum albumin (50 μM). Presented data are for air-equilibrated samples.
| Δ enantiomer | Λ enantiomer | |||||||||||
|---|---|---|---|---|---|---|---|---|---|---|---|---|
| τ1 (ns) | τ2 (ns) | α2a, f2 | χ2b | τ̄b (ns) | Φc (%) | τ1 (ns) | τ2 (ns) | α2, f2 | χ2 | τ̄ (ns) | Φ (%) | |
| ctDNA | 75 | 670 | 0.55, 0.92 | - | 402 | 3.7 | 20 | 110 | 0.40, 0.79 | - | 56 | 0.4 |
| ctDNA (FLIM) | 83 | 695 | 0.44, 0.87 | 7 | 352 | - | 37 | 292 | 0.11, 0.47 | 4 | 65 | - |
| LUV | 125 | - | - | - | 125 | 1.6 | 136 | - | - | - | 136 | 1.9 |
| LUV (FLIM) | 38 | 218 | 0.25, 0.66 | 9 | 83 | - | 26 | 228 | 0.19, 0.67 | 8 | 64 | - |
| BSA | 30 | 315 | 0.37, 0.86 | - | 135 | 0.3 | 40 | 280 | 0.43, 0.84 | - | 143 | 0.3 |
| BSA (FLIM) | 52 | 534 | 0.15, 0.65 | 29 | 124 | - | 39 | 399 | 0.12, 0.58 | 18 | 82 | - |
α2=(f2/τ2)/((f1/τ1)+(f2/τ2))
The multi-frequency fit is reproduced by the Levenberg-Marquardt algorithm28, and the goodness-of-fit parameter χ2 is calculated as explained in reference 22 and in Supporting Information.
Quantum yields, Φ, are calculated by using the absolute value of 7.72 for Ru(phen)2dppz(CH3)2 2+ in 1,2-propanediol as reference.29
Apparent lifetimes are calculated as
Quantum yields (Φ) have also been obtained from steady state emission for the two enantiomers in the different environments, Table 1. In general, the two enantiomers have roughly the same quantum yields, except when bound to DNA, where Φ(Δ) is about nine times higher than Φ(Λ). When the samples are purged with nitrogen for 10 minutes to reduce the free oxygen concentration, only a minor increase in quantum yield is observed for complexes bound to DNA or LUVs (less than 10%), whereas BSA-bound complex show an increase of about 70%, indicating that not only the azanitrogens on the dppz-ligand, but the whole molecule as such, is more exposed in the BSA environment. The data presented here can be used to partly explain what is observed in Figure 1; The enantiomers have similar emission intensity in the cytoplasm, presumably bound to membrane structures in the endoplasmic reticulum and Golgi apparatus. The higher quantum yield for DNA-bound Δ results in brighter staining of the nucleus for this enantiomer.
Figure 2 shows the false color emission lifetime, emission intensity and bright field image of Δ- and Λ-D4 in fixed CHO-K1 cells. The false color image reflects the apparent excited state lifetime of the complexes, fitted with one lifetime in each pixel. However, lifetime data from a collection of pixels inside the cell typically require biexponential decay functions to be well reproduced, thus the values of the single pixel monoexponential fits should be considered with some caution, and rather be expected to reflect trends in the lifetime distribution. Clearly, the Δ enantiomer has a longer apparent lifetime inside the cell than the Λ complex, as seen from the colors in the FLIM image (scale range from 200 ns (blue) to 360 ns (red)). In addition, Λ seems to have a somewhat shorter apparent lifetime in the nucleus compared to in the cytoplasm, although the differences are very small (dark blue color in the nucleus correspond to a somewhat shorter lifetime than in the cytoplasm). However, the Δ complex has the longest apparent lifetime inside the nucleus. Furthermore, the intensity images (Fig. 2 middle) agree with conclusions from confocal microscopy - that the intensity profiles for the two enantiomers differ, with Δ more intense in the nucleus (red color) and Λ more intense in the cytoplasm, although intracellular structures are somewhat blurred since both lifetime and intensity images are produced using wide field rather than confocal imaging.
Figure 2.
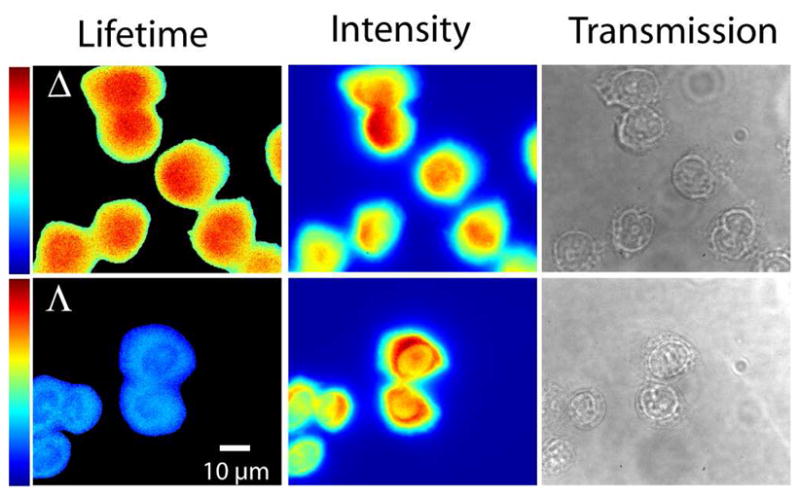
False color fluorescence lifetime images (left), emission intensity images (middle) and transmission images (right) of Δ- and Λ-D4 in fixed CHO-K1 cells showing the enantiospecific difference in apparent intracellular lifetime as well as their different lifetime distributions. FLIM color bars: 200–360 ns.
Figure 3 (left) shows Δ- and Λ-D4 bound to the plasma membrane of live CHO-K1 cells where the false color image reflects the apparent lifetime of the complexes. After a few minutes of illumination by a light-emitting diode (LED) at 405 nm, membrane-bound ruthenium complex induce photodamage and membrane permeabilization, resulting in accumulation of extracellular complex inside the cell, a process referred to as photoactivated uptake.9 After uptake, the emission intensity increases and both lifetime (middle) and the emission intensity images (right) become similar to what is seen in fixed cells (Fig. 2) but with slightly shorter lifetimes in general (color bars are 75–250 ns). It can be clearly seen from a comparison of the lifetime and intensity images (middle and right) that for Δ the strongest emission intensity is co-localized with the longest lifetimes. In contrast to Δ, Λ displays the strongest emission intensity outside the nucleus whereas the apparent lifetime is slightly longer in the nucleus than in the cytoplasm. (For analysis of lifetime and emission intensity throughout the cell, see Supporting Information, Fig. S1.) This staining pattern is somewhat different from what is observed for Λ in fixed cells where complex localized in the cytoplasm possess both the longest lifetime and the brightest emission, thus indicating that the complexes experience different microenvironments in the two cases (Supporting Information, Fig. S2). It should be noted that both fixation and photoactivated uptake may affect intracellular structures, however, these results point to the fact that the Λ enantiomers sense subtle differences that can be probed by FLIM, which are not observed by emission intensity imaging. CLSM show similar intensity staining patterns for the two enantiomers in cells after photoactivated uptake compared to their staining of methanol fixed cells (Supporting Information, Fig. S3).
Figure 3.
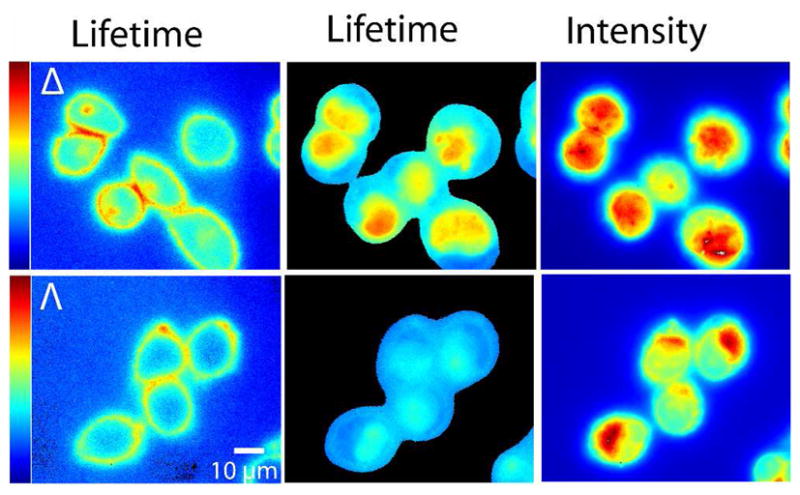
False color fluorescence lifetime images of membrane bound Δ- and Λ-D4 in live CHO-K1 cells before (left) and after (middle) photoactivated uptake. The fluorescence intensity images (right) correspond to the lifetime images after uptake. FLIM color bars 75–250 ns.
Lifetimes for the two enantiomers, when bound to the plasma membrane of live cells, in the nucleus of methanol fixed cells and in cells after photoactivated uptake are presented in Table 2. Both enantiomers show similar apparent lifetimes in the plasma membrane that correspond well with those measured in lipid vesicles. Comparing fixed and photopermeabilized cells the lifetimes are somewhat longer and the fractions of the long lifetime component are larger in the former, which may reflect that fixation results in alteration of the microenvironment probed by the complexes, when bound to certain biomolecular structures (or a certain biomolecular structure). Residual methanol from the fixation procedure that decreases the water content and prolongs the lifetimes is a plausible explanation. In the nucleus, the Δ enantiomers have somewhat longer lifetime than Λ, but this difference is surprisingly small considering their diverse lifetimes when bound to pure DNA in solution (see Table 1). The lifetimes in the nucleus fall in between those calculated for the two enantiomers in isolated DNA. Interestingly, the lifetime for Λ is longer than observed in any of the pure microenvironments. One possible explanation is that a small fraction of Λ is bound in an environment that results in unusually long lifetimes, while for Δ this lifetime increase in not observed, since the lifetime of this enantiomer is already close to the maximum value observed in aprotic solvents.
Table 2.
Emission decay parameters for Δ- and Λ-D4 (5 μM) measured by FLIM in CHO-K1 cells.
| Δ enantiomer | Λ enantiomer | |||||||||
|---|---|---|---|---|---|---|---|---|---|---|
| τ1 (ns) | τ2 (ns) | α2, f2 | χ2 | τ̄ (ns) | τ1 (ns) | τ2 (ns) | α2, f2 | χ2 | τ̄ (ns) | |
| Plasma membrane | 33 | 456 | 0.16, 0.72 | 7 | 101 | 50 | 474 | 0.18, 0.68 | 7 | 126 |
| Nucleus (fixed) | 80 | 703 | 0.34, 0.82 | 16 | 293 | 73 | 598 | 0.26, 0.74 | 17 | 208 |
| Nucleus (live)a | 69 | 526 | 0.22, 0.68 | 9 | 169 | 61 | 509 | 0.14, 0.58 | 18 | 125 |
After photoactivated uptake.
Generally, the lifetime data for the cell experiments are not perfectly reproduced with a bi-exponential decay function (somewhat high χ2). Indeed, the heterogeneous nature of the cell makes it highly possible that the ruthenium complexes are localized in many different microenvironments and hence a wider distribution of lifetimes should be expected, rather than one or two discrete lifetimes.
The Δ and Λ enantiomers are identical except for their difference in handedness, and since their affinity for the most chiral host, DNA, is very similar, there is no a priori reason to assume a difference in their intracellular localization. The excited state lifetime data further support the claim that their distinct dissimilar cellular staining patterns observed with CLSM is a result only of the higher quantum yield of DNA-bound Δ, and not of differences in biomolecular affinities or intracellular distribution.
In conclusion, we have shown that excited state lifetimes, in addition to intensity imaging, of ruthenium dppz-type complexes can be used to image diastereomeric interactions inside the cell and cell nucleus by multiple-frequency FLIM. The environmentally sensitive lifetimes of these complexes probe their biomolecular binding, giving insight in their microenvironment and in DNA accessibility. The FLIM technique requires much less light than confocal imaging and advantages, such as independence of fluorophore concentration and light intensity, make this technique ideal to gain insight in molecular interactions inside cells. Since the emission intensity and maximum wavelength is known to depend on the microenvironment of these ruthenium dppz complexes,9 continued studies that utilize the possibility of ratiometric analysis should be elaborated in the microscopy setup, and solvatochromic effects should be explored, to fully use the potential of these complexes combined with the FLIM technique. Additionally, FLIM might be used to discriminate complexes bound to proteins from those in lipid membranes in the cytoplasm by means of varying intracellular oxygen concentrations.
Supplementary Material
Acknowledgments
This project was financially supported by the Swedish research council. AGE thanks the European Union (ERC) and the USA National Institutes of Health for support.
Footnotes
Supporting Information Available: Intracellular lifetime distribution analysis with two lifetimes, CLSM of Δ- and Λ-D4 in CHO-K1 cells after photoactivated uptake, and detailed experimental methods. This material is available free of charge via the Internet at http://pubs.acs.org.
Contributor Information
Frida R. Svensson, Email: frida.svensson@chalmers.se.
Maria Abrahamsson, Email: abmaria@chalmers.se.
Niklas Strömberg, Email: niklas.stromberg@sp.se.
Andrew G. Ewing, Email: andrew.ewing@chem.gu.se.
Per Lincoln, Email: lincoln@chalmers.se.
References
- 1.Barton JK, Danishefsky AT, Goldberg JM. Tris(Phenanthroline)Ruthenium(II) - Stereoselectivity in Binding to DNA. J Am Chem Soc. 1984;106:2172–2176. [Google Scholar]
- 2.Brennaman MK, Meyer TJ, Papanikolas JM. [Ru(bpy)2dppz]2+ Light-Switch Mechanism in Protic Solvents as Studied Through Temperature-Dependent Lifetime Measurements. J Phys Chem A. 2004;108:9938–9944. [Google Scholar]
- 3.Coates CG, Olofsson J, Coletti M, McGarvey JJ, Önfelt B, Lincoln P, Nordén B, Tuite E, Matousek P, Parker AW. Picosecond Time-Resolved Resonance Raman Probing of the Light-Switch States of [Ru(Phen)2dppz]2+ J Phys Chem B. 2001;105:12653–12664. [Google Scholar]
- 4.Fernandez-Moreira V, Thorp-Greenwood FL, Coogan MP. Application of d6 Transition Metal Complexes in Fluorescence Cell Imaging. Chem Commun. 2010;46:186–202. doi: 10.1039/b917757d. [DOI] [PubMed] [Google Scholar]
- 5.Jenkins Y, Friedman AE, Turro NJ, Barton JK. Characterization of Dipyridophenazine Complexes of Ruthenium(II) - the Light Switch Effect as a Function of Nucleic-Acid Sequence and Conformation. Biochemistry. 1992;31:10809–10816. doi: 10.1021/bi00159a023. [DOI] [PubMed] [Google Scholar]
- 6.Olofsson J, Önfelt B, Lincoln P. Three-State Light Switch of [Ru(phen)2dppz]2+: Distinct Excited-State Species with Two, One, or No Hydrogen Bonds From Solvent. J Phys Chem A. 2004;108:4391–4398. [Google Scholar]
- 7.Önfelt B, Olofsson J, Lincoln P, Nordén B. Picosecond and Steady-State Emission of [Ru(phen)2dppz]2+ in Glycerol: Anomalous Temperature Dependence. J Phys Chem A. 2003;107:1000–1009. [Google Scholar]
- 8.Rajendiran V, Palaniandavar M, Periasamy VS, Akbarsha MA. [Ru(phen)2(dppz)]2+ as an Efficient Optical Probe for Staining Nuclear Components. J Inorg Biochem. 2010;104:217–220. doi: 10.1016/j.jinorgbio.2009.10.018. [DOI] [PubMed] [Google Scholar]
- 9.Svensson FR, Matson M, Li M, Lincoln P. Lipophilic ruthenium complexes with tuned cell membrane affinity and photoactivated uptake. Biophysical chemistry. 2010;149:102–106. doi: 10.1016/j.bpc.2010.04.006. [DOI] [PubMed] [Google Scholar]
- 10.Vos JG, Kelly JM. Ruthenium Polypyridyl Chemistry; From Basic Research to Applications and Back Again. Dalton Trans. 2006;41:4869–4883. doi: 10.1039/b606490f. [DOI] [PubMed] [Google Scholar]
- 11.Lincoln P, Broo A, Nordén B. Diastereomeric DNA-Binding Geometries of Intercalated Ruthenium(II) Trischelates Probed by Linear Dichroism: [Ru(phen)2dppz]2+ and [Ru(phen)2bdppz]2+ J Am Chem Soc. 1996;118:2644–2653. [Google Scholar]
- 12.Barton JK, Basile LA, Danishefsky A, Alexandrescu A. Chiral Probes for the Handedness of DNA Helices: Enantiomers of Tris(4,7-diphenylphenanthroline)ruthenium(II) Proc Natl Acad Sci USA. 1984;81:1961–1965. doi: 10.1073/pnas.81.7.1961. [DOI] [PMC free article] [PubMed] [Google Scholar]
- 13.Hartshorn RM, Barton JK. Novel Dipyridophenazine Complexes of Ruthenium(II) - Exploring Luminescent Reporters of DNA. J Am Chem Soc. 1992;114:5919–5925. [Google Scholar]
- 14.Hiort C, Lincoln P, Norden B. DNA-Binding of Delta-[Ru(Phen)2dppz]2+ and Lambda-[Ru(Phen)2dppz]2+ J Am Chem Soc. 1993;115:3448–3454. [Google Scholar]
- 15.Lincoln P, Nordén B. DNA Binding Geometries of Ruthenium(II) Complexes with 1,10-Phenanthroline and 2,2 ′-Bipyridine Ligands Studied with Linear Dichroism Spectroscopy. Borderline Cases Of Intercalation. J Phys Chem B. 1998;102:9583–9594. [Google Scholar]
- 16.O’Connor NA, Stevens N, Samaroo D, Solomon MR, Marti AA, Dyer J, Vishwasrao H, Akins DL, Kandel ER, Turro NJ. A Covalently Linked Phenanthridine- Ruthenium(II) Complex as a RNA Probe. Chem Commun. 2009;19:2640–2642. doi: 10.1039/b900290a. [DOI] [PubMed] [Google Scholar]
- 17.Xu H, Liang Y, Zhang P, Du F, Zhou BR, Wu J, Liu JH, Liu ZG, Ji LN. Biophysical Studies of a Ruthenium(II) Polypyridyl Complex Binding to DNA and RNA Prove that Nucleic Acid Structure has Significant Effects on Binding Behaviors. J Biol Inorg Chem. 2005;10:529–538. doi: 10.1007/s00775-005-0007-3. [DOI] [PMC free article] [PubMed] [Google Scholar]
- 18.Ardhammar M, Lincoln P, Nordén B. Ligand Substituents of ruthenium Dipyridophenazine Complexes Sensitively Determine Orientation in Liposome Membrane. J Phys Chem B. 2001;105:11363–11368. [Google Scholar]
- 19.Guo XQ, Castellano FN, Li L, Lakowicz JR. A Long-Lifetime Ru(II) Metal-Ligand Complex as a Membrane Probe. Biophys Chem. 1998;71:51–62. doi: 10.1016/s0301-4622(97)00135-x. [DOI] [PubMed] [Google Scholar]
- 20.Svensson FR, Li M, Norden B, Lincoln P. Luminescent Dipyridophenazine-Ruthenium Probes for Liposome Membranes. J Phys Chem B. 2008;112:10969–10975. doi: 10.1021/jp803964x. [DOI] [PubMed] [Google Scholar]
- 21.Zava O, Zakeeruddin SM, Danelon C, Vogel H, Gratzel M, Dyson PJ. A Cytotoxic Ruthenium Tris(bipyridyl) Complex that Accumulates at Plasma Membranes. ChemBioChem. 2009;10:1796–1800. doi: 10.1002/cbic.200900013. [DOI] [PubMed] [Google Scholar]
- 22.Lakowicz JR. Principles of Fluorescence Spectroscopy. 3. Springer; Singapore: 2006. [Google Scholar]
- 23.Neugebauer U, Pellegrin Y, Devocelle M, Forster RJ, Signac W, Morand N, Keyes TE. Ruthenium Polypyridyl Peptide Conjugates: Membrane Permeable Probes for Cellular Imaging. Chem Commun. 2008:5307–5309. doi: 10.1039/b810403d. [DOI] [PubMed] [Google Scholar]
- 24.Sud D, Zhong W, Beer DG, Mycek MA. Time-Resolved Optical Imaging Provides a Molecular Snapshot of Altered Metabolic Function in Living Human Cancer Cell Models. Opt Express. 2006;14:4412–4426. doi: 10.1364/oe.14.004412. [DOI] [PubMed] [Google Scholar]
- 25.Zhong W, Urayama P, Mycek MA. Imaging Fluorescence Lifetime Modulation of a Ruthenium-Based Dye in Living cells: the Potential for Oxygen Sensing. J Phys D-Appl Phys. 2003;36:1689–1695. [Google Scholar]
- 26.Piszczek G. Luminescent Metal-ligand Complexes as Probes of Macromolecular Interactions and Biopolymer Dynamics. Arch Biochem Biophys. 2006;453:54–62. doi: 10.1016/j.abb.2006.03.007. [DOI] [PubMed] [Google Scholar]
- 27.Puckett CA, Barton JK. Mechanism of Cellular Uptake of a Ruthenium Polypyridyl Complex. Biochemistry. 2008;47:11711–11716. doi: 10.1021/bi800856t. [DOI] [PMC free article] [PubMed] [Google Scholar]
- 28.Marquardt DW. An Algorithm for Least-Squares Estimation of Nonlinear Parameters. J Soc Ind Appl Math. 1963;11:431–441. [Google Scholar]
- 29.Olofsson J, Wilhelmsson LM, Lincoln P. Effects of Methyl Substitution on Radiative and Solvent Quenching Rate Constants of [Ru(phen)2dppz]2+ in Polyol Solvents and Bound to DNA. J Am Chem Soc. 2004;126:15458–15465. doi: 10.1021/ja047166a. [DOI] [PubMed] [Google Scholar]
Associated Data
This section collects any data citations, data availability statements, or supplementary materials included in this article.