Abstract
Spectroscopic ellipsometry was used to characterize the optical properties of thin (<5 nm) films of nanostructured titanium dioxide (TiO2). These films were then used to investigate the dynamic adsorption of bovine serum albumin (BSA, a model protein), as a function of protein concentration, pH, and ionic strength. Experimental results were analyzed by an optical model and revealed that hydrophobic interactions were the main driving force behind the adsorption process, resulting in up to 3.5 mg/m2 of albumin adsorbed to nanostructured TiO2. The measured thickness of the adsorbed BSA layer (less than 4 nm) supports the possibility that spreading of the protein molecules on the material surface occurred. Conformational changes of adsorbed proteins are important because they may subsequently lead to either accessibility or inaccessibility of bioactive sites which are ligands for cell interaction and function relevant to physiology and pathology.
Keywords: Nanomaterials, protein adsorption, spectroscopic ellipsometry, titanium dioxide, bovine serum albumin
Introduction
Interaction of proteins and cells with biomaterials dictates the clinical success of implant devices. Depending on the specific application, such interactions may be desirable or not. For example, in the case of orthopaedic and dental implants (where implant integration in bone is the desirable outcome), interaction of proteins that mediate subsequent functions of osteoblasts pertinent to new bone tissue formation are needed [1]. In the case of cardiovascular implants, adsorption of fibrinogen induces activation of platelets and of the blood coagulation cascade; these events lead to blood coagulation, a major complication of vascular prostheses [2]. In such cases, adsorption of albumin (the most abundant protein in blood plasma) “passivates” the surface of biomaterials and prevents platelet adhesion and activation [3]. The type, concentration, distribution, and conformation of proteins on material substrates are key parameters of the mechanisms underlying subsequent cell interactions.
For these reasons, research efforts have focused on elucidating the mechanisms that govern protein interactions with various biomaterials including polymers [4–6], metals [7–9], and ceramics [10–12]. Various strategies have been proposed and used to describe protein adsorption in thermodynamic, molecular and experimental terms [13, 14]. One of the most recent developments is the Biomolecular Adsorption Database [15], which is a free, online interactive program that has combined and organized published data regarding protein adsorption under various experimental conditions. This database allows users to predict the amount of protein adsorbed as a function of solution pH, protein concentration, ionic strength, and hydrophobicity of the material surface.
A recent development of great promise proved to be nanostructured formulations which, compared to their respective conventional counterparts (that is, micrometer-size surface features), promoted functions (such as adhesion [16], proliferation [17], etc.) of select cells (for example, osteoblasts versus fibroblasts). To date, few studies have investigated the interactions of proteins with nanostructured materials such as TiO2 [18, 19], ceramics [20], hydroxyapatite [21], diamond [22], and carbon nanotubes [23–26]. Adsorption of various proteins, specifically albumin, laminin, fibronectin, vitronectin and denatured collagen from single component solutions on nanostructured ceramics (specifically, titania, alumina and hydroxyapatite) was compared to that obtained on the respective conventional substrates [16, 17, 27]. The results of these studies revealed differences in the type of protein interacting with the substrates tested and provided insight into the observed differences in the subsequent adhesion of mammalian cells (specifically, rat calvarial osteoblasts, rat foreskin fibroblasts and bovine artery endothelial cells [17, 27, 28]). Investigations of protein adsorption as a function of solution parameters (such as concentration, pH, and ionic strength, which are known to affect protein adsorption on material substrates), however, were outside the scope of the aforementioned studies.
Among the techniques used to investigate protein interactions with material substrates spectroscopic ellipsometry offers distinct advantages: it can provide information regarding the microstructure of the substrate, the protein adsorption processes, and the conformation of the adsorbed protein layer [29, 30]. In addition, ellipsometry allows conducting experiments under aqueous conditions and collecting protein adsorption data in a dynamic mode [29].
Ellipsometry is an optical technique that measures changes in the reflectance and phase difference between the parallel (RP) and perpendicular (RS) components of a polarized light beam upon reflection from a material surface. Using Equation 1,
| Equation 1 |
the intensity ratio of RP and RS can be related to the amplitude ratio (ψ) and the phase difference (Δ) between the two components of polarized light [31]. Because ellipsometry measures the ratio of two values originated by the same signal, the data collected are highly accurate and reproducible. Most importantly, the changes in polarization measured by ellipsometry are extremely sensitive to the thickness (down to the monolayer level), microstructure, and optical constants of adsorbed protein films.
For the aforementioned reasons, ellipsometry was chosen as the main characterization technique in the present study to investigate the “real-time” adsorption of bovine serum albumin (BSA), a model protein, to nanostructured TiO2. Several fabrication techniques were used to prepare the substrates tested; the resulting topography of the substrate surfaces as well as the compatibility with ellipsometry were compared and evaluated. Then, the nanostructured substrates were characterized, and used for the albumin adsorption experiments.
Materials and Methods
Reagents
All chemicals were analytical reagent grade and used as received. Citric acid was purchased from Sigma-Aldrich (St. Louis, MO) and was used in conjunction with 18 MΩ-cm water (NANOpure Diamond, Barnstead; Dubuque, Iowa) to prepare a 10 mM citrate buffer which was stored at 4 °C for no longer than seven days. Citrate (pKa1=3.13, pKa2=4.76, and pKa3=6.40) was selected as the buffer system because it provides a means to control the pH of the solution in the pH range selected for the experiments (specifically, pH=3.55, pH=4.60, pH=5.60, and pH=7.51). The pH of the solutions was adjusted using 1 M NaOH (Fisher Scientific; Pittsburg, PA), and the ionic strength of the buffer was adjusted by adding NaCl (Mallinckrodt; Hazelwood, MO).
Selected Protein
Bovine serum albumin is a “soft” [32, 33] globular protein with an isoelectric point (IEP) of 4.6 [34], approximate molecular dimensions of 4×4×14 nm, and a molecular weight of 66.5 KDa [35]. Besides the abundance and physiological functions of albumin (control of osmotic pressure, buffer, and transport), there is rich literature supporting its use as a model system to study adsorption to solid surfaces. The bovine serum albumin (BSA, Fraction V) used in the present study was purchased from Fisher Scientific (Pittsburg, PA) and stored at −4 °C until used in experiments. Protein solutions were freshly prepared by dissolving a known amount of the protein in citrate buffer and used the day of each experiment.
Substrates
Either silicon (Si/SiO2) or titania-coated silicon surfaces (Si/SiO2/TiO2) were used for the present studies. In both cases, <111> silicon wafers (Sumco, Phoenix, AZ) were first cut into strips (1 cm × 3 cm) following the crystallographic plane of the wafer, cleaned in a 1:1 H2SO4:H2O2 solution, thoroughly rinsed with deionized water, and dried in a convective oven in air at 60 °C. In all cases, the thickness of the native layer of silica (SiO2) was measured by ellipsometry (spectroscopic scan in the 300 nm – 900 nm range). Titania-coated surfaces (Si/SiO2/TiO2) were prepared by depositing thin films of nanostructured TiO2 using a sol-gel technique adapted from literature reports [36, 37]. Briefly, a sol-gel was prepared by mixing one volume of titanium isopropoxide (Sigma-Aldrich, St. Louis, MO) with nine volumes of absolute ethanol (Sigma-Aldrich, St. Louis, MO) and 0.1 volumes of glacial acetic acid (EM Science; Lawrence, KS). Dry strips of Si/SiO2 wafers were then sequentially immersed in the sol-gel solution for one minute, sonicated in an acetone bath for five minutes, allowed to dry at ambient conditions for one hour, and finally heat-treated in a 550 °C furnace (Thermo Scientific; Dubuque, IA) for 30 minutes. Atomic force microscopy (Nanoscope IIIa, Digital Instruments) was used to verify the presence of TiO2 films on the surface of the Si/SiO2 substrates and to estimate the thickness of the TiO2 layer.
Spectroscopic ellipsometry
The substrate characterization as well as the dynamic protein adsorption experiments were performed at room temperature using a variable angle spectroscopic ellipsometer (VASE, J.A. Woollam Co; Lincoln, NE). This ellipsometer system consisted of a monochromator and light source, an input unit (to manipulate the state of the light beam incident upon the sample), a detector unit, and an analyzer connected to a personal computer. A goniometer base connected the input and detector units to the sample stage and was used to control the angle of incidence between the sample and the light beam. Spectroscopic ellipsometry was chosen because it has proven suitable to study adsorption of proteins, and provides useful information about the optical constants and structure of the adsorbed protein film [29, 38–41].
Dynamic adsorption experiments were performed in a commercial electrochemical cell (J.A. Woollam Co; Lincoln, NE) mounted directly on the vertical base of the ellipsometer [42]. In order to control the protein supply to the material substrate tested, the cell was modified by fixing a L-shaped stainless-steel tube (R = 0.254 mm) to the cell. One end of the tube faced the substrate at the same spot where the incident light beam hits the surface at a distance of 1.27 mm. The other end of the tube was connected to a peristaltic pump (Minipuls3, Gilson; Middleton, WI; flow rate = 1.77 mL/min) and a 2-way valve (V100D, Upchurch Scientific; Oak Arbor, WA) to enable rapid switching between the background electrolyte and the solution containing BSA. These modifications provided control of the hydrodynamic conditions as well as the flux of protein to the titania surface. Although characterization of the flow cell was outside the scope of the present manuscript, the experimental setup is an alternative to the ones used by either Arwin [29, 43] or Logothetidis [44] and enables performing adsorption experiments under stagnation-point conditions.
The titania-coated substrates were initially characterized in air, varying the incident angle between 60° and 70° (with respect to the substrate), and the wavelength between 400 nm and 900 nm. Dynamic protein adsorption experiments were performed by following the variation of Ψ and Δ as a function of time at 400, 550, 700, and 850 nm, at an angle of incidence of 70 ° (as defined by the inlet/outlet of the UV fused-silica windows), and using water as the ambient medium. This procedure allowed verification of the thickness of each substrate, thus improving the accuracy of the optical model. The experiment was then initiated by pumping background electrolyte through the cell (for ~5 min) to establish the baseline. Next, the valve was switched, protein solution was introduced, and the adsorption process started. An initial fast adsorption process, followed by a slower one was always observed. When no significant change in the signal was observed (usually within one hour), the dynamic scan (using 4 wavelengths) was stopped and a more accurate spectroscopic scan was collected in the 400–900 nm range (using 10 nm steps). These data were used to verify the thickness of the protein layer adsorbed to the Si/SiO2/TiO2 substrate. Experiments were performed using six different BSA concentrations (0.001, 0.005, 0.01, 0.05, 0.1, and 1 mg ml−1), four pH values (3.55, 4.60, 5.60, and 7.51), and three different ionic strengths (10 mM citrate, 10 mM citrate with 20 mM NaCl, and 10 mM citrate with 100 mM NaCl). The collected data were used to calculate the initial adsorption rate (dΓ/dt t→0) and the saturation amount (ΓSAT) under the experimental conditions tested in the present study.
Optical Model and Data Analysis
In all cases, the collected data (amplitude ratio (Ψ) and phase difference (Δ) as function of either wavelength or time) were modeled using the WVASE software package (J.A. Woollam Co; Lincoln, NE). Differences between the experimental and model-generated data were assessed by the mean square error (MSE) using Equation 2,
| Equation 2 |
where N is the number of Ψ and Δ pairs used in the measurement, M is the number of parameters varied in the regression analysis, and σ is the standard deviation of the experimental data points. Although smaller MSE values indicate better fittings, MSE < 15 are typically acceptable [45, 46].
Results
Characterization of TiO2 Thin Films
The thickness of the nanostructured TiO2 films produced was determined using atomic force microscopy (AFM). As illustrated in Figure 1, the chosen technique resulted in the formation of a uniform film of TiO2 with grain size and thickness of 18 nm and less than 5 nm, respectively. These results were used to develop an optical model to interpret the ellipsometric measurements. An additional advantage of the chosen sol-gel method over dip-coating [47] or electrophoresis [48] was that the possibility of preparing transparent samples suitable for ellipsometry without the instrument requirements of other techniques such as chemical vapor deposition [49] or direct-current reactive magnetron sputtering [50]. It is also worth noting that films prepared by depositing either TiO2 nanoparticles or colloidal TiO2, rendered substrates surfaces highly dispersive and thus unsuitable for ellipsometry.
Figure 1.
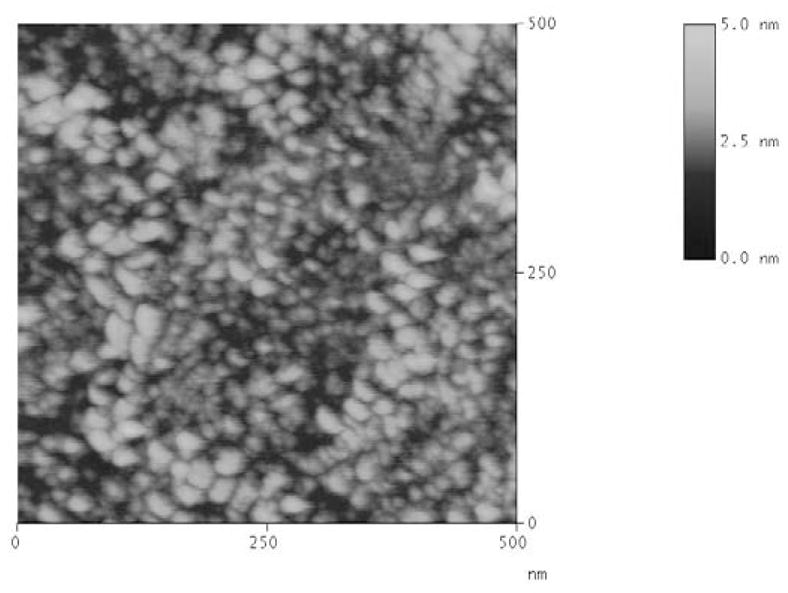
AFM image of a representative thin film of TiO2 deposited on a Si/SiO2 wafer.
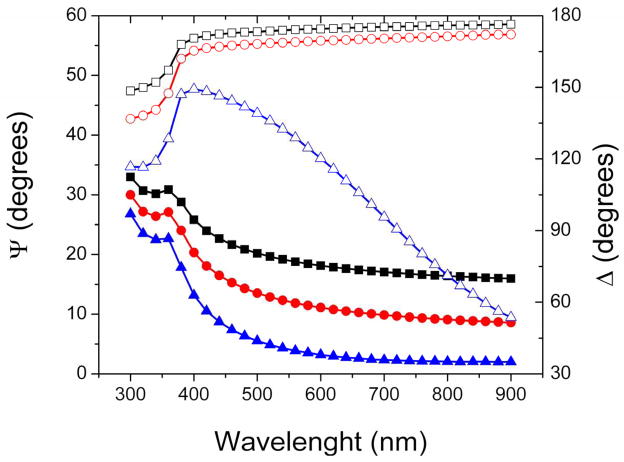
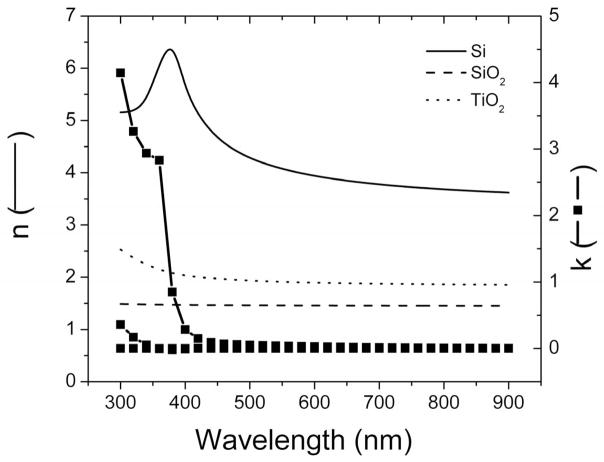
In order to develop an optical model that describes the substrate microstructure in terms of the refractive index (n), extinction coefficient (k), and thickness (d), these TiO2 substrates where initially characterized as function of incident angle and wavelength in air using spectroscopic ellipsometry (data points in Figure 2A). These data was used to calculate the optical constants of the TiO2 nanostructured films produced (Figure 2B). The refractive index (n) and extinction coefficient (k) did not change significantly in the region from 500 to 900 nm. For wavelength values less than 500 nm, the reflective index and extinction coefficient gradually increased with decreasing wavelength and sharply increased at wavelength less than 350 nm. This wavelength threshold, which corresponds to a band-gap of approximately 3.3 eV, suggests that the nanostructured films produced were crystalline in nature with anatase structure [36, 51].
Figure 2.
(A) Spectroscopic scans measured (points) and calculated with the optical model (lines) corresponding to a Si/SiO2 substrate coated with a layer of nanostructured TiO2 (1.69 ± 0.01 nm, MSE = 4). Ψ and Δ values are represented with solid and open symbols, respectively. Angle of incidence: 65° (■ and □), 70° (● and ○), and 75° (▲ and △). (B) Optical constants corresponding to the nanostructured TiO2 thin film, calculated from ellipsometry experimental data. Other conditions are described in the Materials and Methods section.
Using the information collected from the AFM images and the spectroscopic scans collected by ellipsometry, an optical model consisting of a series of layers with the optical axis parallel to the Si/SiO2/TiO2 substrate was proposed to describe the dielectric functions of the substrates. The model (schematically illustrated in Figure 3A) composed of a layer of Si (bulk; d=1 mm), a layer of SiO2 (d=2.5 ± 0.5 nm), and a layer of nanostructured TiO2. For the latter, optical constants of bulk TiO2 were used. As can be observed in Figure 2A, the agreement between the experimental (data points) and the model-generated data (lines) was very good (MSE < 5), supporting the use of the chosen optical model. As different models can be used to describe the optical properties of the substrate, it is worth noting that the use of Cauchy, Bruggeman effective medium approximation (EMA, with different % of void space) or Tauc-Lorentz models did not yield significant improvements in the MSE value. It is also worth noting that an ambient layer (H2O) was also included in the optical model to account for the buffer when the liquid cell was used (for simplicity this layer was omitted in Figure 3A and B).
Figure 3.

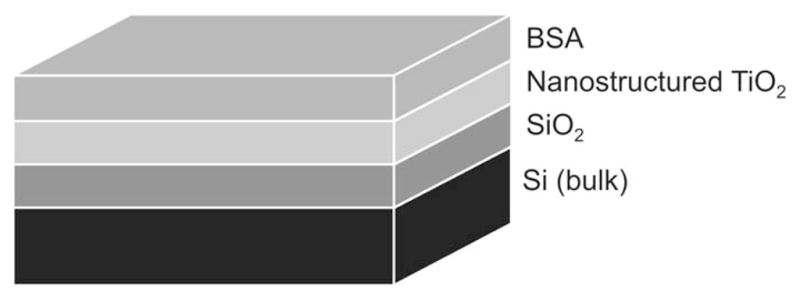
Schematic illustration (not to scale) of (A) the optical model used to characterize the nanostructured TiO2 thin film and of (B) the optical model used to characterize the layer of protein adsorbed to the nanostructured TiO2 thin film. The ambient layer (air or buffer) was omitted.
To represent the adsorbed proteins, a fourth layer, was added to the optical model (Figure 3B). This layer was represented by a non-absorbing layer according to the Cauchy model using Equation 3,
| Equation 3 |
where n is the index of refraction, λ represents wavelength in microns, and A, B, and C are computer-generated values obtained by fitting the optical model to the experimental data. Under the experimental conditions of the present study, the protein layer thickness (d) was used to determine the amount of the adsorbed protein, Γ (mg/m2) using Equation 4,
| Equation 4 |
where n and n0 are the refractive index of the protein and the ambient solution, respectively [52]. In accordance with literature reports, the refractive index increment for the molecules in the layer (dn/dc) was assumed to be 0.18 cm3 g−1 [4, 53].
Adsorption of BSA to Nanostructured TiO2 Films
Spectroscopic ellipsometry was used to study of the dynamic adsorption of BSA to nanostructured TiO2 thin-films as a function of various parameters, specifically protein concentration in aqueous solution, pH, and ionic strength.
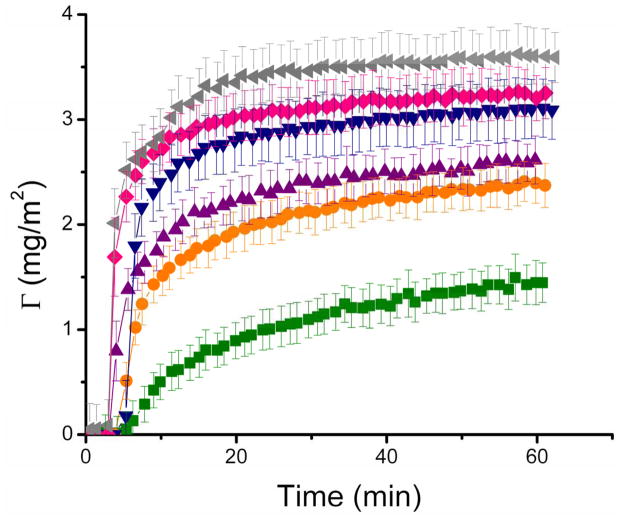
The effect of protein concentration on the amount of adsorbed BSA (Γ) onto the nanostructured TiO2 surfaces was evaluated in “real-time”; the results are graphically presented in Figure 4. Both the amount of adsorbed BSA and the initial adsorption rate increased as function of protein concentration. By representing the saturation amounts (ΓSAT, derived from the steady-state values of the Γ(t) curves in Figure 4) as functions of the respective BSA concentrations, the adsorption isotherm was obtained (data not shown). In that case, a curve with an abrupt initial slope and a single plateau was obtained, indicating that an adsorbent was deposited in a single layer, with high affinity for the TiO2 surface. Further analysis of the data in Figure 4 revealed that the initial protein adsorption rate increased linearly with the concentration of BSA in solution, until a plateau (2.1 mg min−1 m−2) was reached at approximately 0.1 mg/mL.
Figure 4.
Time course of adsorption of different concentrations of BSA, specifically, 0.001 mg ml−1 (■), 0.005 mg ml−1(●), 0.01 mg ml−1 (▲), 0.05 mg ml−1, (▼), 0.1 mg ml−1 (◆), and 1 mg ml−1 (◀) to nanostructured TiO2 thin film. Other conditions are described in the Materials and Methods section.
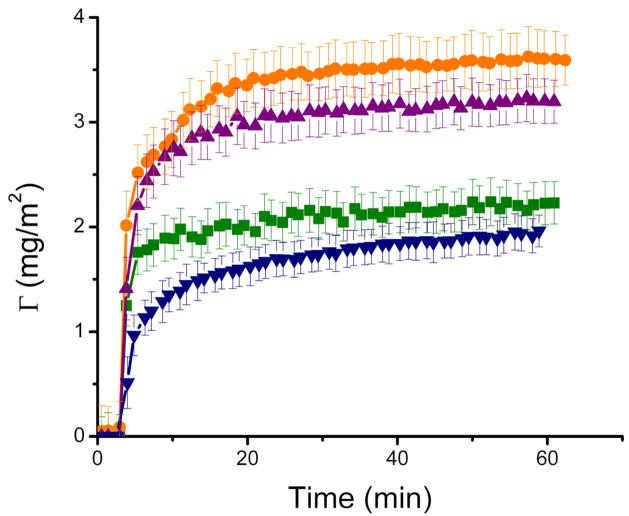
The amount of BSA adsorbed on the nanostructured TiO2 as a function of time and in response to changes in the pH of the buffer solution was also determined using spectroscopic ellipsometry. For these experiments, four pH values were selected considering the isoelectric point of the substrate (IEPTiO2 = 6) and of the protein (IEPBSA = 4.6). As shown in Table 1, the range of pH values used enabled the evaluation of the electrostatic and hydrophobic interactions between the protein and the material surface and between adsorbed proteins. As shown in Figure 5, altering the charge of BSA by changing the pH of the buffer affected protein adsorption to the nanostructured TiO2 substrates. In agreement with previous reports [8, 25, 34, 53, 54], the amount of protein adsorbed was highest at the isoelectric point of BSA (specifically, 4.6). Similarly, the initial rate of BSA adsorption to the surface of the substrate was fastest at the isoelectric point of BSA and decreased as the pH of the solution moved further away from the isoelectric point of the protein. In order to probe the effects of electrostatic interactions on the adsorption process, the ionic strength of the buffer was varied by adding NaCl to the citrate buffer used for the protein adsorption experiments. Addition of either 20 mM or 100 mM NaCl did not affect either the total amount of protein adsorbed to the TiO2 substrates or the kinetics of that interaction (data not shown).
Table 1.
Charge and ΓSAT as function of pH for BSA and TiO2.
| pH | 3.55 | 4.60 | 5.60 | 7.51 |
|---|---|---|---|---|
| Charge of BSA | + | 0 | − | − |
| Charge of TiO2 | + | + | + | − |
| Γ SAT (mg m−2) | 2.2 ± 0.1 | 3.6 ± 0.1 | 3.2 ± 0.1 | 1.9 ± 0.1 |
Figure 5.
Time course of adsorption of BSA (1 mg ml−1) to nanostructured TiO2 thin film at different pH values: 3.55 (■), 4.60 (●), 5.60 (▲), and 7.51 (▼). Other conditions are described in the Materials and Methods section.
Discussion
The present study utilized spectroscopic ellipsometry to investigate the dimensions of TiO2 thin (<5 nm) films deposited on Si/SiO2 substrates and to monitor in situ the dynamic adsorption of BSA (a model protein) to nanostructured surfaces. Ellipsometry is a reliable and powerful technique that has proven suitable for the characterization of various materials [30, 38, 45, 52, 55–61] and for the investigation of the dynamics of protein interactions [62–67]. However, none of these literature reports have specifically addressed the dynamic adsorption of albumin to nanostructured TiO2 as a function of protein concentration, pH, and ionic strength.
The results of the present study provided insights into the amount of BSA adsorbed to nanostructured TiO2 thin films and of the arrangement of the adsorbed molecules on that surface. The highest amount of BSA (approximately 3.6 mg m−2) was adsorbed when the pH of the buffer solution was at the isoelectric point of the protein. This observation is in agreement with the fact that, due to minimal charge interactions and structural rearrangements of the adsorbing molecules, proteins exhibit increased adsorption at, or near, their isoelectric point [32, 33, 68]. Although some exceptions have been reported in the scientific literature, most protein interactions with material surfaces are driven by a combination of hydrophobic and electrostatic interactions. As shown in Figure 5 (which shows adsorption of BSA onto TiO2 at different pH values) and summarized in Table 1, the importance of hydrophobic interactions is evidenced by the strong adsorption observed even under unfavorable (specifically, pH = 3.55 and pH = 7.51) electrostatic interactions. It is important to note that the maximum amount of BSA adsorbed to nanostructured TiO2 (specifically, 3.6 ± 0.1 mg m−2) occurred when the protein was neutral (pH = 4.6); under these conditions the electrostatic (protein-protein and surface-protein) interactions are minimized. It is also important to note that under favorable (pH = 5.6) surface-protein electrostatic conditions only 3.2 ± 0.1 mg m−2 of BSA were adsorbed to the nanostructured TiO2 substrate. The results of the present study are in agreement with those conducted under different ionic strengths which showed neither significant difference in the adsorption rate nor maximum amount of the adsorbed albumin [69, 70].
In the present study, the calculated amounts of adsorbed BSA on nanostructured TiO2 (Figure 4 and Figure 5) were higher (up to 30%) than those predicted by the Biomolecular Adsorption Database [15]; which assumes smooth substrate surfaces. Consequently, it is reasonable to assume that differences in ΓSAT can be attributed to the topography (nm scale) of the TiO2 substrates. Furthermore, because the changes in ionic strength tested did not render significantly different albumin adsorption profiles (data not shown), it can be concluded that the main driving force for the observed albumin interaction on nanostructured TiO2 were hydrophobic interactions. Although direct comparison is not possible because of differences in experimental conditions, the results of the present study are in agreement with adsorption of BSA to TiO2 electrochemically-grown films on titanium electrodes [53] and to TiO2 colloidal particles [34].
Because the thickness (less than 4 nm) of the adsorbed BSA layer measured by ellipsometry is smaller than the size of the protein molecule (4 × 4 × 14 nm) under all experimental conditions tested, the results of the present study support the possibility that spreading (which affects conformation) of the protein molecules on the material surface can occur. This explanation is in agreement with other reports regarding the adsorption of soft proteins such as albumin (both bovine and human) to titanium dioxide [12, 34, 53] and other material surfaces [14, 32, 33, 62, 71–74]. Conformational changes of proteins adsorbed on material surfaces may change their biofunctional properties; such events are very important because they may subsequently lead to either accessibility or inaccessibility of bioactive sites which are ligands for cell interaction and function relevant to physiology and pathology.
In summary, the present study supports the use of variable angle spectroscopic ellipsometry as a valid technique to study the dynamic adsorption of proteins to nanostructured material surfaces. The optical model and experimental set-up developed and tested could be used to expand the range and capabilities of scientific investigations as well as enrich current knowledge of protein interactions with nanomaterials.
Acknowledgments
This work was supported in part by the Morrison Trust (awarded to R. Bizios and C. D. Garcia), The University of Texas at San Antonio, and by the National Institute of General Medical Sciences (NIGMS), National Institutes of Health (1SC3GM081085 to C. D. Garcia). The authors also acknowledge Dr. Michael Miller at Southwest Research Institute (SwRI) for obtaining the AFM images.
Footnotes
Publisher's Disclaimer: This is a PDF file of an unedited manuscript that has been accepted for publication. As a service to our customers we are providing this early version of the manuscript. The manuscript will undergo copyediting, typesetting, and review of the resulting proof before it is published in its final citable form. Please note that during the production process errors may be discovered which could affect the content, and all legal disclaimers that apply to the journal pertain.
References
- 1.Puleo DA, Nanci A. Biomaterials. 1999;20:2311–2321. doi: 10.1016/s0142-9612(99)00160-x. [DOI] [PubMed] [Google Scholar]
- 2.Gorbet MB, Sefton MVMV. Biomaterials. 2004;25:5681–5703. doi: 10.1016/j.biomaterials.2004.01.023. [DOI] [PubMed] [Google Scholar]
- 3.Amiji MM, Park K. J Biomat Sci. 1993;4:217. doi: 10.1163/156856293x00537. [DOI] [PubMed] [Google Scholar]
- 4.Werner C, Eichhorn KJ, Grundke K, Simon F, Grählert W, Jacobasch HJ. Colloids Surf A. 1999;156:3–17. [Google Scholar]
- 5.Fang F, Satulovsky J, Szleifer I. Biophys J. 2005;89:1516–1533. doi: 10.1529/biophysj.104.055079. [DOI] [PMC free article] [PubMed] [Google Scholar]
- 6.Absolom DR, Zingg W, Neumann AW. J Biomed Mater Res. 1987;21:161–171. doi: 10.1002/jbm.820210202. [DOI] [PubMed] [Google Scholar]
- 7.Rechendorff K, Hovgaard MB, Foss M, Zhdanov VP, Besenbacher F. Langmuir. 2006;22:10885–10888. doi: 10.1021/la0621923. [DOI] [PubMed] [Google Scholar]
- 8.Dolatshahi-Pirouz A, Rechendorff K, Hovgaard MB, Foss M, Chevallier J, Besenbacher F. Colloids Surf B. 2008;66:53–59. doi: 10.1016/j.colsurfb.2008.05.010. [DOI] [PubMed] [Google Scholar]
- 9.Arvidsson S, Askendal A, Tengvall P. Biomaterials. 2007;28:1346–1354. doi: 10.1016/j.biomaterials.2006.11.005. [DOI] [PubMed] [Google Scholar]
- 10.Sousa SR, Bras M, Moradas-Ferreira P, Barbosa M. Langmuir. 1997;23:7046–7054. doi: 10.1021/la062956e. [DOI] [PubMed] [Google Scholar]
- 11.Kurrat R, Prenosil JE, Ramsden JJ. J Colloid Interface Sci. 1997;185:1–8. doi: 10.1006/jcis.1996.4528. [DOI] [PubMed] [Google Scholar]
- 12.Höök F, Vörös J, Rodahl M, Kurrat R, Böni P, Ramsden JJ, Textor M, Spencer ND, Tengvall P, Gold J, Kasemo B. Colloids Surf B. 2002;24:155–170. [Google Scholar]
- 13.Brusatori MA, Van Tassel PR. J Colloid Interface Sci. 1999;219:333–338. doi: 10.1006/jcis.1999.6496. [DOI] [PubMed] [Google Scholar]
- 14.Roach P, Farrar D, Perry CC. J Am Chem Soc. 2005;127:8168–8173. doi: 10.1021/ja042898o. [DOI] [PubMed] [Google Scholar]
- 15.Vasina EN, Paszek E, DVN, Nicolau DV. Lab Chip. 2009;9:891–900. doi: 10.1039/b813475h. [DOI] [PubMed] [Google Scholar]
- 16.Webster TJ, Siegel RW, Bizios R. Biomaterials. 1999;20:1222–1227. doi: 10.1016/s0142-9612(99)00020-4. [DOI] [PubMed] [Google Scholar]
- 17.Webster TJ, Ergun C, Doremus RH, Siegel RW, Bizios R. Biomaterials. 2000;21:1803–1810. doi: 10.1016/s0142-9612(00)00075-2. [DOI] [PubMed] [Google Scholar]
- 18.Cai K, Bossert J, Jandt KD. Colloids Surf B. 2006;49:136–144. doi: 10.1016/j.colsurfb.2006.02.016. [DOI] [PubMed] [Google Scholar]
- 19.Khang D, Lu J, Yao C, Haberstroh KM, Webster TJ. Biomaterials. 2008;29:970–983. doi: 10.1016/j.biomaterials.2007.11.009. [DOI] [PubMed] [Google Scholar]
- 20.Webster TJ, Siegel RW, Bizios R. Biomaterials. 1999;20:1221–1227. doi: 10.1016/s0142-9612(99)00020-4. [DOI] [PubMed] [Google Scholar]
- 21.Iafisco M, Palazzo B, Falini G, DiFoggia M, Bonora S, Nicolis S, Casella L, Roveri N. Langmuir. 2008;24:4924–4930. doi: 10.1021/la703381h. [DOI] [PubMed] [Google Scholar]
- 22.Nguyen TTB, Chang HC, Wu VWK. Diamond Relat Mater. 2007;16:872–876. [Google Scholar]
- 23.Salvador-Morales C, Flahaut E, Sim E, Sloan J, Green MLH, Sim RB. Mol Immunol. 2006;43:193–201. doi: 10.1016/j.molimm.2005.02.006. [DOI] [PubMed] [Google Scholar]
- 24.Khang D, Kim SY, Liu-Snyder P, Palmore GTR, Durbin SM, Webster TJ. Biomaterials. 2007;28:4756–4768. doi: 10.1016/j.biomaterials.2007.07.018. [DOI] [PubMed] [Google Scholar]
- 25.Valenti LE, Fiorito PA, Garcia CD, Giacomelli CE. J Colloid Interface Sci. 2007;307:349–356. doi: 10.1016/j.jcis.2006.11.046. [DOI] [PubMed] [Google Scholar]
- 26.Diaz E, Ordonez S, Vega A. J Colloid Interface Sci. 2007;305:7–16. doi: 10.1016/j.jcis.2006.09.036. [DOI] [PubMed] [Google Scholar]
- 27.Webster TJ, Ergun C, Doremus RH, Siegel RW, Bizios R. J Biomed Mater Res. 2000;51:475–483. doi: 10.1002/1097-4636(20000905)51:3<475::aid-jbm23>3.0.co;2-9. [DOI] [PubMed] [Google Scholar]
- 28.Webster TJ, Schadler LS, Siegel RW, Bizios R. Tissue Eng. 2001;7:291–301. doi: 10.1089/10763270152044152. [DOI] [PubMed] [Google Scholar]
- 29.Arwin H. Thin Solid Films. 1998;313–314:764–774. [Google Scholar]
- 30.Arwin H. Thin Solid Films. 2000;377–378:48–56. [Google Scholar]
- 31.Fujiwara H. Principles and applications. J. Wiley & Sons; West Sussex, England: 2007. Spectroscopic ellipsometry. [Google Scholar]
- 32.Norde W. Driving Forces for Protein Adsorption at Solid Surfaces. In: Malmsten M, editor. Biopolymers at Interfaces. Vol. 110. Marcel Dekker; New York: 2003. [Google Scholar]
- 33.Norde W. Colloids Surf B. 2008;61:1–9. doi: 10.1016/j.colsurfb.2007.09.029. [DOI] [PubMed] [Google Scholar]
- 34.Giacomelli CE, Avena MJ, De Pauli CP. J Colloid Interface Sci. 1997;188:387–395. doi: 10.1006/jcis.1999.6434. [DOI] [PubMed] [Google Scholar]
- 35.McClellan SJ, Franses EI. Colloids Surf B. 2003;30:1–11. [Google Scholar]
- 36.Fan Q, McQuillin B, Ray AK, Turner ML, Seddon AB. J Phys D Appl Phys. 2000:2683. [Google Scholar]
- 37.Chaure NB, Ray AK, Capan R. Semicond Sci Technol. 2005;20:788–792. [Google Scholar]
- 38.Vinnichenko M, Gago R, Huang N, Leng YX, Sun H, Kreissig U, Kulish MP, Maitz MF. Thin Solid Films. 2004;455–456:530–534. [Google Scholar]
- 39.Karlsson LM, Schubert M, Ashkenov N, Arwin H. Thin Solid Films. 2004;455–456:726–730. [Google Scholar]
- 40.Wang X, Wang Y, Xu H, Shan H, Lu JR. J Colloid Interface Sci. 2008;323:18–25. doi: 10.1016/j.jcis.2008.04.024. [DOI] [PubMed] [Google Scholar]
- 41.Lousinian S, Logothetidis S, Laskarakis A, Gioti M. Biomol Eng. 2007;24:107–112. doi: 10.1016/j.bioeng.2006.05.014. [DOI] [PubMed] [Google Scholar]
- 42.Mora MF, Giacomelli CE, Garcia CD. Anal Chem. 2009;81:1016–1022. doi: 10.1021/ac802068n. [DOI] [PMC free article] [PubMed] [Google Scholar]
- 43.Poksinski M, Arwin H. Thin Solid Films. 2004;455–456:716–721. [Google Scholar]
- 44.Lousinian S, Logothetidis S. Microelectron Eng. 2007;84:479–485. [Google Scholar]
- 45.Shrestha RP, Yang D, Irene EA. Thin Solid Films. 2006;500:252–258. [Google Scholar]
- 46.Barnes TM, van de Lagemaat J, Levi D, Rumbles G, Coutts TJ, Weeks CL, Britz DA, Levitsky I, Peltola J, Glatkowski P. Phys Rev B. 2007;75:23541001–22354110. [Google Scholar]
- 47.Jihua Y, David SW, Keith CG, McQuillan AJ. J Appl Phys. 2007;101:023714. [Google Scholar]
- 48.Besra L, Liu M. Prog Mater Sci. 2007;52:1–61. [Google Scholar]
- 49.Vahlas C, Caussat B, Serp P, Angelopoulos GN. Mater Sci Eng R. 2006;53:1–72. [Google Scholar]
- 50.Tanemura S, Miao L, Wunderlich W, Tanemura M, Mori Y, Toh S, Kaneko K. Sci Technol Adv Mater. 2005;6:11–17. [Google Scholar]
- 51.Eiamchai P, Chindaudom P, Pokaipisit A, Limsuwan P. Current Applied Physics. 2009;9:707–712. [Google Scholar]
- 52.De Feijter JA, Benjamins J, Veer FA. Biopolymers. 1978;17:1759–1772. [Google Scholar]
- 53.Giacomelli CE, Esplandiu MJ, Ortiz PI, Avena MJ, De Pauli CP. J Colloid Interface Sci. 1999;218:404–411. doi: 10.1006/jcis.1999.6434. [DOI] [PubMed] [Google Scholar]
- 54.Kopac T, Bozgeyik K, Yener J. Colloids Surf A. 2008;322:19–28. [Google Scholar]
- 55.Claesson PM, Blomberg E, Paulson O, Malmsten M. Colloids and Surfaces A: Physicochemical and Engineering Aspects. 1996;112:131–139. [Google Scholar]
- 56.Fanchini G, Miller S, Parekh BB, Chhowalla M. Nano Lett. 2008;8:2176–2179. doi: 10.1021/nl080563p. [DOI] [PubMed] [Google Scholar]
- 57.Gilliot M, En Naciri A, Johann L, d’Orleans C, Muller D, Stoquert JP, Grob JJ. Appl Surf Sci. 2006;253:389–394. [Google Scholar]
- 58.Wakita K, Abe K, Shim Y, Mamedov N. Thin Solid Films. 2006;499:285–288. [Google Scholar]
- 59.Lu Z, Macdonald DD. Electrochim Acta. 2008;53:7696–7702. [Google Scholar]
- 60.Marinkova D, Bivolarska M, Ahtapodov L, Yotova L, Mateva R, Velinov T. Colloids Surf A. 2008;65:276–280. doi: 10.1016/j.colsurfb.2008.04.014. [DOI] [PubMed] [Google Scholar]
- 61.Santos O, Kosoric J, Hector MP, Anderson P, Lindh L. J Colloid Interface Sci. 2008;318:175–182. doi: 10.1016/j.jcis.2007.11.015. [DOI] [PubMed] [Google Scholar]
- 62.Tsargorodskaya A, Nabok AV, Ray AK. Nanotechnology. 2004:703–709. [Google Scholar]
- 63.Cardenas M, Arnebrant T, Rennie A, Fragneto G, Thomas RK, Lindh L. Biomacromolecules. 2007;8:65–69. doi: 10.1021/bm060492t. [DOI] [PubMed] [Google Scholar]
- 64.Sousa SR, Bras MM, Moradas-Ferreira P, Barbosa MA. Langmuir. 2007;23:7046–7054. doi: 10.1021/la062956e. [DOI] [PubMed] [Google Scholar]
- 65.Logothetidis S, Gioti M, Lousinian S, Fotiadou S. Thin Solid Films. 2005;482:126–132. [Google Scholar]
- 66.Hook F, Kasemo B, Nylander T, Fant C, Sott K, Elwing H. Anal Chem. 2001;73:5796–5804. doi: 10.1021/ac0106501. [DOI] [PubMed] [Google Scholar]
- 67.Bae YM, Oh BK, Lee W, Lee WH, Choi JW. Anal Chem. 2004;76:1799–1803. doi: 10.1021/ac034748m. [DOI] [PubMed] [Google Scholar]
- 68.Norde W. Physical Chenistry of Biological Interfaces. Marcel Dekker; New York: 2000. Proteins at Solid Surfaces. [Google Scholar]
- 69.Al-Shakhshir RH, Regnier FE, White JL, Hem SL. Vaccine. 1995;13:41–44. doi: 10.1016/0264-410x(95)80009-3. [DOI] [PubMed] [Google Scholar]
- 70.Tilton RD, Robertson CR, Gast AP. Langmuir. 2002;7:2710–2718. [Google Scholar]
- 71.Wertz CF, Santore MM. Langmuir. 2001;17:3006–3016. [Google Scholar]
- 72.Sapsford KE, Ligler FS. Biosens Bioelectron. 2004;19:1045–1055. doi: 10.1016/j.bios.2003.10.002. [DOI] [PubMed] [Google Scholar]
- 73.de Vos WM, Biesheuvel PM, de Keizer A, Kleijn JM, Cohen Stuart MA. Langmuir. 2008;24:6575–6584. doi: 10.1021/la8006469. [DOI] [PubMed] [Google Scholar]
- 74.Norde W, Zoungrana T. Biotechnol Appl Biochem. 1998;28:133–143. [PubMed] [Google Scholar]


