Abstract
A protein nanoarray is created when submicro and nano beads, varying in their size and each conjugated with different proteins, self-assemble to specific locations depending on the diameter matching the surface electron beam patterns created. Protein binding is confirmed from the fluorescence attenuation of the beads upon antigen-antibody binding on the bead surface. This method, called size-dependent self-assembly, allows control of the location of each type of bead, and thus, control of the location of multiple proteins. It provides fast multi-component patterning with a high binding resolution, which can be detected using a fluorescent light microscope. This method is developed to be a simple stand-alone tool for analysis of protein interactions. In addition, it has the potential to be used in conjunction with other methods protein analysis methods, such as enzyme-linked immunosorbent assay (ELISA) and atomic force microscopy (AFM).
Keywords: Protein nanoarray, Self-assembly, Gold nanoparticles, Fluorescent beads, Electron beam lithography, Fluorescent attenuation
1. Introduction
Biomolecular arrays with extremely small features open the door for single-particle (protein, virus, and cell) studies in biology [1]. Specifically, protein arrays are a very important tool for investigating protein-ligand interactions; such as protein-protein, antibody-antigen, drug-protein, and biomolecule-protein interactions [2]. Immobilization of the protein while maintaining its functionality is a crucial step in creating a protein array. Proteins are generally immobilized by physical adsorption, covalent binding, or specific affinity interactions [2]. A few techniques have had success in small scale arrays, such as microcontact printing (μCP), microfluidic printing, and dip-pen nanolithography (DPN) [3-5]. Unfortunately, most single-probe methods are limited with respect to scaling (i.e. an array grid in nanometer size) or their ability to directly deposit soft matter (i.e. biomolecules) to a “desired” array grid, two capabilities essential for realizing highly miniaturized biomolecular nanoarrays [6].
The use of atomic force microscopy (AFM) for the patterning and anylsis of proteins has become a popular practice in the field of protein nanoarrays. DPN has started to emerge as one of the most successful demonstration of an AFM use in producing small scale protein arrays [7-9]. Since AFM has the ability to determine protein binding based on many factors, such as Kelvin force probe and interaction force measurements [6,10], both construction and analysis of protein array can be performed with a single instrument (AFM). Even protein nanopatterning on a single DNA molecule has been attempted using DPN [11]. However, the use of AFM for protein array building and analysis requires many tedious setups and callibrations, and potential cross contamination issues.
Self-assembly is another powerful method in the world of protein arrays and biosensors. In many cases, a self-assembled monolayer (SAM) is placed on a surface to enhance the binding of protein or to decrease the chances of protein denaturation or deactivation of binding sites [1,8]. Self-assembly of DNA-tagged aptamer nanostructures has been used as a template to form protein arrays at the nanoscale level [12]. DNA was also used to create a dynamically configurable nanoarray, creating a novel way for multiple biomolecular patterning at the nanometer scale by controlling the release of bound DNA in specific spots electrochemically [13]. Functionalized horseradish peroxidase (HRP) nanotubes and electrochemical control has been used to form different structures as templates for protein nanoarrays [14,15]. Many of these different methods of self-assembly to create protein arrays provide general strategies at proof-of-concept level. In fact, these arrays are generally “random”; thus the followings should be addressed: (1) how to construct a multi-component array (i.e. multiple proteins of different kinds in a single array); (2) how a specific protein can be patterned on a desired grid within the array; (3) limitiations in control and signaling of single molecule binding.
A new method is proposed that alleviates many tedious steps of surface coating and protein binding agents, by combining electron beam lithography (EBL; top down) with electrostatic self-assembly (bottom up) of the beads onto the surface. This method utilizes p-doped (positively charged) silicon wafers and carboxylated beads (negatively charged) for electrostatic self-assembly. These materials are already commercially available and inexpensive to obtain. The beads, varying in their size, self-assemble to specific locations depending on the diameter matching to the surface nanopatterns, thus creating size-dependent self-assembly (SDSA) (Figure 1). This method verifies antibody-antigen binding, down to single molecule detection. Antibodies are bound to nanometer beads of varying size, then SDSA is used to determine where each bead conjugation is placed. After placement, antibody-antigen interactions are initiated and binding is determined by fluorescent signal attenuation of each bound bead, with the use of a fluorescent microscope. Once the initial substrate is fabricated, there is very little preparation time and calibration of expensive instruments. Furthermore, the array analysis can be obtained from common fluorescent microscope imaging. The SDSA technique has the ability to pattern multiple proteins on a desired grid within an array, as well as the ability to reduce the number of protein interactions that is analyzed down to the single molecule level. This protein array also has the potential to be combined with current microfluidic technologies to create highly sensitive biosensors, as well as the ability to be utilized by other protein analysis methods, such as AFM [16,17]. This new method for protein array fabrication has the potential to become the leading method for high-resolution protein array construction.
Figure 1.
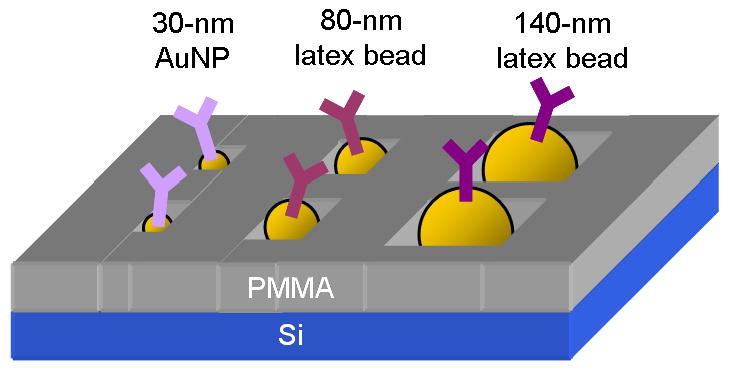
Concept illustration showing the size-dependent self-assembly of the beads on the e-beam patterned surface.
2. Experimental section
2.1. Substrate preparation
A p-doped silicon wafer (p-type boron, 450-648 μm thick and 4-75 Ω cm, Exsil, Inc., Prescott, AZ, USA), containing a positive surface charge, is cut into 1 cm2 chips. Each chip is spin coated with 4% 950,000 molecular weight PMMA in chlorobenzene (Microchem, Newton, MA, USA). A thinner resist layer is made by a 1:1 dilution of the aforementioned resist with chlorobenzene (Microchem), resulting in 2% PMMA in chlorobenzene and a 125-150 nm thick layer. The resist is applied to the chip, then spun at 500 rpm for 5 s followed by 4000 rpm for 40 s. The chips are then placed on a hot plate at 180°C for 5 min before being removed and allowed to cool down to room temperature (25°C), before e-beam etching.
2.2. Pattern etching and developing
A JEOL 6400 scanning electron microscope (SEM, JEOL Ltd., Tokyo, Japan) equipped with a Nanometer Pattern Generation System (NPGS, JCNabity, Bozeman, MT, USA) is used to etch the patterns into the PMMA. DesignCAD software is used to create the desired patterns to be etched. The energy applied is adjusted to obtain specific sized patterns that are able to be developed enough to completely expose the silicon while maintaining the desired size relative to the size of the beads. Larger well patterns are obtained by creating small circular patterns in the software, while the smaller patterns (∼100 nm) are obtained by increasing the residence type of electron beam to create various “spots” in the PMMA, thus etching the desired sized patterns for the smaller beads used. The patterned wells are approximately 180 and 130 nm in diameter.
2.3. AuNP synthesis
Gold nanoparticles (AuNPs) were synthesized by reducing potassium tetrachlotoaurate (KAuCl4; catalog no. 334545, Aldrich, St. Louis, MO, USA) with sodium borohydride (NaBH4; catalog no. 452882, Aldrich) where Cl- ions are capping AuNPs, making them negatively charged and stabilized. This is basically the Brust-Schiffrin method without alkanethiol stabilizer [18,19]. All flasks, cylinders, and stir bars used in the AuNP synthesis were prewashed in 5 M sulfuric acid (H2SO4) for at least 12 h and rinsed rigorously in deionized (DI) water (18 MΩ cm, Millipore Simplicity, Billerica, MA, USA). Nitrogen gas was bubbled through DI water for 15 min to eliminate dissolved oxygen and thus prevent oxidation. The DI water was then used to make a 200 μg mL-1 solution of NaBH4 and a 1.2 mg mL-1 solution of KAuCl4. Solutions were bubbled for 15 min with nitrogen gas. Tween 80 was added (0.02% w/v in solution) to the stirring NaBH4 to further stabilize the particles. KAuCl4 was then dropwise added to NaBH4, while stirring in an ice bath, at a ratio of 1:2 KAuCl4 to NaBH4. The flasks were stirred for 3 h in an ice bath, resulting in a dark pink/light purple coloration, signaling the synthesis of the AuNPs. This method produced AuNPs approximately 30 nm in diameter, stabilized by the Tween 80.
2.4. Size-dependent self assembly
Three different sized carboxylated fluorescent polystyrene beads, 300 nm dragon green, 140 nm glacial blue and 80 nm dragon green, were purchased from Bangs Laboratories, Inc. The beads are in a solution containing Tween 20 surfactant and need to be washed to expose the carboxyl groups for both silicon surface binding and protein binding. Various centrifuge speeds and repetitions of centrifuging, sonicating, and resuspending were used in order to find a protocol that would work well with binding the beads to the exposed Si within the patterns. The beads also needed to be placed in a buffer solution, to dissociate the hydrogen ions of the carboxyl groups and create a negative surface charge.
Buffers and buffer strength were another factor in the bead washing and binding. For activation of the carboxyl groups and future protein binding, 2-(N-morpholino) ethanesulfonic acid (MES) and phosphate buffered saline (PBS) buffers were used. When using PBS for bead washing, the beads bound to the exposed silicon. However, the beads also bound to the PMMA. When using MES, the number of beads within the exposed silicon was reduced; the beads did not saturate the exposed silicon as well with MES as they did with PBS. However, there is little to no bead presence on the PMMA surface when using the MES. MES, in its unaltered state, has a pH of ∼5.0. Binding was still evident at this pH, but was greatly improved when sodium hydroxide (NaOH) was used to raise the pH of the buffer to ∼7.0. The molarity of the buffer greatly affected the bead binding. Three different molarities were evaluated: 10 mM, 50 mM, and 100 mM. The 50 mM was the best choice, as it bound much more beads to the exposed silicon than did the other 2 molarities.
The final washing protocol for the 300-nm beads utilized two repetitions of centrifuging in 50 mM MES buffer (pH 7.0) for 15 min at 16 g, followed by re-suspension in 50 mM MES (pH 7.0). The 140 nm beads used a similar protocol with a 5 min increase in the centrifuge time, and the 80 nm beads contained a 15 min increase in the centrifuge time.
Once washed, the carboxyl groups of the beads are exposed, creating a negative charge on the surface of the beads when added to the buffer. The beads were serially added to the substrate surface, from largest in diameter of beads on down to the smallest particles, by placing a 2 μL droplet where the patterns had been developed (Supporting Information available). The droplets resided for 15 s, then were rinsed with DI water and blown dry with nitrogen gas.
2.5. Protein conjugation
Two sets of 0.05% 140 nm carboxylated fluorescent beads (Bangs Lab Cat. No. FC02F) were washed twice with PBS-BN (10 mM PBS at pH 7.4, 1% BSA, and 0.05% sodium azide) by centrifucation. One set was conjugated to mIgG (Sigma, catalog number I5381) and subsequently to anti-mIgG (Sigma, catalog number M8642) or anti-mIgG-FITC (Sigma, catalog number F9006) at room temperature under 120 rpm for 2 h. The set was refrigerated overnight, to facilitate proper orientation of proteins, and then subjected to washing by centrifugation twice with PBS-BNT (10 mM PBS at pH 7.4, 1% BSA, 0.05% sodium azide, and 0.02% Tween 80). The other set was subjected to the same condition without proteins.
2.6. Fluorescent attenuation
A micro-injection apparatus was used to inject two droplets of mIgG conjugated fluorescent beads and unconjugated beads on a p-doped silicon surface, within 45 μm of each other. This close proximity was to allow both samples to be imaged within the same picture, showing the effect of the presence of the antibodies. To proove the concept of fluorescent attenuation as a biorecognition method on a nanoarray, 140 nm fluorescent beads, conjugated and unconjugated with mIgG and anti-mIgG-FITC, were mixed together and subsequently 2 μL of the mixture was added to the 180 nm patterned array. Fluorescent images were taken under 100× objective by the Nikon Eclipse TS100 and analyzed by MetaVue Version 6.2r6 (Universal Imaging Corp., Downington, PA, USA). SEM Imaging: Due to the sensitivity of PMMA to the electron beam, the Si chips needed to be sputter-coated with a Au/Pd or Pt coating of approximately 5-10 nm in thickness. The metal coating allowed the sample to be more conductive and provided a protective layer that allowed longer viewing time as well as enhanced signaling of the samples before the PMMA deteriorated. The SEM used for viewing of the samples was the Hitachi S-4500 field emission SEM. Samples were viewed using a secondary electron detector at 5 keV accelerating voltage, to allow both higher resolution and maximum viewing time of image.
3. Results and discussion
3.1. Size-dependent self-assembly
For initial SDSA experiments, we used 300 nm dragon green fluorescent beads and 140 nm glacial blue fluorescent beads. The attempted e-beam patterns used to bind the beads were approximately 320 nm and 180 nm in diameter, alternating along with vertical lines. The beads were added to the surface serially, largest to smallest, with rinsing in between. Under the fluorescent microscope, separate blue and green fluorescent signals were shown in the patterns, showing size-dependent self-assembly (Figure 2). From three different images each taken from different chips, we found 70% of e-beam patterns were occupied with fluorescent beads, i.e. 70% overall saturation rate.
Figure 2.
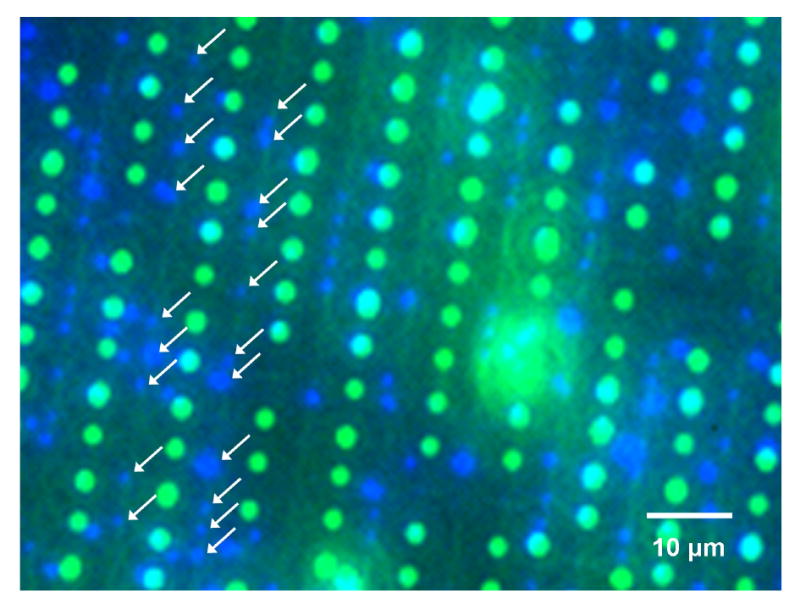
Fluorescent image showing size-dependent self-assembly with 70% saturation rate of the patterns with beads. Green = 300 nm beads. Blue = 140 nm beads. The blue beads in the second and third column are indicated with arrows.
We used three different sized beads in order to show SDSA at the nanometer scale; 140 nm glacial blue fluorescent beads, 80 nm dragon green fluorescent beads, and 30 nm gold nanoparticles (AuNP). There were two different sizes of patterns used, approximately 180 nm is diameter and 130 nm in diameter. All three of these beads contain negative charge on their outer surface.
We first tried 140 nm beads followed by 30 nm AuNPs (Figure 3). The 140 nm beads bound very well to the 180 nm patterns, nearly saturating the patterns. They were not found to be bound to any of the smaller patterns or the open PMMA surface. The 30 nm AuNP bound to the exposed patterns that had no beads already in them, and did not bind to the other beads present, or the open PMMA surface (Figure 3). The average saturation rate of the 140 and 30 nm beads was 90%. The 140 nm beads bound ideally to the exposed patterns, binding only to the patterns that they were able to fit in, while the excess beads were rinsed from the open PMMA surface, with hardly any aggregates of beads showing within the pattern they were bound in. This shows that the washing protocol for the beads is optimized, leaving enough of the initial surfactanct so that the beads do not aggregate, while exposing the carboxyl groups and allowing enough surface charge to bind to the exposed silicon.
Figure 3.
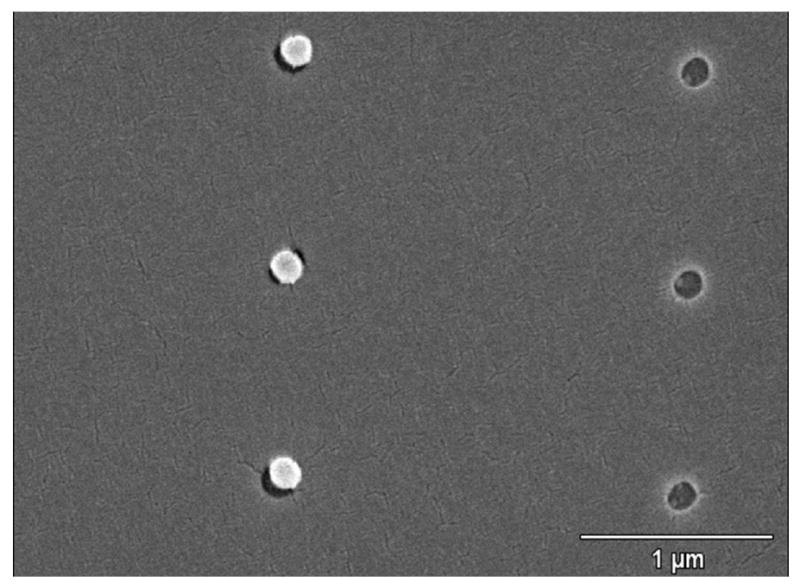
SEM image at 30000× magnification showing size-dependent self-assembly of 140 nm beads and 30 nm AuNPs in 180 nm and 130 nm well patterns created by electron beam lithography.
We then tried 140 nm first, followed by 80 nm, then the 30 nm AuNPs (Figure 4). The 80 nm beads exhibited some problems binding to any of the patterns. They did, however, bind to the open PMMA as well as other beads present. This leads us to believe that either the surfactant and carboxyl groups were stripped off, or the Tween 20 surfactant (added to the beads by the manufacturer) is still covering the surface, blocking the carboxyl groups. Even though the washing protocol of centrifuge/resuspend cycles worked for the other beads, the 80 nm beads may be too small for this washing method to be effective. The washing protocol still needs to be improved before this size of bead becomes fully effective in the array.
Figure 4.
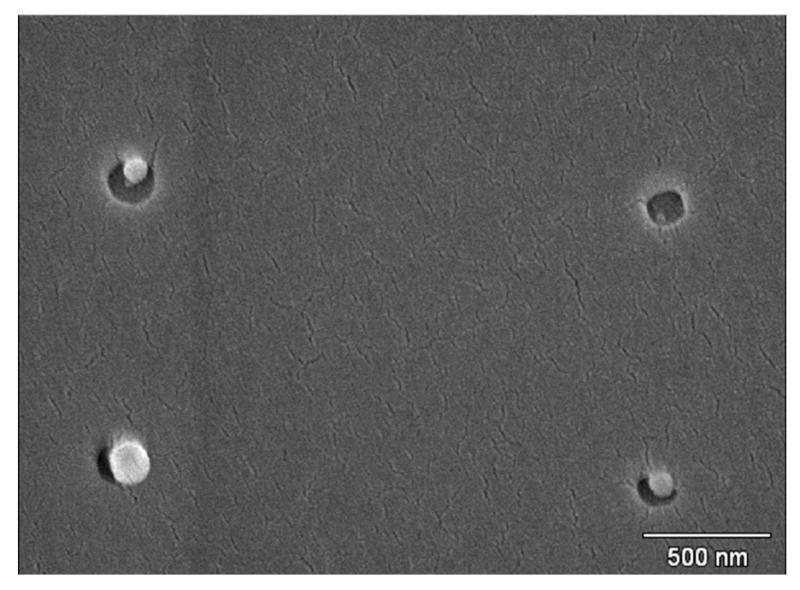
SEM image of 140 nm and 80 nm beads and AuNP bound within the patterns. The upper left pattern contains both an AuNP and an 80 nm bead.
AuNP, on the other hand, did not show the same binding problems as the 80 nm beads, even with the use of Tween 80 to stabilize the particles. Normally when synthesized without stabilizer, the AuNPs quickly become unstable and begin to aggregate. The result is a variation in size of the aggregates, although binding to the polar surface still occurs, usually saturating all exposed patterns. With the addition of the Tween 80, there is a reduction in the amount of binding. However the size is stabilized, and therefore, no aggregates seem to form and binding still occurs to the polar surface of the p-doped silicon wafer (Figure 4).
Both Figures 3 and 4 show the beads binding to the edges of circular patterns. This binding of the beads is due to the breakage of the polymer chains of the polymethyl methacrylate (PMMA) by the electron beam on the edges of the patterns, creating a negatively charge portion of the PMMA surface that the beads bound to, instead of the Si exposed in the patterns.
The charged outer surface of the beads serve two purposes; electrostatic attraction to the positively charged silicon surface and electrostatic repulsion of other beads. When the smaller beads filled in a larger pattern, the pattern bound only one bead per pattern, which shows the electrostatic repulsion. This prevents aggregates of the beads and allows better resolution for the protein array (Figures 3 and 4).
The washing protocols varied with the size, and the binding results varied as well. Some of the beads were washed well enough for them to bind to the exposed patterns, and not the open PMMA surface, showing that the method of electrostatic interaction and SDSA works. However, either washing protocols need to be optimized for each bead type and size, or optimal beads may need to be synthesized in order to gain the full functionality of this array method. This was proven by the use of the AuNP, where they were initially prepared with an optimal amount of Tween 80 and enough surface charge to bind to the p-doped silicon, which allowed optimum binding within the smaller patterns. The use of both the carboxylated polystyrene beads as well as the AuNP shows that the method of SDSA using electrostatic attraction can be used successfully with a variety of materials, and does not need to be limited to biological applications.
3.2. Fluorescent attenuation of protein binding
Fluorescent attenuation was previously suggested as a possible method for biorecognition [20]. We comfirmed the method under two different scernarios: (1) droplet manipulation by using a microonjection apparatus and (2) a protein nanometer patterned array. In scernario 1, a droplet containing unconjugated beads was placed next to a droplet conjugated with anti-mouse IgG bound to mouse IgG (mIgG). Under the fluorescent microscope, there was a huge difference in fluorescent intensity between the unconjugated beads and the conjugated beads with bound antibodies in the droplet image (Figure 5). Although, the right droplet has more beads than the left droplet, we still can identify and recognize the fluorescent intensity from single fluorescent beads. By using MetaVue software to measure the pixel intensity, the pixels representing the unbound beads showed intensities ranging from 800-1000 (analysis not shown). The intensity of the conjugated beads with antibodies showed fluorescent intensities between 300-500; a 50% reduction in the fluorescent intensity of the unconjugated beads. Hence, this simple experiment validated the use of fluorescent intensity measurement for determining antibody binding on the surface of the beads.
Figure 5.
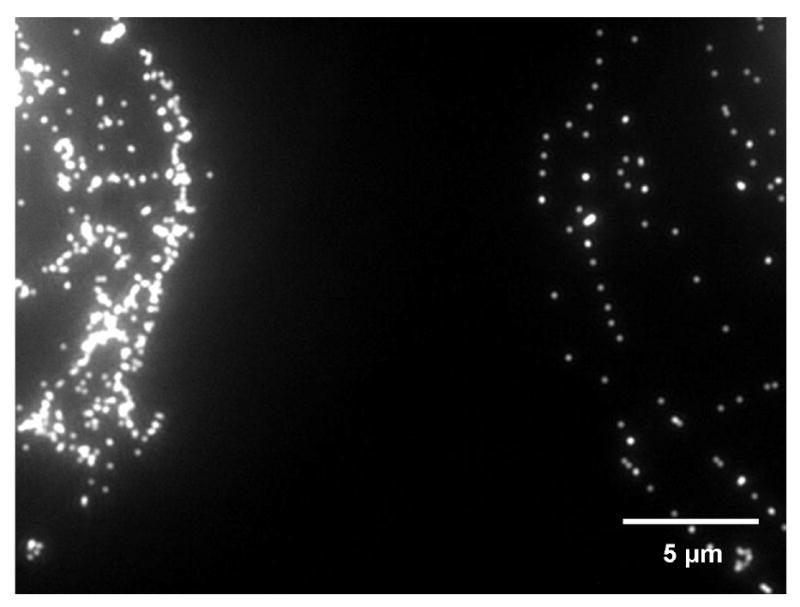
Figure showing edge of left droplet containing unconjugated 140 nm fluorescent beads and the right droplet containing the same type of beads conjugated with mIgG and bound to anti-mIgG. The unbound beads fluoresced brightly, while the conjugated beads showed signal attenuation when bound to anti-mIgG.
For scenario 2, we applied a mixture of 140 nm fluorescent beads conjugated and unconjugated with mouse IgG (mIgG). Anti-mIgG tagged with fluorescein isothiocyanate (FITC) was added to mIgG-conjugated beads to verify the binding of the proteins on the fluorescent beads. A difference in fluorescent intensity was recorded among the beads within the patterns (Figure 6). Column A of figure 8 is a superimposed image of the signals from the fluorescent beads (blue) and anti-mIgG-FITC (green); while column B shows a monochrome image of beads on the patterned array. Beads that captured anti-mIgG-FITC can clearly identified in column A and located under the monochrome image for the measurement of pixel intensity. It is evident under these images that not all beads within the patterned array are bound with anti-mIgG-FITC. The presence of FITC (i.e. binding of anti-mIgG to mIgG; column A) attenuates the fluorescent signal from the beads (column B). Analyses of pixel intensity indicate that beads conjugated with mIgG and anti-mIgG-FITC have about 50% decrease in fluorescent intensity compared to unconjugated beads (Column C of Figure 6). This result is similar to the previous finding of the two micro-droplets (Figure 5).
Figure 6.
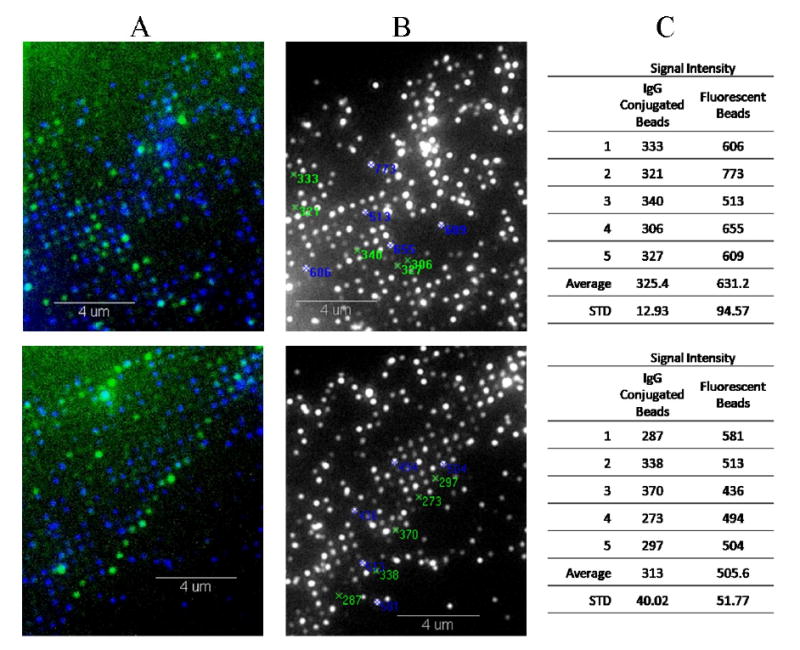
Images showing 140 nm fluorescent beads bound to a patterned array and tables showing pixel intensity. Beads are first conjugated with mIgG, and subsequently with anti-mIgG antibodies tagged with FITC. The presence of the FITC (column A) confirms the binding of proteins, which attenuates the fluorescent signal from the beads (column B). Based on pixel intensity measurement, mIgG conjugated beads have approximately 50% the fluorescent intensity of the unconjugated fluorescent beads (Column C).
Understandably, photobleaching can contribute to fluorescent attenuation. However, this is not a factor in displaying the difference between the fluorescent signals from conjugated and unconjugated beads in our experiments. We subjected the control, which is the unconjugated beads, to the same conditions as the conjugated beads. Fluorescent attenuation was initially shown with conjugated and unconjugated beads in two different droplets within the same image, without any superimposing (Figure 5). Also, we used the anti-mIgG-FITC as an indicator of antigen-antibody binding, showing fluorescent signals from the FITC where the bead fluorescent signals were attenuated. Therefore, photobleaching is not a factor when showing the difference between the fluorescent signal from the conjugated and unconjugated beads in our experiments.
4. Conclusion
A protein nanoarray was created utilizing size-dependent self-assembly of charged submicron/nano structures on an e-beam patterned p-doped silicon surface. This allows more precise placement and signaling of proteins conjugated to the submicron/nano structures. Three different sizes of submicron/nano-sized beads were serially bound to two different sized patterns, from largest to smallest, showing size-dependent self-assembly. Even though there are a few setbacks, such as the correct washing protocol of the 80 nm beads, this method was proved to be very successful, and with a little optimization, can become a valuable advancement in the fabrication of protein nanoarrays. Proteins were then conjugated to 140 nm fluorescent beads and bound to a simple pattern array. Fluorescent attenuation was shown with the conjugated beads and the subsequent antibody binding, compared to signal given by beads with no protein conjugation. Detection of antibody-antigen interaction was shown through the fluorescent attenuation. Other protein interaction analysis methods, such as DPN, have the potential to integrate size dependent self assembly into their detection methods. The method of size-dependent self-assembly is a powerful concept that will advance not only protein nanoarray technology, but has the potential to be used in the advancement of other nanotechnology applications as well.
Acknowledgments
This work was supported by US NIH research grant (R03EB006754).
Footnotes
Publisher's Disclaimer: This is a PDF file of an unedited manuscript that has been accepted for publication. As a service to our customers we are providing this early version of the manuscript. The manuscript will undergo copyediting, typesetting, and review of the resulting proof before it is published in its final citable form. Please note that during the production process errors may be discovered which could affect the content, and all legal disclaimers that apply to the journal pertain.
References
- 1.Lee JH, Shim HW, Choi HS, Son YA, Lee CS. J Phys Chem Solids. 2008;69:1581–1584. [Google Scholar]
- 2.Blawas AS, Reichert WM. Biomaterials. 1998;19:595–609. doi: 10.1016/s0142-9612(97)00218-4. [DOI] [PubMed] [Google Scholar]
- 3.Saravia V, Kupeu S, Nolte M, Huber C, Pum D, Fery A, Sleytr UB, Toca-Herrera JL. J Biotechnol. 2007;130:247–252. doi: 10.1016/j.jbiotec.2007.04.017. [DOI] [PubMed] [Google Scholar]
- 4.Natarajan S, Katsamba PS, Miles A, Eckman J, Papalia GA, Rich RL, Gale BK, Myszka DG. Anal Biochem. 2008;373:141–146. doi: 10.1016/j.ab.2007.07.035. [DOI] [PubMed] [Google Scholar]
- 5.Lee KB, Park SJ, Mirkin CA, Smith JC, Mrksich M. Science. 2002;295:1702–1705. doi: 10.1126/science.1067172. [DOI] [PubMed] [Google Scholar]
- 6.Lee M, Kang DK, Yang HK, Park KH, Choe SY, Kang CS, Chang SI, Han MH, Kang IC. Proteomics. 2006;6:1094–1103. doi: 10.1002/pmic.200500392. [DOI] [PubMed] [Google Scholar]
- 7.Lee SW, Oh BK, Sanedrin RG, Salaita K, Fujigaya T, Mirkin CA. Adv Mater. 2006;18:1133–1136. [Google Scholar]
- 8.Lee M, Yang HK, Park KH, Kang DK, Chang SI, Kang IC. Biochem Biophys Res Commun. 2007;362:935–939. doi: 10.1016/j.bbrc.2007.08.084. [DOI] [PubMed] [Google Scholar]
- 9.Liu X, Yue J, Zhang Z. Arch Biochem Biophys. 2008 doi: 10.1016/j.abb.2008.02.023. [DOI] [PubMed] [Google Scholar]
- 10.Sinensky AK, Belcher AM. Nat Nanotechnol. 2007;2:653–659. doi: 10.1038/nnano.2007.293. [DOI] [PubMed] [Google Scholar]
- 11.Li B, Zhang Y, Hu J, Li M. Ultramicroscopy. 2005;105:312–315. [Google Scholar]
- 12.Chhabra R, Sharma J, Ke Y, Liu Y, Rinker S, Lindsay S, Yan H. J Am Chem Soc. 2007;129:10304–10305. doi: 10.1021/ja072410u. [DOI] [PubMed] [Google Scholar]
- 13.Huang S, Schopf E, Chen Y. Nano Lett. 2007;7:3116–3121. doi: 10.1021/nl071643g. [DOI] [PubMed] [Google Scholar]
- 14.Wu F, Hu Z, Wang L, Xu J, Xian Y, Tian Y, Jin L. Electrochem Commun. 2008;10:630–634. [Google Scholar]
- 15.Parajuli O, Gupta A, Kumar N, Hahm JI. J Phys Chem. 2007;111:14022–14027. doi: 10.1021/jp075909j. [DOI] [PubMed] [Google Scholar]
- 16.Lucas LJ, Han JH, Chesler J, Yoon JY. Biosens Bioelectron. 2007;22:2216–2220. doi: 10.1016/j.bios.2006.10.029. [DOI] [PubMed] [Google Scholar]
- 17.Han JH, Heinze BC, Yoon JY. Biosens Bioelectron. 2008;23:1303–1306. doi: 10.1016/j.bios.2007.11.013. [DOI] [PubMed] [Google Scholar]
- 18.Daniel MC, Astruc D. Chem Rev. 2004;104:293–346. doi: 10.1021/cr030698+. [DOI] [PubMed] [Google Scholar]
- 19.Brust M, Walker M, Bethell D, Schiffrin DJ, Whyman RJ. J Chem Soc, Chem Commun. 1994:801–802. [Google Scholar]
- 20.Lucas LJ, Chesler J, Yoon JY. Biosens Bioelectron. 2007;23:675–681. doi: 10.1016/j.bios.2007.08.004. [DOI] [PubMed] [Google Scholar]


