

Abstract
The synthesis, characterization, and cytotoxicity of eight new platinum(IV) complexes having the general formula, c,c,t-[Pt(NH3)2Cl2(O2CNHR)2], are reported, where R = tert-butyl (4), cyclopentyl (5), cyclohexyl (6), phenyl (7), p-tolyl (8), p-anisole (9), 4-fluorophenyl (10), or 1-naphthyl (11). These compounds were synthesized by reacting organic isocyanates with the platinum(IV) complex, c,c,t-[Pt(NH3)2Cl2(OH)2]. The electrochemistry of the compounds was investigated by cyclic voltammetry. The aryl carbamate complexes 7 – 11 exhibit reduction peak potentials near −720 mV vs. Ag/AgCl, whereas the alkyl carbamate complexes display reduction peak potentials between −820 and −850 mV vs. Ag/AgCl. The cyclic voltammograms of c,c,t-[Pt(NH3)2Cl2(O2CCH3)2] (1), c,c,t-[Pt(NH3)2Cl2(O2CCF3)2] (2), and cis-[Pt(NH3)2Cl4] (3) were measured for comparison. Density functional theory (DFT) studies were undertaken to investigate the electronic structures of 1 – 11 and to determine their adiabatic electron affinities. A linear correlation (R2 = 0.887) between computed adiabatic electron affinities and measured reduction peak potential was discovered. The biological activity of 4 – 11 and, for comparison, cisplatin was evaluated in human lung cancer A549 and normal MRC-5 cells by the MTT assay. The compounds exhibit comparable or slightly better activity than cisplatin against the A549 cells. In MRC-5 cells, all are equally or slightly less cytotoxic than cisplatin, except for 4 and 5, which are more toxic.
Introduction
The simple coordination compound, cis-diamminedichloroplatinum(II) or cisplatin, is an effective anticancer drug that has been used in the clinic since 1978.1 Its success has given rise to the second-generation platinum drugs, carboplatin and oxaliplatin. These three platinum(II) complexes are believed to operate by a similar mechanism. Aquation of the leaving groups, chloride for cisplatin, carboxylate and oxalate for carboplatin and oxaliplatin, respectively, generates reactive cis-diam(m)ineplatinum cations, which react readily with the purine nucleobases in DNA.2, 3 Structural distortions in DNA induced by platinum binding4–7 trigger multiple cellular responses that ultimately lead to cell death.8,9
Despite the clinical success of these compounds, the requirement for intravenous administration and associated long-term toxic side effects10–12 diminish the quality of life for patients. Platinum anticancer complexes in the +4 oxidation state have shown considerable promise for both oral administration and for reducing systematic toxicity.13–15 The orally administered platinum(IV) complex, satraplatin, progressed as far as Phase III in clinical trials.16 The increased stability of these complexes, due to their low-spin d6 electronic configuration, aids in their survival of the acidic environment of the stomach before being absorbed into the bloodstream. They operate by a mechanism similar to that of the first and second generation operate by a mechanism similar to that of the first and second generation platinum(II) analogues. An activation step, namely reduction from Pt(IV) to Pt(II), must occur before aquation and DNA binding, however (Scheme 1).
Scheme 1.

In addition to their kinetic stability, another favorable property of platinum(IV) complexes relative to their platinum(II) counterparts is the presence of two additional coordination sites that can be modified to alter their pharmokinetic properties. By varying the two axial ligands, one can predictably alter the redox potential17–19 and lipophilicity20–22 of the platinum(IV) complex while leaving the DNA binding cis-diammineplatinum moiety unaltered. Furthermore, the axial coordination sites can serve as binding sites for other biologically active ligands, which may have synergistic effects with platinum therapy, as demonstrated by us23–25 and by others.26, 27 The ability to tether platinum(IV) complexes via the axial ligands to various nano-delivery devices for increased cellular uptake and selectivity28–35 is another advantage. The design of new platinum(IV) anticancer complexes, however, is limited by the current synthetic methodology.36–42 Most of the newly tested platinum(IV) complexes bear either chloro, hydroxo, or carboxylato axial ligands. The development of new synthetic methodologies for accessing the platinum(IV) manifold can expand the range of complexes having novel properties.
The synthesis of platinum(IV) complexes with axial methyl, ethyl, and isopropyl carbamato ligands was described over 10 years ago.36 Since then, their biological properties have only rarely been explored,43 and further investigations of the scope of this synthetic methodology have not been pursued. In the present work, we report both a modification and expansion of this approach through the synthesis of eight new platinum(IV) complexes of both alkyl and aryl carbamates as well as a brief investigation of their biological activity. Computational DFT studies were undertaken to gain a deeper understanding of the electronic structure of these new complexes. The results presented here indicate that platinum(IV) carbamates are a promising new class of potential anticancer agents.
Experimental
General Considerations
All reactions were carried out under normal atmospheric conditions. Solvents were used as received without additional drying or purification. All isocyanates were used as received from commercial vendors. The compounds c,c,t-[Pt(NH3)2Cl2(OH)2], c,c,t-[Pt(NH3)2Cl2(O2CCH3)2] (1), and c-[Pt(NH3)2Cl4] (3) were synthesized as previously described44, 45 using cisplatin purchased from Strem Chemicals, Inc. as the starting material.
Physical Measurements
NMR measurements were recorded on a Bruker DPX-400 spectrometer in the MIT Department of Chemistry Instrumentation Facility at 20 °C with deuterated dimethylsulfoxide (DMSO-d6) as the solvent. All NMR chemical shifts (δ) are reported in parts per million (ppm) and referenced as described below. 1H and 13C{1H} NMR spectra were referenced internally to residual solvent peaks and chemical shifts are expressed relative to tetramethylsilane, SiMe4 (δ = 0 ppm). 195Pt{1H} and 19F{1H} NMR spectra and were referenced externally using standards of K2PtCl4 in D2O (δ = −1628 ppm) and trifluorotoluene (δ = −63.72 ppm), respectively. Fourier transform infrared (FTIR) spectra were recorded with a ThermoNicolet Avatar 360 spectrophotometer running the OMNIC software. Samples were prepared as KBr disks. Cyclic voltammograms were obtained at room temperature using a VersaSTAT3 potentiostat from Princeton Applied Research accompanied by the V3 Studio software. A three electrode system was used comprising a glassy carbon electrode as the working electrode, a Pt wire as the auxiliary electrode, and Ag/AgCl (aqueous, saturated NaCl) electrode as the reference electrode. Samples were prepared as 2 mM solutions in N,N-dimethylformamide (DMF) with 0.1 M (n-Bu4N)PF6 as the supporting electrolyte. Reported values are peak potentials of the irreversible reduction event at a scan rate of 100 mV/s. Under the conditions described here, the reversible ferrocene/ferrocenium redox couple was consistently found between 0.54 – 0.55 V vs. Ag/AgCl. Electrospray ionization mass spectrometry (ESI-MS) measurements were acquired on an Agilent Technologies 1100 series LC-MSD trap.
Synthesis of c,c,t-[Pt(NH3)2Cl2(O2CCF3)2] (2)
The compound c,c,t-[Pt(NH3)2Cl2(OH)2] (0.144 g, 0.429 mmol) was suspended in 2 mL of trifluoroacetic anhydride. The mixture was stirred for 1 h at room temperature, open to air, at which point the volatile anhydride had evaporated, leaving a white residue. A 2 mL volume of tetrahydrofuran (THF) was added to the residue, and the resulting yellow solution was filtered through Celite. Pentane (~10 mL) was layered on top of the THF solution and the mixture was kept at −40 °C for 1 h to afford pale yellow microcrystals of 2. These microcrystals were collected by vacuum filtration and washed with pentane before being dried in vacuo. Yield: 0.127 g (56%). 1H NMR (400 MHz): δ 6.63 (br s, 6H). 13C{1H} NMR (100 MHz): δ 161.8 (q, 2JCF = 37 Hz), 111.7 (q, 1JCF = 288 Hz). 19F{1H} NMR (377 MHz): δ −73.6. 195Pt{1H} NMR (86 MHz): δ 1182. IR (KBr, cm−1): 3426 m br, 3280 s, 3232 s, 3197 s, 3075 m, 1722 vs, 1559 w, 1382 m, 1331 m, 1212 s, 1162 vs, 1034 w, 859 w, 781 m, 739 m, 524 w. Anal. Calcd. for 2, C4H6Cl2F6N2O4Pt: C, 9.13; H, 1.15; N, 5.32. Found: C, 9.38; H, 1.21; N, 5.31.
General Synthesis of c,c,t-[Pt(NH3)2Cl2(O2CNHR)2]
To a suspension of c,c,t-[Pt(NH3)2Cl2(OH)2] (0.20 g, 0.60 mmol) in 1 mL of DMF was added a 1 mL DMF solution containing 4 mol-equiv of the isocyanate. The resulting mixture was stirred for 12 h at room temperature, resulting in the formation of a homogenous solution. The solution was filtered and the desired product was precipitated by the addition of diethyl ether. The solid was collected by either filtration or centrifugation. To remove residual DMF, the solid was suspended in water for 30 min, isolated by centrifugation, resuspended in ethanol, isolated by centrifugation, resuspended in diethyl ether, isolated by centrifugation, and finally dried under vacuum.
Compound 4
R = tert-butyl. White solid. Yield: 0.153 g (48%). Mp 238–245 °C (dec). 1H NMR (400 MHz): δ 6.65 (br, 6H), 6.05 (br, 2H), 1.17 (s, 18H). 13C{1H} NMR 100 MHz): δ 162.8, 49.4, 29.3. 195Pt{1H} NMR (86 MHz): δ 1276. IR (KBr, cm−1): 3387 vs, 3301 m, 3220 s, 2975 m, 2931 w, 1640 vs, 1629 vs, 1505 vs, 1462 m, 1393 w, 1366 m, 1281 vs, 1211 s, 1079 m, 943 m, 788 w, 727 w, 645 w, 569 w, 434 w. ESI-MS (neg. ion mode): m/z 531.1 [M−]. Anal. Calcd. for 4, C10H26Cl2N4O4Pt: C, 22.56; H, 4.92; N, 10.52. Found: C, 23.14; H, 4.83; N, 10.65.
Compound 5
R = cyclopentyl. White solid. Yield: 0.240 g (72%). Mp 208–214 °C (dec). 1H NMR (400 MHz): δ 6.67 (br, 6H), 6.55 (br, 2H), 3.78 – 3.71 (m, 2H), 1.68 – 1.34 (m, 16H). 13C{1H} NMR (400 MHz): δ 163.4, 52.7, 32.5, 23.3. 195Pt{1H} NMR (86 MHz): δ 1274 (major), 1262 (minor). IR (KBr, cm−1): 3402 s, 3354 vs, 3243 vs, 2959 s, 2869 m, 1629 vs, 1509 vs, 1358 m, 1297 s, 1252 s, 1099 w, 1037 w, 1008 w, 953 w, 782 w, 581 w. ESI-MS (neg. ion mode): m/z 555.0 [M−]. Anal. Calcd. for 5, C12H26Cl2N4O4Pt: C, 25.91; H, 4.71; N, 10.07. Found: C, 25.76; H, 4.66; N, 10.29.
Compound 6
R = cyclohexyl. White solid. Yield: 0.287 g (81%). Mp 228–233 °C (dec). 1H NMR (400 MHz): δ 6.67 (br, 6H), 6.47 (br, 2H), 3.19 (br, 2H), 1.71 – 1.50 (m, 10H), 1.22 – 1.02 (m, 10H). 13C{1H} NMR (100 MHz): δ 163.0, 50.0, 33.1, 25.3, 24.9. 195Pt{1H} NMR (86 MHz): δ 1276 (major), 1263 (minor). IR (KBr, cm−1): 3375 vs, 3304 m, 3239 s, 2931 s, 2853 m, 1628 vs, 1500 vs, 1244 s, 1035 m, 931 w, 783 w, 724 w, 706 w, 587 w. ESI-MS (neg. ion mode): m/z 583.0 [M – H]−. Anal. Calcd. for 6, C14H30Cl2N4O4Pt: C, 28.77; H, 5.17; N, 9.59. Found: C, 28.89; H, 5.20; N, 9.44.
Compound 7
R = phenyl. Yellow solid. Yield: 0.214 g (60%). Mp 171–176 °C (dec). 1H NMR (400 MHz): δ 9.12 (br, 2H), 7.47 (d, 4H), 7.18 (t, 4H), 6.86 (t, 2H), 6.79 (br, 6H). 13C{1H} NMR (100 MHz): δ 160.7, 140.7, 128.3, 121.0, 118.0. 195Pt{1H} NMR (86 MHz): δ 1265. IR (KBr, cm−1): 3243 s br, 1654 vs, 1595 s, 1514 s, 1438 s, 1393 s, 1315 s, 1227 s, 1045 m, 1025 m, 754 m, 691 m. ESI-MS (neg. ion mode): m/z 570.9 [M – H]−. Anal. Calcd. for 7, C14H18Cl2N4O4Pt: C, 29.38; H, 3.17; N, 9.79. Found: C, 29.56; H, 3.07; N, 9.67.
Compound 8
R = para-tolyl. Pale orange solid. Yield: 0.229 g (64%). Mp 149–151 °C (dec). 1H NMR (400 MHz): δ 9.02 (br, 2H), 7.36 (d, 4H), 6.98 (d, 4H), 6.79 (br, 6H), 2.20 (s, 6H). 13C{1H} NMR (100 MHz): δ 160.8, 138.2, 129.7, 128.7, 118.1, 20.4. 195Pt{1H} NMR (86 MHz): δ 1264. IR (KBr, cm−1): 3404 s, 3353 s, 3217 br vs, 2924 w, 1663 vs, 1635 s, 1592 m, 1522 vs, 1502 m, 1404 m, 1314 s, 1289 s, 1250 m, 1223 vs, 1041 s, 817 m, 776 m, 740 w, 654 w, 582 w, 510 w. ESI-MS (neg. ion mode): m/z 599.0 [M – H]−, 1199.0 [2M – H]−. Anal. Calcd. for 8, C16H22Cl2N4O4Pt: C, 32.01; H, 3.69; N, 9.31. Found: C, 32.14; H, 3.75; N, 9.51.
Compound 9
R = para-anisole. Pale orange solid. Yield: 0.190 g (50%). Mp 115–117 °C (dec). 1H NMR (400 MHz): δ 8.98 (br, 2H), 7.37 (d, 4H), 6.77 (br d, 10H), 3.68 (s, 6H). 13C{1H} NMR (100 MHz): δ 160.9, 153.8, 134.0, 119.5, 113.5, 55.1. 195Pt{1H} NMR (86 MHz): δ 1265. IR (KBr, cm−1): 3223 s br, 2835 w, 1647 vs, 1515 vs, 1410 m, 1298 s, 1223 vs, 1178 m, 1029 s, 827 m, 777 w, 739 w, 652 m, 583 w, 527 w. ESI-MS (neg. ion mode): m/z 630.9 [M]−. Anal. Calcd. for 9, C16H22Cl2N4O4Pt: C, 30.39; H, 3.51; N, 8.86. Found: C, 30.45; H, 3.48; N, 8.73.
Compound 10
R = 4-fluorophenyl. Pale yellow solid. Yield: 0.237 g (65%). Mp 208–210 °C (dec). 1H NMR (400 MHz): δ 9.21 (br, 2H), 7.48 – 7.45 (m, 4H), 7.02 (app t, 4H), 6.78 (br, 6H). 13C{1H} NMR (100 MHz): δ 160.7, 156.9 (d, 1JCF = 236 Hz), 137.1, 119.5, 114.7 (d, 2JCF = 22.0 Hz). 19F{1H} NMR (377 MHz): δ −125.2 (s, 2F). 195Pt{1H} NMR (86 MHz): δ 1265. IR (KBr, cm−1): 3367 s, 3238 s br, 1657 vs, 1512 vs, 1407 s, 1389 m, 1305 m, 1259 s, 1213 vs, 1157 w, 1101 w, 1037 s, 832 s, 653 m, 584 w, 513 w. ESI-MS (neg. ion mode): m/z 606.9 [M – H]−, 1216.0 [2M – H]−. Anal. Calcd. for 10, C14H16Cl2F2N4O4Pt: C, 27.64; H, 2.65; N, 9.21. Found: C 27.42; H, 2.50; N, 9.02.
Compound 11
R = 1-naphthyl. Pale orange solid. Yield: 0.093 g (46%, using 0.30 mmol of starting material). Mp 152–157 °C (dec). 1H NMR (400 MHz): δ 9.01 (s, 2H), 8.19 – 8.17 (m, 2H), 7.88 – 7.85 (m, 2H), 7.67 (d, 2H), 7.62 (d, 2H), 7.50 – 7.40 (m, 6H), 6.82 (br, 6H). 13C{1H} NMR (100 MHz): δ 161.9, 135.5, 133.7, 127.9, 127.5, 125.7, 125.6, 125.2, 123.5, 123.4, 120.6. 195Pt{1H} NMR (86 MHz): δ 1269. IR (KBr, cm−1): 3407 (s), 3355 (s), 3211 (s, br), 3063 (m), 1654 (vs), 1566 (m), 1490 (s), 1410 (s), 1341 (s), 1247 (s), 1101 (w), 999 (w), 791 (m), 772 (s), 544 (w). ESI-MS (neg. ion mode): m/z 669.8 [M – H]−. Anal. Calcd. for 11, C22H22Cl2N4O4Pt: C, 39.30; H, 3.30; N, 8.33. Found: C, 39.44; H, 3.29; N, 8.39.
X-ray Crystallographic Studies
Single crystals were mounted in Paratone oil on a cryoloop and frozen under a 110 K or 100 K KRYO-FLEX nitrogen cold stream. Data were collected on a Bruker APEX CCD X-ray diffractometer with graphite-monochromated Mo-Kα radiation (λ = 0.71073 Å) controlled by the APEX2 software package.46 Absorption corrections were applied using SADABS.47 The structures were solved using direct methods and refined on F2 with the SHELXTL-97 software package.48, 49 Structures were checked for higher symmetry using PLATON.50 All non-hydrogen atoms were located and refined anisotropically. Unless otherwise stated, hydrogen atoms were placed in idealized locations and given isotropic thermal parameters equivalent to either 1.5 (terminal CH3 or NH3 hydrogen atoms) or 1.2 times the thermal parameter of the atom to which they were attached. Structure refinement was carried out using established strategies.51 Specific details regarding crystal growth and refinement are described in the Supporting Information (SI), and parameters are shown in Tables 1, 2, and S1. Selected bond lengths and angles for 2 are listed in Table S2.
Table 1.
Summary of the X-Ray Crystallographic Information and Data Collection Parameters for 4 – 7
| 4·3DMSO | 5·2DMF | 6·2DMSO | 7·DMSO·0.5H2O | |
|---|---|---|---|---|
| formula | C16H44Cl2N4O7PtS3 | C18H40Cl2N6O6Pt | C18H42Cl2N4O6PtS2 | C16H25Cl2N4O5.5PtS |
| fw | 766.72 | 702.55 | 740.67 | 659.45 |
| space group | P1̄ | P1̄ | Pbcn | P21/c |
| a, Å | 8.9361(10) | 9.0048(9) | 25.5442(17) | 11.5530(5) |
| b, Å | 10.5917(12) | 12.6877(13) | 10.7982(7) | 31.3292(13) |
| c, Å | 16.762(2) | 13.2385(14) | 20.7211(13) | 13.5070(6) |
| α, deg | 89.100(2) | 116.484(2) | ||
| β, deg | 89.454(2) | 93.069(2) | 109.7380(10) | |
| γ, deg | 72.258(2) | 92.288(2) | ||
| V, Å3 | 1510.8(3) | 1348.4(2) | 5715.5(6) | 4601.6(3) |
| Z | 2 | 2 | 8 | 8 |
| ϱcald, g·cm−3 | 1.685 | 1.730 | 1.721 | 1.904 |
| T, °C | −173(2) | −173(2) | −173(2) | −173(2) |
| μ(Mo Kα), mm−1 | 5.066 | 5.444 | 5.281 | 6.458 |
| Θ range, deg | 2.02–28.25 | 1.72–29.73 | 1.59–29.18 | 1.73–25.11 |
| total no. of data | 30171 | 29870 | 118407 | 75374 |
| no. of unique data | 7386 | 7585 | 7718 | 8189 |
| no. of parameters | 337 | 304 | 323 | 546 |
| completeness to Θ (%) | 98.9 | 98.7 | 100.0 | 99.8 |
| R1a (%) | 2.91 | 2.38 | 4.27 | 3.44 |
| wR2b (%) | 5.50 | 5.00 | 5.66 | 4.96 |
| GOFc | 1.040 | 1.039 | 1.021 | 1.044 |
| max, min peaks, e·Ǻ3 | 1.749, −1.229 | 1.879, −2.044 | 1.672, −0.787 | 1.264, −0.733 |
R1 = Σ||Fo| − |Fc||/Σ|Fo|.
wR2 = {Σ[w(Fo2 − Fc2)2]/Σ[w(Fo2)2]}1/2.
GOF = {Σ[w(Fo2 − Fc2)2]/(n − p)}1/2 where n is the number of data and p is the number of refined parameters.
Table 2.
Summary of the X-Ray Crystallographic Information and Data Collection Parameters for 8 – 11
| 8·2DMSO·0.74H2O | 9·acetone | 10·3.5DMF | 11·3DMF | |
|---|---|---|---|---|
| formula | C20H35Cl2N4O6.74PtS2 | C19H28Cl2N4O7Pt | C24.5H40.5Cl2F2N7.5O7.5Pt | C31H43Cl2N7O7Pt |
| fw | 769.55 | 690.44 | 864.13 | 891.71 |
| space group | P1̄ | P21/c | P21 | P1̄ |
| a, Å | 11.6514(7) | 18.9166(10) | 18.0923(7) | 11.7178(14) |
| b, Å | 14.7016(8) | 9.5089(5) | 7.0254(3) | 12.0190(15) |
| c, Å | 18.4270(11) | 13.7632(7) | 26.4980(11) | 13.2152(16) |
| α, deg | 68.7800(10) | 87.170(2) | ||
| β, deg | 78.9840(10) | 92.5790(10) | 104.0310(10) | 77.548(2) |
| γ, deg | 84.3020(10) | 75.264(2) | ||
| V, Å3 | 2886.6(3) | 2473.2(2) | 3267.6(2) | 1757.6(4) |
| Z | 4 | 4 | 4 | 2 |
| ϱcald, g·cm−3 | 1.771 | 1.854 | 1.757 | 1.685 |
| T, °C | −173(2) | −173(2) | −163(2) | −173(2) |
| μ(Mo Kα), mm−1 | 5.234 | 5.935 | 4.524 | 4.199 |
| Θ range, deg | 1.49–29.32 | 2.16–28.74 | 1.24–28.66 | 1.58–28.40 |
| total no. of data | 60845 | 51159 | 68723 | 35819 |
| no. of unique data | 15609 | 6409 | 16640 | 8716 |
| no. of parameters | 706 | 304 | 903 | 457 |
| completeness to Θ (%) | 98.7 | 99.7 | 99.8 | 98.8 |
| R1a (%) | 4.36 | 2.82 | 2.83 | 2.27 |
| wR2b (%) | 8.05 | 4.83 | 5.70 | 4.21 |
| GOFc | 1.029 | 1.030 | 1.039 | 1.037 |
| max, min peaks, e·Ǻ3 | 3.119, −2.625 | 2.131, −0.468 | 1.221, −1.191 | 0.942, −0.712 |
R1 = Σ||Fo| − |Fc||/Σ|Fo|.
wR2 = {Σ[w(Fo2 − Fc2)2]/Σ[w(Fo2)2]}1/2.
GOF = {Σ[w(Fo2 − Fc2)2]/(n − p)}1/2 where n is the number of data and p is the number of refined parameters.
Theoretical Calculations
DFT calculations were performed using the Gaussian 03 (Rev.D01) software package.52 Geometry optimizations, frequency calculations, and molecular orbital generations were all carried out using the B3LYP functional.53, 54 For the light atoms (carbon, hydrogen, chlorine, nitrogen, oxygen, and fluorine), the 6–31++G(d,p) basis set55 was used, and for platinum, the LANL2DZ basis set and effective core potential56 was used. No solvation models were employed; the results described for all complexes are in the gas phase. Frequency calculations were carried out on all optimized geometries to verify the absence of imaginary values. To determine adiabatic electron affinities, an additional set of geometry optimizations and energy calculations were performed for the analogous monoanionic Pt(III) complexes with a doublet spin state. The difference in energy between the Pt(III) anion and neutral Pt(IV) complexes is the adiabatic electron affinity of the latter. The geometry optimization of the 1-electron reduced analogue of cis-[Pt(NH3)2Cl4] gave rise to a structure with an imaginary frequency. Hence, its adiabatic electron affinity was not computed. Atomic coordinates, energies, and lowest frequency of all optimized structures are provided in the SI as Tables S3 – S23.
Cell Lines and Culture Conditions
Human A549 (lung carcinoma) and human MRC-5 (normal lung fibroblasts) were grown as adherent monolayers in growth medium consisting of Dulbecco’s Modified Eagle Medium (DMEM) supplemented with 10% fetal bovine serum (FBS) and 1% penicillin/streptomycin. The cultures were grown in 25 cm2 flasks in an incubator at 37°C with a humidified atmosphere composed of 5% CO2.
Cytotoxicity Assays
The colorimetric MTT assay was used determine the cytotoxicity of cisplatin and compounds 1 – 6. Trypsinized A549 and MRC-5 cells were seeded into a 96-well plate at cell densities of 1500 cells/well and 2500 cells/well, respectively, in 200 μL of growth medium and were incubated for 24 h. The medium was then removed, and 200 μL of new growth medium containing various concentrations of the platinum complexes was added. After 72 h, the medium was removed, 200 μL of a 0.8 mg/mL solution of MTT in DMEM was added, and the plate was incubated for an additional 4 h. The DMEM/MTT mixture was aspirated, and 200 μL of dimethylsulfoxide (DMSO) with 10% pH 10.5 glycine buffer were added to dissolve the purple formazan crystals. The absorbance of the plates was read at 570 nm. Absorbance values were normalized to the platinum-free control wells and plotted as [Pt] versus % viability. IC50 values were extrapolated from the resulting curves. The reported IC50 values are the averages from at least three independent experiments, each of which consisted of three replicates per concentration level. Dilutions of the platinum(IV) compounds in growth medium were prepared from concentrated solutions (10 – 20 mM) in DMSO. Cisplatin was diluted from a phosphate-buffered saline solution (2 mM).
Results and Discussion
Synthesis and Characterization
The synthesis of the platinum(IV) carbamate complexes was accomplished by treating c,c,t-[Pt(NH3)2Cl2(OH)2] with the desired isocyanate in DMF solution (Scheme 2). Because the starting complex, c,c,t-[Pt(NH3)2Cl2(OH)2], is largely insoluble in DMF, the progress of the reaction was monitored visually by observing conversion of the reaction mixture from a suspension to a homogenous solution. The synthesis of the analogous methyl, ethyl, and isopropyl carbamate complexes has been reported previously.36 In this prior study, the authors prepared these complexes by suspending c,c,t-[Pt(NH3)2Cl2(OH)2] in the neat isocyanate with no additional solvent. In cases where the isocyanate is expensive or toxic, the use of only a slight excess, as demonstrated in the present work, is a clear advantage.
Scheme 2.

The platinum(IV) carbamates are either white (4 – 6) or pale yellow to pale orange (7 – 11) solids. Compounds 7 – 11 are the first reported platinum(IV) complexes bearing aryl carbamate ligands and thus extend the scope of the chemistry beyond simple alkyl isocyanates. Compounds 4 – 11 exhibit good solubility in DMF and DMSO, moderate solubility in THF, acetonitrile, and acetone, and poor solubility in water and halogenated organic solvents. In solution, the aryl carbamate complexes, 7 – 11, decompose to dark brown solutions when exposed to ambient light over the course of several hours. The alkyl carbamate complexes, 4 – 6, remain stable in solution even in the presence of light. The aromatic substituents of 7 – 11 most likely play a role in the photodecomposition of the complexes. In the absence of light, all the compounds are stable in solution.
Characterization of compounds 4 – 11 was accomplished by NMR spectroscopy, IR spectroscopy, mass spectrometry, elemental analysis, and X-ray crystallography (vide infra). Elemental analyses of the complexes are in good agreement with expected values, and electrospray ionization mass spectrometry gave rise to the expected [M-H]− signals, further validating the molecular formulas of these compounds. The IR spectra displayed characteristic C=O stretching frequencies ranging from 1647 to 1663 cm−1 for the aryl carbamate complexes and 1628 – 1629 cm−1 for the alkyl carbamate complexes. All complexes also display N–H stretching frequencies derived from the ammine ligands, which appear as a broad series of bands near 3200 cm−1.
The 1H, 13C, and 19F (for 10) NMR spectra of the complexes display all expected resonances. 195Pt and selected 1H NMR chemical shifts are summarized in Table 3. The signal corresponding to the NH proton of the carbamate ligands is observed between 8.97 – 9.21 ppm for the aryl carbamate complexes, 7 – 11, and between 6.05 – 6.55 ppm for the alkyl carbamate complexes, 4 – 6. This 3 ppm shift reflects significant deshielding of the NH carbamate resonance relative to the alkyl substituents by the aryl substituents. The proton resonances of the coordinated ammine ligands appear in all complexes as broad peaks ranging from 6.67 – 6.82 ppm. These values are consistent with ammine coordination to a Pt(IV) center; protons of ammines coordinated to Pt(II) centers typically lie further upfield, between 3 – 5 ppm.57
Table 3.
195Pt and Selected 1H NMR Shifts for 4 – 11 in DMSO-d6 at 20 °C
| compound | δ 195Pt, ppm | δ 1H, carbmate NH, ppm | δ 1H, NH3, ppm |
|---|---|---|---|
| 4 | 1276 | 6.05 | 6.65 |
| 5 | 1275 (major), 1262(minor) | 6.55 | 6.67 |
| 6 | 1276 (major), 1263 (minor) | 6.47 | 6.67 |
| 7 | 1265 | 9.12 | 6.79 |
| 8 | 1264 | 9.02 | 6.79 |
| 9 | 1265 | 8.98 | 6.77 |
| 10 | 1265 | 9.21 | 6.78 |
| 11 | 1269 | 9.01 | 6.82 |
The 195Pt NMR spectra of 7 – 11 display a single resonance in the range 1264 – 1269 ppm. Given that the known window for 195Pt NMR shifts is > 15,000 ppm, the small variance in chemical shifts among these complexes indicates that the peripheral substituents of the aryl rings have little effect on the magnetic environment of the platinum nucleus. The alkyl carbamate complex, 4, exhibits a single 195Pt NMR resonance in DMSO-d6 at 1276 ppm. These chemical shifts are in the range expected for Pt(IV) complexes58, 59 and are close to related platinum(IV) alkyl and aryl carboxylate complexes, which fall between 1000 and 1300 ppm. Although both the 1H and 13C NMR spectra of 5 and 6 are consistent with the presence of a single species in solution, the 195Pt NMR spectra at 20 °C in DMSO-d6 display two resonances at approximately 1276 and 1262 ppm in relative intensities of approximately 2:1. As the temperature of the NMR sample is increased, the two resonances eventually coalesce (Figure 1 and S1), between 50 and 65 °C. Consistent with the known temperature dependence of 195Pt NMR chemical shifts,60 the peaks are shifted downfield at higher temperatures as well.
Figure 1.

Variable-temperature 195Pt (left) and 1H (right) NMR spectra of 5 in DMSO-d6.
This fluxional process could also be monitored to by 1H NMR spectroscopy, as shown in Figures 1 and S1. The NH resonance of the carbamate ligand exhibits a significant temperature dependence, shifting upfield by 0.5 ppm at 80 °C. A small peak in the spectrum near 5.8 ppm broadens into the baseline at 35 °C. This peak most likely corresponds to the NH resonance of a minor conformational isomer. The aliphatic region of the 1H NMR spectrum is unaffected by changes in temperature. The broad peak of the coordinated NH3 protons is only slightly affected by an increase in temperature; a small upfield shift occurs and shoulders due to coupling to 14N (I = 1) become visible. The changes in the 195Pt and 1H NMR spectra as a function of temperature are fully reversible; after increasing the temperature to 80 °C, the original spectra can be obtained at 20 °C.
As shown in Chart 1, three possible conformational isomers exist for the complexes depending on the orientation of substituents about the C–N bond of the carbamate ligand. It is not clear why only two of these isomers are observed by 195Pt NMR spectroscopy, but it is possible that two of the isomers have very similar chemical shifts and are therefore not resolved as distinct peaks. Another possibility is that one of the conformational isomers is significantly less stable than the other two and never accumulates in a high enough concentration to be observed under equilibrium conditions. The use of variable-temperature 195Pt NMR spectroscopy to distinguish between chemically similar stereoisomers has been reported before.61–64 Our findings here similarly validate this method as a valuable tool for distinguishing isomers that could not otherwise be discerned by the more commonly used 1H and 13C NMR spectroscopy.
Chart 1.

X-ray Crystal Structures
Complexes 4 – 11 were all characterized by X-ray crystallography and are the first such structurally characterized platinum carbamate complexes. Compound 2 was also crystallographically characterized. Information about this structure and the crystal growth conditions for 2 can be found in the Supporting Information (Figure S2, Tables S1 and S2). Relevant bond distances and angles for the platinum carbamate complexes are listed in Table 4, and the structures are shown in Figures 2 and 3. The bond distances are typical; Pt–Cl bond length are close to 2.3 Å and Pt–O/N distances are ~ 2.0 Å. All complexes display the expected octahedral coordination geometry for platinum(IV). In addition, the structures all have the same stereochemistry as that of the starting platinum(IV) hydroxo compound (cis,cis,trans), which is retained upon formation of the carbamate ligands.
Table 4.
Selected Interatomic Lengths (Å) and Angles (deg) for 4 – 11a
| 4 | 5 | 6 | 7b | 8b | 9 | 10b | 11 | |
|---|---|---|---|---|---|---|---|---|
| Pt1–Cl1 | 2.3145(7) | 2.3324(6) | 2.3075(7) | 2.3272(10) | 2.3367(9) | 2.3187(6) | 2.3201(11) | 2.3176(6) |
| Pt1–Cl2 | 2.3326(8) | 2.3170(6) | 2.3151(7) | 2.3202(10) | 2.3324(9) | 2.3271(6) | 2.3127(11) | 2.3126(6) |
| Pt1–N1 | 2.037(2) | 2.0423(19) | 2.042(2) | 1.993(3) | 2.034(3) | 2.029(2) | 2.054(4) | 2.0299(17) |
| Pt1–N2 | 2.037(2) | 2.038(2) | 2.041(2) | 1.995(3) | 2.033(3) | 2.038(2) | 2.048(3) | 2.0349(18) |
| Pt1–O1 | 2.0117(19) | 2.0088(16) | 2.026(2) | 1.993(3) | 2.000(3) | 2.0230(18) | 2.0209(18) | 2.0065(13) |
| Pt1–O3 | 2.0062(19) | 1.9970(16) | 2.001(2) | 1.995(3) | 2.002(3) | 2.0113(18) | 1.9936(19) | 2.0161(13) |
| N1–Pt1–N2 | 90.00(10) | 90.02(8) | 93.17(10) | 92.21(13) | 89.81(14) | 91.70(9) | 93.49(10) | 92.42(7) |
| Cl1–Pt1–Cl2 | 92.57(3) | 91.99(2) | 91.48(3) | 92.68(4) | 94.64(3) | 90.90(2) | 89.24(3) | 91.33(2) |
| O1–Pt1–N1 | 96.54(9) | 86.31(7) | 97.67(10) | 96.66(12) | 91.99(13) | 91.27(8) | 91.90(14) | 91.81(6) |
| O1–Pt1–Cl2 | 90.12(6) | 87.53(5) | 90.47(6) | 86.18(8) | 88.04(9) | 88.69(6) | 89.58(10) | 88.74(4) |
| O3–Pt1–N2 | 94.89(9) | 89.31(8) | 93.21(9) | 93.15(12) | 92.70(13) | 91.94(8) | 91.40(14) | 96.96(6) |
| O3–Pt1–Cl1 | 87.04(6) | 88.30(5) | 89.64(6) | 88.14(8) | 87.07(9) | 87.92(5) | 87.67(9) | 84.12(4) |
| O1–Pt1–O3 | 174.06(8) | 174.22(7) | 174.17(9) | 174.94(11) | 168.70(11) | 174.20(7) | 174.72(8) | 173.33(6) |
Figure 2.

Molecular structures of 4 – 7. Ellipsoids are drawn at the 50% probability level.
Figure 3.

Molecular structures of 8 – 11. Ellipsoids are drawn at the 50% probability level.
A common feature among the eight complexes is the presence of intramolecular hydrogen bonding between the oxygen atom of the axial carbamate ligands and the equatorial ammine ligands. Three different geometries are observed for this interaction, as shown in Figure 4. In the first geometry, the oxygen atoms lie in a plane bisecting the N–Pt–N angle and interact with both coordinated ammines equally. This situation occurs for 6, both molecules in the asymmetric unit of 7, one of the molecules in the asymmetric unit of 8, and 11. The geometry in which both of the oxygen atoms are twisted to opposite sides and hydrogen bond with the different ammines is observed only in the case of 5. In the final case, one of the oxygen atoms is twisted off to the side and interacts with only one of the coordinated ammines. This geometry is the most common hydrogen bonding motif for this class of compounds and occurs in the remaining structures.
Figure 4.

The three intramolecular hydrogen bonding motifs observed in the crystal structures of 4– 11. These three examples are compounds 8 (left), 7 (middle), and 5 (right).
As discussed above, different conformational isomers, reflecting alternative orientations of substituents about the carbamate C–N bond, exist (Chart 1). The most commonly observed isomer is that with a syn/syn ligand orientation, observed for 5, 6, both molecules in the asymmetric unit of 7, both molecules in the asymmetric unit of 8, and one of the molecules in the asymmetric unit of 10. The anti/syn isomer occurs in 4, 9, and the other molecule in the asymmetric unit of 10. The naphthyl carbamate complex 11 crystallized exclusively as the anti/anti isomer. The occurrence of all three possible isomers throughout the crystal structures of 4 – 11 reflects a small energy difference between isomers in solution, as observed by NMR spectroscopy.
Cyclic Voltammetry
The biological activity of platinum(IV) complexes is mediated by their redox chemistry. In most cases, platinum(IV) complexes, unlike their platinum(II) progeny, do not bind directly to DNA or other biological nucleophiles.65 The redox potential of platinum(IV) complexes is therefore believed to be an important factor in their efficacy as antitumor agents. With this possibility in mind, we studied redox potentials of 1 – 11 by cyclic voltammetry.
Because of the limited aqueous solubility of 4 – 11, the cyclic voltammograms were recorded in DMF using 0.1 M (n-Bu4N)PF6 as the supporting electrolyte. For comparison, the electrochemical properties of the compounds c,c,t-[Pt(NH3)2Cl2(O2CCH3)2] (1), c,c,t-[Pt(NH3)2Cl2(O2CCF3)2] (2), and cis-[Pt(NH3)2Cl4] (3) were also investigated by cyclic voltammetry in the same solvent and electrolyte system. As expected for the Pt(IV)/Pt(II) redox couple, all of the compounds exhibit a single irreversible reduction event in the potential window of +0.4 to −1.2 V vs. Ag/AgCl. The peak potentials (Ep) for these processes obtained at a scan rate of 100 mV/s are reported in Table 5 and the corresponding cyclic voltammograms are shown in Figure 5.
Table 5.
Peak Reduction Potentials for 1 – 11 Measured by Cyclic Voltammetry in DMF
| Compound | Ep, V vs. Ag/AgCl |
|---|---|
| 1 | −0.72 (−0.64)a,b |
| 2 | −0.35 (0.01)a,c |
| 3 | −0.45 (−0.26)a,b |
| 4 | −0.85 |
| 5 | −0.85 |
| 6 | −0.82 |
| 7 | −0.73 |
| 8 | −0.71 |
| 9 | −0.72 |
| 10 | −0.66 |
| 11 | −0.63 |
Values in parentheses are for those measured in aqueous solution.
Ref. 66.
This work (Figure S3, SI).
Figure 5.
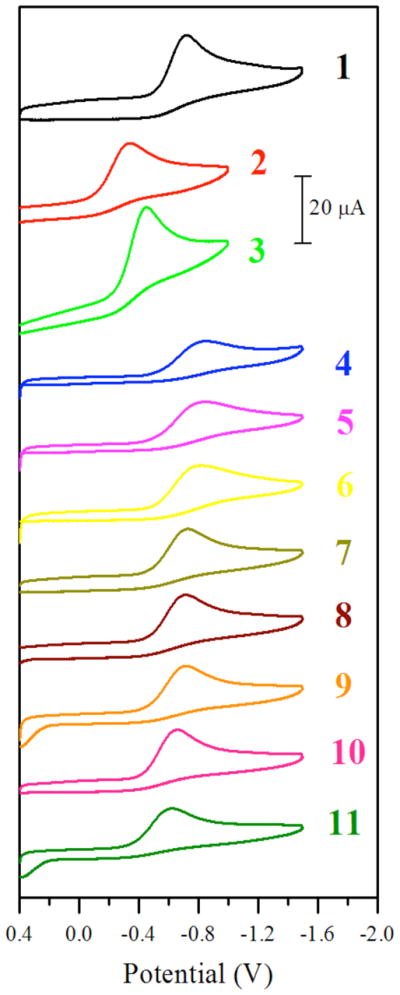
Cyclic voltammograms of 1 – 11. Data obtained for 2 mM solutions of the complexes in DMF with 0.1 M (n-Bu4N)PF6 as the supporting electrolyte. The scan rate was 100 mV/s.
For a given set of equatorial ligands on a platinum(IV) center, the reduction potential in water predictably changes as the axial ligands are varied.18, 66 Trifluoracetate ligands produce the most easily reduced (highest redox potential) platinum(IV) complexes, followed by chloride ligands, and then acetate ligands in that order. Axial hydroxo ligands, although not investigated here, give rise to platinum(IV) complexes that are even more difficult to reduce than those with acetate ligands. For example, the precursor complex c,c,t-[Pt(NH3)2Cl2(OH)2] is reported to have a very negative peak potential at −880 mV in aqueous media.66 In moving from water to DMF, we find here that this general trend still exists for the chloride and carboxylate ligands, as Ep(2) > Ep(3) > Ep(1). The peak potentials themselves, however, are shifted significantly from those measured in water. In water, the measured peak potentials of 1 and 3 have been determined by others to be −635 and −260 mV, respectively,66 and the peak potential of 8 was measured to be 5 mV (Figure S3). In DMF, these potentials are −722 (1), −345 (2), and −454 (3) mV, indicating that this solvent change decreases the reduction potential by up to 300 mV. Even though the potentials measured in DMF are shifted significantly from those measured in aqueous solution, a comparison of peak potentials for the carbamate complexes 4 – 11 to those for 1 – 3 is valuable for understanding the relative stability of the complexes in the biological milieu.
Compounds 7 – 9 display nearly identical peak potentials near −720 mV. This similarity indicates that electron-donating groups in the para position of the aryl carbamate ligands have little effect on the redox potentials of these compounds. Notably, the peak potentials of these compounds are indistinguishable from that of 1. Thus the aryl carbamate ligands confer the same degree of stabilization to the +4 oxidation state as the acetate ligand. Compound 10 exhibits a higher peak potential at −655 mV. This higher potential is attributed to the electron-withdrawing fluorine atom on the aromatic ring of the carbamate ligand, which favors reduction. The least negative peak potential of the series, at −625 mV, is displayed by the naphthyl carbamate complex 11. The reason for 11 having a peak potential ≥100 mV more positive than those of 7 – 9 is not entirely clear. A possible explanation is that the increased steric bulk from the large naphthyl group favors ligand dissociation and consequently reduction. The alkyl carbamates 4 – 6 have peak potentials between −820 and −850 mV. The alkyl substituents on the carbamate ligand stabilize the +4 oxidation state by about 100 mV relative to the aryl substituents. This observation indicates that the alkyl carbamates are stronger electron donors and are more capable of stabilizing the electron-poor +4 oxidation state than the aryl carbamates.
Theoretical Calculations
Geometry optimizations were carried out for 1 – 11 at the DFT B3LYP theoretical level. For the carbamate complexes, 4 – 11, geometry optimizations were computed only for the anti/anti isomers (Chart 1). Although no symmetry restraints were placed on the geometry optimizations, all optimized structures attained nearly perfect C2v symmetry with the principal 2-fold axis bisecting the Cl–Pt–Cl and NH3–Pt–NH3 angles in the equatorial plane. In this configuration, intramolecular hydrogen bonding occurs between the oxygen atom of the carbamate ligands and both of the coordinated ammine ligand, as observed experimentally in several of the crystal structures.
The frontier molecular orbits (FMOs) of 1 – 3 are shown in a qualitative molecular orbital diagram in Figure 6. The expected two-over-three d-orbital splitting for a nearly octahedral transition metal complex is predicted by these computations. The LUMO and LUMO+1 are nearly degenerate and are dz2 and dxy σ* in character. The HOMO to HOMO-3 molecular orbitals are also close in energy. These orbitals are dx2-y2, dxz, and dyz π*, and Cl 3p non-bonding in character. The HOMO-LUMO gaps of 1, 2, and 3 are 4.16, 3.97, and 3.70 eV respectively. These values correspond to the magnitude of the d-orbital splitting and reflect the ordering of the acetate, trifluoroacetate, and chloride ligands in the spectrochemical series.
Figure 6.

Qualitative molecular orbital diagrams for 1 (left), 2 (middle), and 3 (right).
The FMOs of 6, 7, and 11 are shown in the qualitative molecular orbital diagram in Figure 7. The FMOs of the other alkyl carbamate complexes, 4 and 5, are qualitatively similar to those of 6, as are the FMOs of the other aryl carbamate complexes, 8 – 10, to complex 7. Like 1 – 3, the LUMO and LUMO+1 of the carbamate complexes are dz2 and dxy σ* in character. The HOMOs, however, are ligand-localized π orbitals. The presence of these orbitals leads to smaller HOMO-LUMO gaps for the aryl carbamate complexes, which range from 2.52 – 2.99 eV, compared to those of 1 – 3. This result is consistent with the observation that 7 – 11 are sensitive to light. The smaller HOMO-LUMO gap may render dissociative excited states accessible by the energy provided by visible light.
Figure 7.

Qualitative molecular orbital diagram for 6 (left), 7 (middle), and 11 (right).
The gas-phase adiabatic electron affinities of 1, 2, and 4 – 11 were computed by optimizing the geometry of the 1-electron reduced Pt(III) species as a doublet anion, and then subtracting its total energy from the neutral Pt(IV) species. The results are summarized subtracting its total energy from the neutral Pt(IV) species. The results are summarized in Table 6. The optimized geometries of the Pt(III) species give rise to stationary points on the potential energy surface, as evidenced by the lack of imaginary frequencies except in the case of 3. A comparison of geometrical parameters of the calculated Pt(IV) and Pt(III) structures is presented in Table 6. Upon reduction to Pt(III), two mutually trans bond are elongated significantly whereas the other bonds are only altered slightly. This result is expected, for the addition of another electron to the closed-shell Pt(IV) species would require population of an antibonding orbital. For most cases, the axial platinum-carbamate bond is lengthened by approximately 0.4 Å in the Pt(III) complex, which is consistent with the conventional view of Pt(IV) reduction depicted in Scheme 1. For 6 – 8, however, significant bond elongation occurs for the equatorial, mutually trans platinum-chloride and platinum-ammine bonds. These bonds are elongated by approximately 0.34 Å. This result suggests that in some cases elimination of the equatorial ligands may be a viable reductive pathway of platinum(IV) and is consistent with experimental observation of this pathway by others.67–69 The computed gas phase adiabatic electron affinities correlate well with the observed peak potentials for reduction. In Figure 8, the peak potentials are plotted as a function of the electron affinity. The relationship is roughly linear (R2 = 0.887) and, as expected, larger electron affinities correlate with more positive peak potentials.
Table 6.
Computed Adiabatic Electron Affinities and the Difference in Computed Interatomic Distances between the Neutral Pt(IV) Complex and the Anionic Pt(III) Complexa
| Compound | Electron Affinity, eV | Δd, Å | |||||
|---|---|---|---|---|---|---|---|
| Pt–Cl1 | Pt–Cl2 | Pt–N1 | Pt–N2 | Pt–O1 | Pt–O2 | ||
| 1 | 2.754 | 0.03021 | 0.03005 | −0.01439 | −0.01425 | 0.39707 | 0.39701 |
| 2 | 3.791 | 0.02479 | 0.02553 | −0.02139 | −0.02078 | 0.40872 | 0.41175 |
| 4 | 2.576 | 0.02695 | 0.02698 | −0.00836 | −0.00832 | 0.39533 | 0.39631 |
| 5 | 2.570 | 0.02719 | 0.02718 | −0.00791 | −0.00790 | 0.39420 | 0.39422 |
| 6 | 2.321 | 0.36070 | 0.03682 | −0.01119 | 0.33653 | 0.02840 | 0.02918 |
| 7 | 2.683 | 0.33739 | 0.03196 | −0.01319 | 0.33328 | 0.03518 | 0.03507 |
| 8 | 2.631 | 0.33878 | 0.03234 | −0.01287 | 0.33366 | 0.03467 | 0.03458 |
| 9 | 2.901 | 0.02454 | 0.02454 | −0.00784 | −0.00787 | 0.39023 | 0.39024 |
| 10 | 3.129 | 0.02412 | 0.02419 | −0.00897 | −0.00884 | 0.39158 | 0.39165 |
| 11 | 3.060 | 0.02305 | 0.02306 | −0.00790 | −0.00792 | 0.39017 | 0.39028 |
Figure 8.
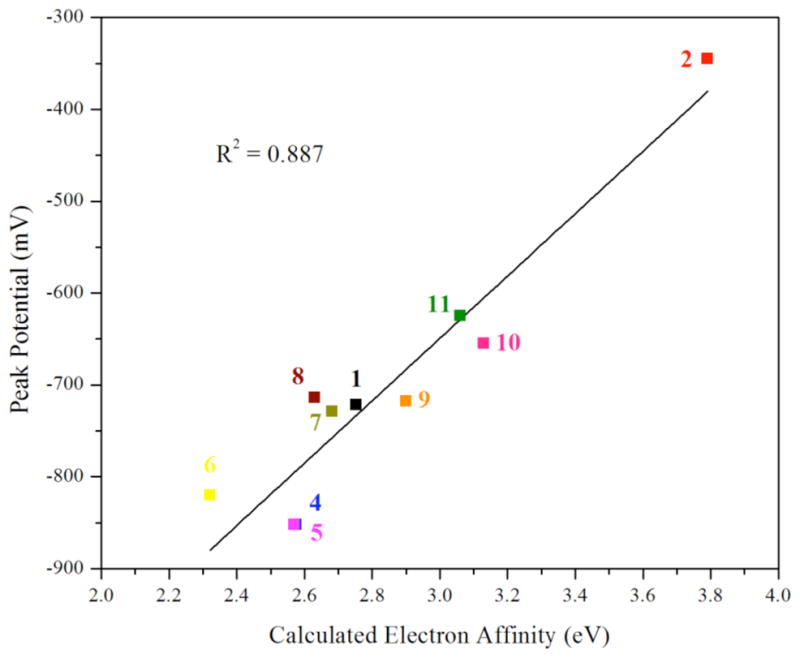
Plot of the computed adiabatic electron affinity versus the experimentally measured reduction peak potentials. The black line is the least squares best fit through of the data.
Biological Properties
The cytotoxicities of compounds 4 – 11 and cisplatin against human lung carcinoma (A549) and human normal lung (MRC-5) cells were measured by the MTT assay. The results are shown in Table 7, and dose-response curves can be found in Figures S4 and S5. In A549 cells, most of the platinum(IV) carbamates exhibit a level of cytotoxicity that is similar to that of cisplatin. The IC50 values range from 3 to 6.7 μM, compared to an IC50 of 7.0 μM for cisplatin. Compounds 4 and 5, bearing tert-butyl and cyclopentyl carbamate ligands, showed greater cytoxicity than the other compounds, the IC50 values being 1.0 and 0.6 μM, respectively. In the non-cancerous lung fibroblasts (MRC-5), all the complexes, except for 4 and 5, were slightly less cytotoxic than cisplatin. The IC50 of cisplatin in this cell line was 4.3 μM and those of 6 – 11 ranged from 4.8 to 16.0 μM. The cytotoxicities of 4 and 5 in the lung fibroblasts were marked by IC50 values of 2.8 and 2.3 μM, indicating that they are approximately a factor of 2 less cytotoxic in the healthy cells compared to the cancerous cells, as observed for the other carbamate complexes. The results here demonstrate that, like the platinum(IV) complexes bearing axial chloro, hydroxo, and acetato ligands, this newly synthesized class of platinum(IV) complexes bearing axial carbamato ligands are also viable anticancer drug candidates.
Table 7.
Cytotoxicities of Cisplatin and 4 – 11 in A549 and MRC-5 Cells
| compound | IC50 (μM)a |
|
|---|---|---|
| A549 | MRC-5 | |
| 4 | 1.0 ± 0.3 | 2.8 ± 0.8 |
| 5 | 0.6 ± 0.3 | 2.3 ± 0.7 |
| 6 | 6.7 ± 2.9 | 12.7 ± 3.5 |
| 7 | 6.7 ± 2.1 | 16.0 ± 6.6 |
| 8 | 3.0 ± 1.0 | 5.1 ± 1.8 |
| 9 | 5.3 ± 2.5 | 9.3 ± 3.2 |
| 10 | 3.7 ± 1.2 | 7.6 ± 3.1 |
| 11 | 4.3 ±1.5 | 4.8 ± 0.3 |
| cisplatin | 7.0 ± 2.6 | 4.3 ± 1.3 |
IC50 values, the concentrations of platinum where cell growth is inhibited by 50% compared to controls run in the absence of added complexes, measured by the MTT assay following a 72-h exposure. Values are the average of at least three independent experiments, and the reported errors are the corresponding standard deviations.
Conclusions
The synthesis of eight new platinum(IV) carbamate complexes is described. The general reactivity of both aryl and alkyl isocyanates with the important platinum(IV) synthon, c,c,t-[Pt(NH3)2Cl2(OH)2], provides a valuable synthetic methodology for the design of new platinum(IV) complexes with novel properties. It also offers a route for the functionalization of isocyanate-bearing nanomaterials through the formation of a platinum carbamate bond. In contrast to the more common platinum(IV) carboxylate complexes, platinum(IV) carbamates adopt different isomeric forms depending on the rotational orientation of the ligand, as revealed by NMR spectroscopy and X-ray crystallography, and their ligand-based orbitals are intermediate in energy between those of the empty and filled metal d-orbitals, as determined by DFT calculations. Electrochemical studies of the platinum(IV) carbamates reveal redox potentials similar to those of the platinum(IV) acetates, such as satraplatin. This result suggests that platinum(IV) carbamate complexes should exhibit similar stability properties in biological milieu as the acetate complexes. The fact that the platinum(IV) carbamates display cytotoxicities similar to or better than cisplatin reveals their therapeutic potential. Finally, DFT computational analyses indicate that the redox potential of platinum(IV) complexes can be correlated with their computed electron affinities, corroborating experimentally deduced reduction pathways.
Supplementary Material
Acknowledgments
This work was supported by Grant CA034992 from the National Cancer Institute. Spectroscopic instrumentation at the MIT DCIF is maintained with funding from NIH Grant 1S10RR13886-01.
Footnotes
Supporting Information Available: X-ray crystallographic data in CIF format, crystal growth and refinement details, crystallographic data collection and refinement parameters for 2 (Table S1), selected interatomic distances and angles for 2 (Table S2), XYZ coordinates, energies, and lowest frequencies for all geometry optimized compounds (Tables S3 – S23), VT-NMR spectra of 6 (Figure S1), ORTEP diagram of 2 (Figure S2), cyclic voltammogram of 2 in water (Figure S3), and dose-response curves for A549 (Figure S4) and MRC-5 cells (Figure S5). This material is available free of charge via the Internet at http://pubs.acs.org.
References
- 1.Kelland L. Nat Rev Cancer. 2007;7:573–584. doi: 10.1038/nrc2167. [DOI] [PubMed] [Google Scholar]
- 2.Bancroft DP, Lepre CA, Lippard SJ. J Am Chem Soc. 1990;112:6860–6871. [Google Scholar]
- 3.Davies MS, Berners-Price SJ, Hambley TW. Inorg Chem. 2000;39:5603–5613. doi: 10.1021/ic000847w. [DOI] [PubMed] [Google Scholar]
- 4.Takahara PM, Rosenzweig AC, Frederick CA, Lippard SJ. Nature. 1995;377:649–652. doi: 10.1038/377649a0. [DOI] [PubMed] [Google Scholar]
- 5.Spingler B, Whittington DA, Lippard SJ. Inorg Chem. 2001;40:5596–5602. doi: 10.1021/ic010790t. [DOI] [PubMed] [Google Scholar]
- 6.Silverman AP, Bu W, Cohen SM, Lippard SJ. J Biol Chem. 2002;277:49743–49749. doi: 10.1074/jbc.M206979200. [DOI] [PubMed] [Google Scholar]
- 7.Todd RC, Lippard SJ. J Inorg Biochem. 2010;104:902–908. doi: 10.1016/j.jinorgbio.2010.04.005. [DOI] [PMC free article] [PubMed] [Google Scholar]
- 8.Jung Y, Lippard SJ. Chem Rev. 2007;107:1387–1407. doi: 10.1021/cr068207j. [DOI] [PubMed] [Google Scholar]
- 9.Todd RC, Lippard SJ. Metallomics. 2009;1:280–291. doi: 10.1039/b907567d. [DOI] [PMC free article] [PubMed] [Google Scholar]
- 10.Daugaard G, Abildgaard U. Cancer Chemother Pharmacol. 1989;25:1–9. doi: 10.1007/BF00694330. [DOI] [PubMed] [Google Scholar]
- 11.Cvitkovic E. Cancer Treat Rev. 1998;24:265–281. doi: 10.1016/s0305-7372(98)90061-5. [DOI] [PubMed] [Google Scholar]
- 12.Screnci D, McKeage MJ. J Inorg Biochem. 1999;77:105–110. doi: 10.1016/s0162-0134(99)00135-x. [DOI] [PubMed] [Google Scholar]
- 13.Hall MD, Hambley TW. Coord Chem Rev. 2002;232:49–67. [Google Scholar]
- 14.Hall MD, Dolman RC, Hambley TW. Met Ions Biol Syst. 2004;42:297–322. [PubMed] [Google Scholar]
- 15.Hall MD, Mellor HR, Callaghan R, Hambley TW. J Med Chem. 2007;50:3403–3411. doi: 10.1021/jm070280u. [DOI] [PubMed] [Google Scholar]
- 16.Wheate NJ, Walker S, Craig GE, Oun R. Dalton Trans. 2010;39:8113–8127. doi: 10.1039/c0dt00292e. [DOI] [PubMed] [Google Scholar]
- 17.Ellis LT, Er HM, Hambley TW. Aust J Chem. 1995;48:793–806. [Google Scholar]
- 18.Choi S, Filotto C, Bisanzo M, Delaney S, Lagasee D, Whitworth JL, Jusko A, Li C, Wood NA, Willingham J, Schwenker A, Spaulding K. Inorg Chem. 1998;37:2500–2504. [Google Scholar]
- 19.Battle AR, Deacon GB, Dolman RC, Hambley TW. Aust J Chem. 2002;55:699–704. [Google Scholar]
- 20.Platts JA, Hibbs DE, Hambley TW, Hall MD. J Med Chem. 2001;44:472–474. doi: 10.1021/jm001080k. [DOI] [PubMed] [Google Scholar]
- 21.Gramatica P, Papa E, Luini M, Monti E, Gariboldi MB, Ravera M, Gabano E, Gaviglio L, Osella D. J Biol Inorg Chem. 2010;15:1157–1169. doi: 10.1007/s00775-010-0676-4. [DOI] [PubMed] [Google Scholar]
- 22.Reithofer MR, Bytzek AK, Valiahdi SM, Kowol CR, Groessl M, Hartinger CG, Jakupec MA, Galanski M, Keppler BK. J Inorg Biochem. 2011;105:46–51. doi: 10.1016/j.jinorgbio.2010.09.006. [DOI] [PubMed] [Google Scholar]
- 23.Barnes KR, Kutikov A, Lippard SJ. Chem Biol. 2004;11:557–564. doi: 10.1016/j.chembiol.2004.03.024. [DOI] [PubMed] [Google Scholar]
- 24.Mukhopadhyay S, Barnés CM, Haskel A, Short SM, Barnes KR, Lippard SJ. Bioconjugate Chem. 2008;19:39–49. doi: 10.1021/bc070031k. [DOI] [PMC free article] [PubMed] [Google Scholar]
- 25.Dhar S, Lippard SJ. Proc Natl Acad Sci U S A. 2009;106:22199–22204. doi: 10.1073/pnas.0912276106. [DOI] [PMC free article] [PubMed] [Google Scholar]
- 26.Ang WH, Khalaila I, Allardyce CS, Juillerat-Jeanneret L, Dyson PJ. J Am Chem Soc. 2005;127:1382–1383. doi: 10.1021/ja0432618. [DOI] [PubMed] [Google Scholar]
- 27.Reithofer MR, Valiahdi SM, Galanski M, Jakupec MA, Arion VB, Keppler BK. Chem Biodivers. 2008;5:2160–2170. doi: 10.1002/cbdv.200890197. [DOI] [PubMed] [Google Scholar]
- 28.Feazell RP, Nakayama-Ratchford N, Dai H, Lippard SJ. J Am Chem Soc. 2007;129:8438–8439. doi: 10.1021/ja073231f. [DOI] [PMC free article] [PubMed] [Google Scholar]
- 29.Dhar S, Liu Z, Thomale J, Dai HJ, Lippard SJ. J Am Chem Soc. 2008;130:11467–11476. doi: 10.1021/ja803036e. [DOI] [PMC free article] [PubMed] [Google Scholar]
- 30.Rieter WJ, Pott KM, Taylor KML, Lin W. J Am Chem Soc. 2008;130:11584–11585. doi: 10.1021/ja803383k. [DOI] [PubMed] [Google Scholar]
- 31.Dhar S, Daniel WL, Giljohann DA, Mirkin CA, Lippard SJ. J Am Chem Soc. 2009;131:14652–14653. doi: 10.1021/ja9071282. [DOI] [PMC free article] [PubMed] [Google Scholar]
- 32.Taylor-Pashow KML, Rocca JD, Xie Z, Tran S, Lin W. J Am Chem Soc. 2009;131:14261–14263. doi: 10.1021/ja906198y. [DOI] [PMC free article] [PubMed] [Google Scholar]
- 33.Aryal S, Hu C-MJ, Zhang L. ACS Nano. 2010;4:251–258. doi: 10.1021/nn9014032. [DOI] [PMC free article] [PubMed] [Google Scholar]
- 34.Duong HTT, Huynh VT, de Souza P, Stenzel MH. Biomacromolecules. 2010;11:2290–2299. doi: 10.1021/bm100396s. [DOI] [PubMed] [Google Scholar]
- 35.Min Y, Mao C, Xu D, Wang J, Liu Y. Chem Commun. 2010;46:8424–8426. doi: 10.1039/c0cc03108a. [DOI] [PubMed] [Google Scholar]
- 36.Giandomenico CM, Abrams MJ, Murrer BA, Vollano JF, Rheinheimer MI, Wyer SB, Bossard GE, Higgins JD., III Inorg Chem. 1995;34:1015–1021. doi: 10.1021/ic00109a004. [DOI] [PubMed] [Google Scholar]
- 37.Barnard CFJ, Vollano JF, Chaloner PA, Dewa SZ. Inorg Chem. 1996;35:3280–3284. doi: 10.1021/ic951548n. [DOI] [PubMed] [Google Scholar]
- 38.Galanski M, Keppler BK. Inorg Chem. 1996;35:1709–1711. doi: 10.1021/ic9509490. [DOI] [PubMed] [Google Scholar]
- 39.Galanski M, Keppler BK. Inorg Chim Acta. 1997;265:271–274. [Google Scholar]
- 40.Ang WH, Pilet S, Scopelliti R, Bussy F, Juillerat-Jeanneret L, Dyson PJ. J Med Chem. 2005;48:8060–8069. doi: 10.1021/jm0506468. [DOI] [PubMed] [Google Scholar]
- 41.Reithofer M, Galanski M, Roller A, Keppler BK. Eur J Inorg Chem. 2006:2612–2617. [Google Scholar]
- 42.Reithofer MR, Valiahdi SM, Jakupec MA, Arion VB, Egger A, Galanski M, Keppler BK. J Med Chem. 2007;50:6692–6699. doi: 10.1021/jm070897b. [DOI] [PubMed] [Google Scholar]
- 43.Kelland LR, Barnard CFJ, Evans IG, Murrer BA, Theobald BRC, Wyer SB, Goddard PM, Jones M, Valenti M, Bryant A, Rogers PM, Harrap KR. J Med Chem. 1995;38:3016–3024. doi: 10.1021/jm00016a004. [DOI] [PubMed] [Google Scholar]
- 44.Hall MD, Dillon CT, Zhang M, Beale P, Cai ZH, Lai B, Stampfl APJ, Hambley TW. J Biol Inorg Chem. 2003;8:726–732. doi: 10.1007/s00775-003-0471-6. [DOI] [PubMed] [Google Scholar]
- 45.Davies MS, Hall MD, Berners-Price SJ, Hambley TW. Inorg Chem. 2008;47:7673–7680. doi: 10.1021/ic8006734. [DOI] [PubMed] [Google Scholar]
- 46.APEX2 2008-40. Bruker AXS, Inc; Madison, WI: 2008. [Google Scholar]
- 47.Sheldrick GM. SADABS: Area-Detector Absorption Correction. University of Göttingen; Göttingen, Germany: 2008. [Google Scholar]
- 48.Sheldrick GM. SHELXTL-97. Vol. 6.14. University of Göttingen; Göttingen, Germany: 2000. [Google Scholar]
- 49.Sheldrick GM. Acta Crystallogr Sect A. 2008;64:112–122. doi: 10.1107/S0108767307043930. [DOI] [PubMed] [Google Scholar]
- 50.Spek AL. PLATON, A Multipurpose Crystallographic Tool. Utrecht University; Utrecht, The Netherlands: 2008. [Google Scholar]
- 51.Müller P. Crystallogr Rev. 2009;15:57–83. [Google Scholar]
- 52.Frisch MJ, Trucks GW, Schlegel HB, Scuseria GE, Robb MA, Cheeseman JR, Montgomery JAJ, Vreven T, Kudin KN, Burant JC, Millam JM, Iyengar SS, Tomasi J, Barone V, Mennucci B, Cossi M, Scalmani G, Rega N, Petersson GA, Nakatsuji H, Hada M, Ehara M, Toyota K, Fukuda R, Hasegawa J, Ishida M, Nakajima T, Honda Y, Kitao O, Nakai H, Klene M, Li X, Knox JE, Hratchian HP, Cross JB, Bakken V, Adamo C, Jaramillo J, Gomperts R, Stratmann RE, Yazyev O, Austin AJ, Cammi R, Pomelli C, Ochterski JW, Ayala PY, Morokuma K, Voth GA, Salvador P, Dannenberg JJ, Zakrzewski VG, Dapprich S, Daniels AD, Strain MC, Farkas O, Malick DK, Rabuck AD, Raghavachari K, Foresman JB, Ortiz JV, Cui Q, Baboul AG, Clifford S, Cioslowski J, Stefanov BB, Liu G, Liashenko A, Piskorz P, Komaromi I, Martin RL, Fox DJ, Keith T, Al-Laham MA, Peng CY, Nanayakkara A, Challacombe M, Gill PMW, Johnson B, Chen W, Wong MW, Gonzalez C, Pople JA. Gaussian 03, Revision D.01. Gaussian, Inc; Wallingford, CT: 2004. [Google Scholar]
- 53.Lee C, Yang W, Parr RG. Phys Rev B. 1988;37:785–789. doi: 10.1103/physrevb.37.785. [DOI] [PubMed] [Google Scholar]
- 54.Becke AD. J Chem Phys. 1993;98:5648–5652. [Google Scholar]
- 55.Hehre WJ, Ditchfield R, Pople JA. J Chem Phys. 1972;56:2257–2261. [Google Scholar]
- 56.Hay PJ, Wadt WR. J Chem Phys. 1985;82:299–310. [Google Scholar]
- 57.Berners-Price SJ, Ronconi L, Sadler PJ. Prog Nucl Magn Reson Spectrosc. 2006;49:65–98. [Google Scholar]
- 58.Pregosin PS. Coord Chem Rev. 1982;44:247–291. [Google Scholar]
- 59.Still BM, Kumar PGA, Aldrich-Wright JR, Price WS. Chem Soc Rev. 2007;36:665–686. doi: 10.1039/b606190g. [DOI] [PubMed] [Google Scholar]
- 60.Cohen SM, Brown TH. J Chem Phys. 1974;61:2985–2986. [Google Scholar]
- 61.Gummin DD, Ratilla EMA, Kostić NM. Inorg Chem. 1986;25:2429–2433. [Google Scholar]
- 62.Galbraith JA, Menzel KA, Ratilla EMA, Kostić NM. Inorg Chem. 1987;26:2073–2078. [Google Scholar]
- 63.Norman RE, Ranford JD, Sadler PJ. Inorg Chem. 1992;31:877–888. [Google Scholar]
- 64.Scaffidi-Domianello YY, Meelich K, Jakupec MA, Arion VB, Kukushkin VY, Galanski M, Keppler BK. Inorg Chem. 2010;49:5669–5678. doi: 10.1021/ic100584b. [DOI] [PubMed] [Google Scholar]
- 65.Dolman RC, Deacon GB, Hambley TW. J Inorg Biochem. 2002;88:260–267. doi: 10.1016/s0162-0134(01)00360-9. [DOI] [PubMed] [Google Scholar]
- 66.Hall MD, Amjadi S, Zhang M, Beale PJ, Hambley TW. J Inorg Biochem. 2004;98:1614–1624. doi: 10.1016/j.jinorgbio.2004.05.017. [DOI] [PubMed] [Google Scholar]
- 67.Beattie JK, Starink J. Inorg Chem. 1975;14:996–999. [Google Scholar]
- 68.Gibson D. Dalton Trans. 2009. pp. 10681–10689. [DOI] [PubMed] [Google Scholar]
- 69.Nemirovski A, Vinograd I, Takrouri K, Mijovilovich A, Rompel A, Gibson D. Chem Commun. 2010;46:1842–1844. doi: 10.1039/b925721g. [DOI] [PubMed] [Google Scholar]
Associated Data
This section collects any data citations, data availability statements, or supplementary materials included in this article.