Summary
We describe the construction and performance of an NMR tube with a magnetic susceptibility matched sample cavity that confines the solution within the detection zone in the axial direction and in a quasi-rectangular region in the radial direction. The slot-like sample cavity provides both good sample volume efficiency and tolerance to sensitivity loss in the sample space. The signal-to-noise ratio per unit volume of the constructed tube was 2.2 times higher than that of a cylindrical tube of 5 mm outer diameter with a sample containing 300 mM NaCl at a static magnetic field of 14.1 T. Even the overall signal-to-noise ratio of the slot tube was 35% higher than that of the conventional 5 mm tube for a sample containing 300 mM NaCl. Similar improvements over existing sample tube geometries were obtained at 950 MHz. Moreover the temperature rise resulting from RF heating was found to be significantly lower for the slot tube even when compared to 3 and 4 mm outer diameter cylindrical tubes as measured in a 5 mm cryoprobe. A further advantage of this type of tube is that a sample cavity of any desired size and shape can be formed within a cylindrical tube for use in a single cryogenic probe.
1. Introduction
Over the past twenty years, the sensitivity of NMR signal detection has greatly increased owing to improved RF electronics and the advent of cryogenic probe technology [1–3]. In addition, on-going development of higher field magnets promises further improvements. However, ionic conductivity and dielectric losses with cryogenic probes at high magnetic field strengths severely limit the NMR sensitivity of aqueous solutions containing salt [4–6]. Optimization of sample tube design has recently begun to be appreciated as an approach to mitigating sensitivity losses.
When a cylindrical tube is placed in a Helmholtz probe, the magnitude of RF power dissipation varies widely within the sample space. In a radial cross section of the tube, the power dissipation increases with distance from the center of the tube along a direction perpendicular to the B1 field, resulting in the highest power dissipation at the edge regions [7]. Because the hot spots of RF power dissipation make a significant contribution to sensitivity loss and sample heating [8], the use of a cylindrical tube with smaller diameter or a tube in the shape of rectangle or oval reduces the effect [7, 9, 10]. For samples containing high salt, the signal-to-noise ratio (SNR) for a solution at a given concentration may not decrease appreciably, despite the fact that a smaller volume is used. For NMR analysis of quantity-limited samples, such sample tubes offer distinct advantages.
Here we describe the design and construction of a cylindrical sample tube containing a slot-shaped sample cavity fabricated from glass whose magnetic susceptibility matches to sample solvent (SM-glass). The susceptibility-matched material serves as an alternative to sample solvent and can be used to form the intended sample space [11]. In the slot tube design, SM-glass confines the sample within the detection zone in the axial direction as in a conventional Shigemi tube and two segment-shaped SM-glass pieces within the detection zone produce a quasi-rectangular shaped sample cavity. When the sample slot is properly oriented in a NMR probe. the design mitigates RF power dissipation in lossy samples [7]. We compare the performance of this tube to those of other types of sample tube. Because slot-shaped cavities of different size can be accommodated within a 5 mm cylinder, this basic design can be used to fabricate sample tubes for a variety of sample volumes.
2. Experimental
2.1 Construction of the slot tube
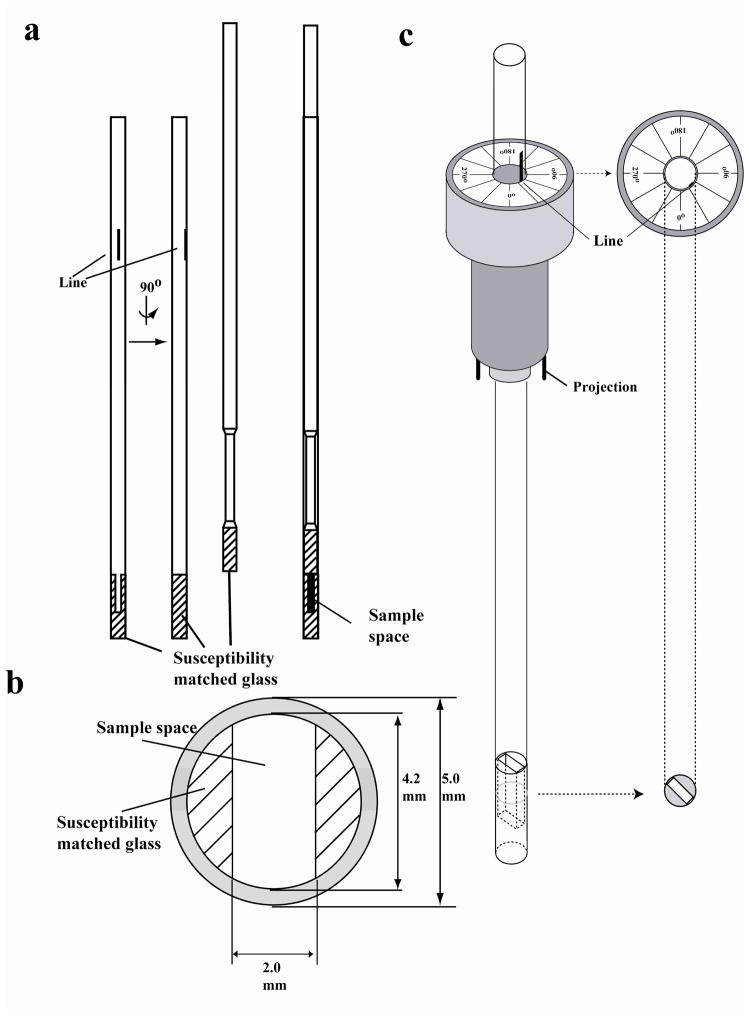
The slot tube (Fig. 1a) is composed of outer tube and a plunger as in microtubes manufactured by Shigemi Inc. The outer tube has an outside diameter of 5.0 mm, and the sample cavity is fabricated by using SM-glass in its bottom (Fig. 1b). The cross-section of the sample cavity in the radial direction has straight sides and arc shaped short ends and is approximately rectangular. The slot is 2 mm wide and 20 mm high. The plunger (Fig. 1a) has a SM-glass tip that forms the top of the sample cavity. The slot tubes will soon be commercially available from Shigemi Inc. A customized sample holder was initially fabricated from a standard 5-mm spinner by the mechanical workshop at Goethe University (Frankfurt) using a Bruker shaped-tube sample holder as a guideline and later by Bruker BioSpin, with pins projecting from its bottom that engage the sample positioning unit in the probe (Bruker BioSpin); the two projections fit into two holes located on the top of the NMR probe. The slot is oriented at the desired angle by aligning a line on the lateral surface with markings on the top of the tube holder (Fig. 1b, c).
Figure 1. Design of the slot tube.
The slot tube is composed of an outer tube and a plunger (a). In the outer tube, the bottom beneath the sample space is filled with susceptibility matched glass. Above it, two segment-shaped susceptibility matched glass pieces create a quasi-rectangular sample space (b). The sample cavity is covered by the plunger made of susceptibility matched glass. In the present study, the sample space was 2.0 mm in width and 20 mm in height, but these dimensions can be changed to alter the sample volume. A sample positioning unit (Bruker BioSpin) serves to orient the sample cavity in the NMR probe. The tailored sample holder has two projections in its bottom that insert into holes in the top of the probe. The top of the spinner is labeled with angle relative to the B1 field and A line on the side of the tube marks the long axis of the slot, and the tube is rotated to align this line with the desired angle mark on the top of the sample holder (c).
2.2 Sample preparation
A sample solution was prepared that contained 0.3 mM [U-13C, 15N]-chlorella ubiquitin (Chlorella Industry Co. Ltd., Tokyo, Japan) in 10 mM sodium phosphate (pH 6.6) in H2O/D2O = 90/10. A similar sample containing 0.3 mM of [U-13C, 15N]-chlorella ubiquitin and 300 mM NaCl was used in comparing the performance of cylindrical microtubes (Shigemi) with different diameters: 3 mm outer diameter (2.5 mm i.d.) and 4 mm outer diameter (3.2 mm i.d.). For both microtubes, the height of the solution space was adjusted to 20 mm. A set of four ubiquitin samples was prepared containing 0.3 mM protein in H2O/D2O = 90/10 with NaCl concentrations of 0, 100, 200 and 300 mM. These solutions were used in comparing the performance of three NMR tubes: the slot tube, a 5 mm o.d. microtube (Shigemi), and an oval-shaped tube (Bruker BioSpin). The height of the solution space was adjusted to 20 mm by inserting the plunger in the microtube and to 40 mm in the oval-shaped tube.
2.3 NMR experiments and analysis
NMR experiments were performed on a DRX600 spectrometer (Bruker BioSpin; 600.2 MHz for 1H) or a Av950 spectrometer (Bruker BioSpin; 950.1 MHz for 1H) at 25°C. Both spectrometers were equipped with a TCI cryogenic probe with a sample positioning unit (Bruker BioSpin): two holes on the head of probe accommodate corresponding projections underneath the customized sample holder (Fig. 1c). In the 1H 1D NMR experiments, the water peak was suppressed by pre-saturation with a RF transmitter output of 0.4 W. In TROSY-HSQC experiments [12], a flip-back pulse sequence was used to achieve water peak suppression. The 1H pulse length was determined for each experimental condition, and thus the 1H pulse excitation profile differed slightly among the experiments. The effects of pulse imperfections on the intensities of signals far from the carrier frequency were not considered in data analysis. In the experiments at 14.1 T, the data size and spectral width were 512 (256) (t1) × 1024 (512) (t2) (complex) points and 2100 Hz (ω1, 15N) × 9600 Hz (ω2, 1H), respectively, and the number of scans/FID was 2. The 15N and 1H carrier frequencies were 117.5 ppm and 4.7 ppm, respectively. The repetition time was 1 s. In the experiments at 22.3 T, the data size and spectral width were 512 (t1) × 2048 (t2) points and 2100 Hz (ω1, 15N) × 7200 Hz (ω2, 1H), respectively, and the number of scans/FID was 2. The 15N and 1H carrier frequencies were 117.5 ppm and 4.7 ppm, respectively. The repetition time was 1 s. The data were processed by TopSpin software (Bruker BioSpin). The data sets were zero-filled in the direct and indirect dimensions to 4096 (F1) × 1024 (F2), and a QSINE window with SSB=2 was applied in both F1 and F2 directions. The 1H-15N TROSY-HSQC peak patterns obtained with the slot tube and cylindrical tubes were identical for samples at a given salt concentration, but the positions of most peaks exhibited a small dependence on salt concentration, probably due to a subtle alteration of conformation and/or dynamics. Peak intensities were evaluated for 6 residues in the Lys27 – Lys32 α-helix region from 1D slices in the 1H dimension at each salt concentration. The noise level was evaluated from the spectral region from 3 to −1 ppm, in which no peak is present. The “SINOCAL” command in TopSpin software (Bruker BioSpin) was used to determine the SNR.
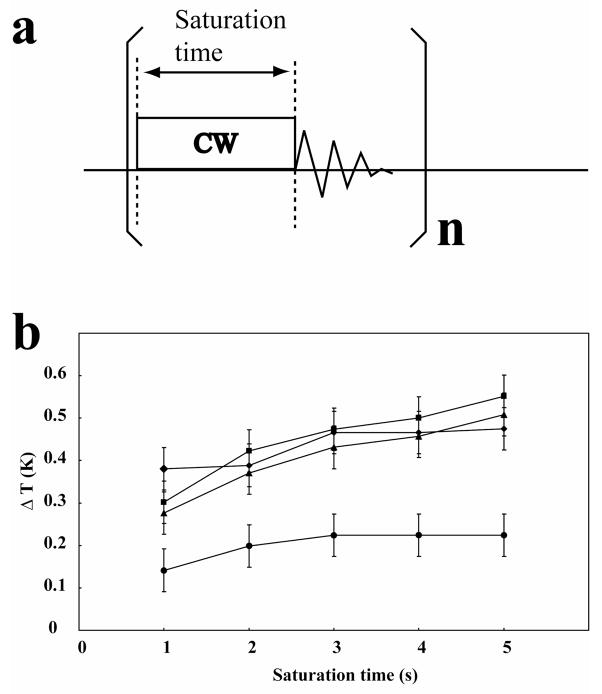
RF sample heating for the slot tube and the 3, 4, and 5 mm o.d. mirotubes (20 mm sample height in each case) was evaluated by monitoring the increase in sample temperature of 99 % D2O water containing 1 mM DSS and 300 mM NaCl (pH 4.8) following continuous wave irradiation with a RF transmitter output power of 0.4 W at 1H frequency of 30 ppm for variable times. The experiments were performed on a DRX600 NMR spectrometer equipped with a TCI cryogenic probe at 25 °C. Following the application of 32 dummy pulses, the 1H 1D spectrum was acquired as 2 transients. The increase in sample temperature was determined from the chemical shift difference between the HDO peak and the methyl peaks of 4,4-dimethyl-4-silapentane-1-sulfonic acid (DSS) [13] according to ΔT = 86.2 × Δδ, where ΔT is the increase in temperature in Kelvin unit and Δδ is the decrease in chemical shift difference between HDO and methyl peaks in ppm units.
3. Results and discussion
3.1 Basic performance of the slot tube
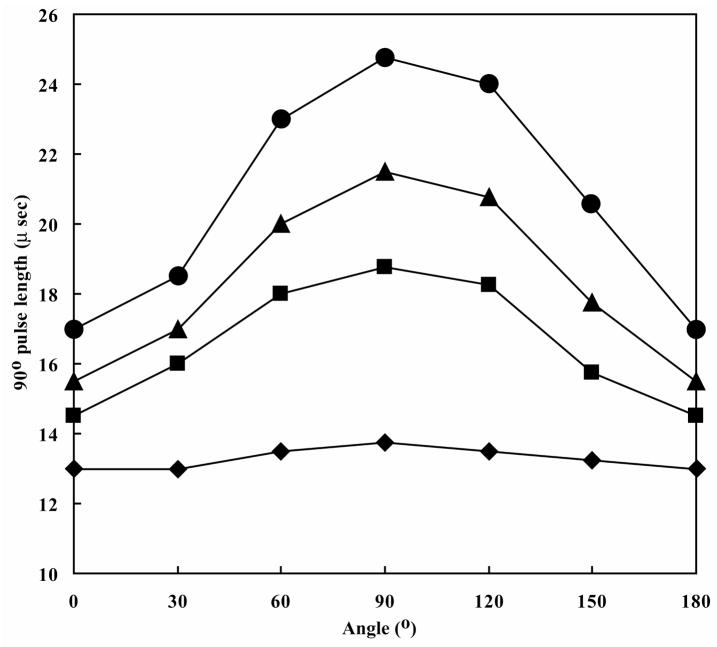
Initially, we checked whether the sample tube can be orientated at desired angles in a NMR probe on the basis of the orientation dependence of the π/2 pulse length [14]. The π/2 pulse length should be minimized when the long-axis of sample cross-section is aligned with the direction of the B1 field, and maximized when it is perpendicular. The observed profile of the π/2 pulse length was reproducibly consistent with this expectation (Fig. 2), and this approach was used to orient the slot tube at the desired angle in the NMR probe.
Figure 2. Measured π/2 pulse lengths for solutions containing different concentrations of NaCl and different orientations of the sample cavity in the slot tube.
Under fixed RF transmitter power (31.6 W), π/2 pulse lengths were determined for solutions containing 0 mM (◆), 100 mM (■), 200 mM (▲) or 300 mM (●) NaCl at 30° intervals on a DRX600 MHz NMR spectrometer. The sample buffer contained 10 mM sodium phosphate (pH 6.6). An angle of 0 corresponds to placing the tube such that the long axis of the slot is parallel to the B1 field. For comparison, the π/2 pulse lengths for a 5 mm o.d. microtube were as follows: 0 mM NaCl: 14 μs; 100 mM NaCl: 20.5 μs; 200 mM NaCl: 24 μs; 300 mM NaCl: 28 μs.
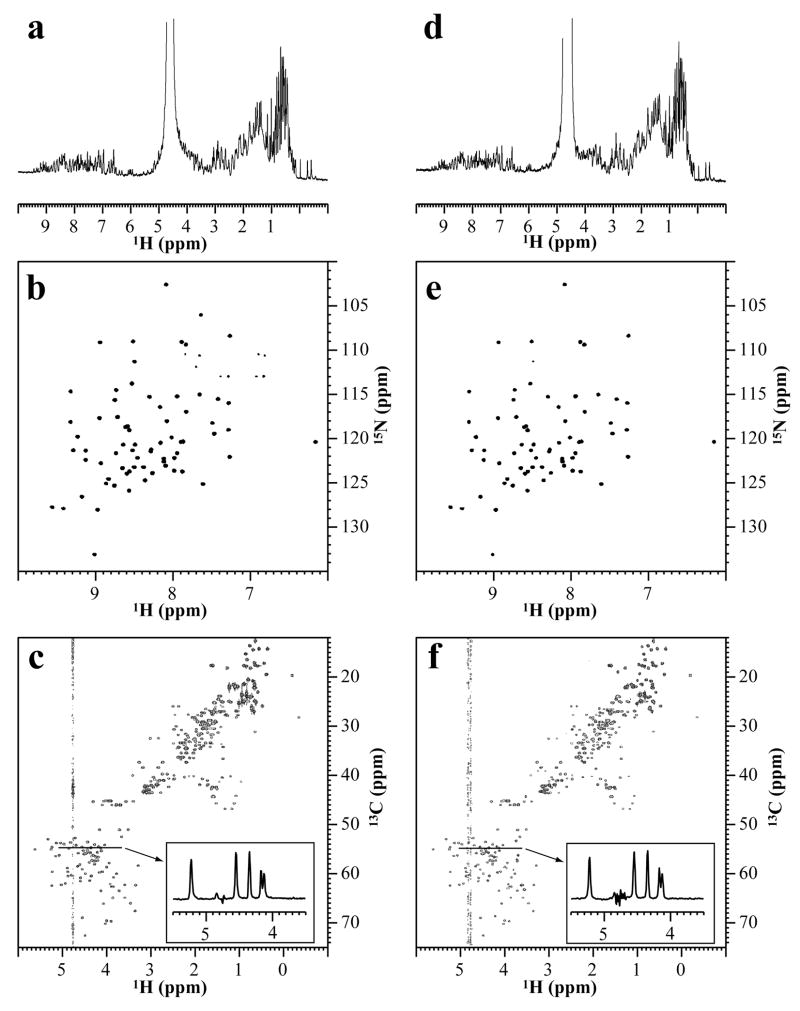
As a next step, we tested whether fine quality NMR spectra can be acquired with the slot tube under practical conditions for protein NMR including automatic shimming [15]. Overall, the quality of 1H-1D NMR, 2D 1H-15N, and 2D 1H-13C spectra of a sample in a the slot tube were nearly identical to those from the sample in a conventional Shigemi 5 mm microtube (Fig. 3).
Figure 3. Comparison of NMR spectra acquired with the slot tube and the 5 mm microtube.
NMR spectra of 0.3 mM of [U-13C/15N]-ubiquitin containing 10 mM sodium phosphate (pH 6.6) in the 5 mm microtube (a–c) and the slot tube (d–f). All these data were acquired on an Avance950 NMR spectrometer (22.3 T) equipped with a TCI cryogenic probe at 25°C. (a, d) 1H 1D experiment with the water peak was suppressed by continuous wave irradiation at a fixed RF transmitter power. (b, e) 1H-15N TROSY-HSQC experiments with a water flip-back pulse. (NS=2; 512 (F1) × 1536 (F2) with 3,400 Hz (ω1, 15N) × 11,400 Hz (ω2, 1H)) (c, f) 1H-13C constant time HSQC experiments (NS=2; 916 (F1) × 1536 (F2) with 16,900 Hz (ω1, 13C) × 11,400 Hz (ω2, 1H)). The constant time was 26.6 ms and both positive and negative peaks are displayed. To clarify the relative intensity of the remaining water to the protein signals, the 1D slice of the experiments at 13C chemical shift of 55 ppm are displayed in the inset. The experimental conditions were identical between the 5 mm microtube and the slot tube except for the 1H pulse length.
3.2 Comparison of the salt tolerance of the slot tube to that of other types of tubes
We compared the salt tolerance of the slot tube with that of a 5 mm microtube (Shigemi) and an oval-shaped tube (Bruker BioSpin) by measuring SNR of peaks in 1H-15N TROSY-HSQC spectra of 0.3 mM [U-13C, 15N]-ubiquitin samples at NaCl concentrations of 0, 100, 200 and 300 mM and at static magnetic fields of 14.1 (Table 1) and 22.3 T (Table 2).
Table 1.
Summary of results at different salt concentrations and tube geometries at 14.1 T (1H frequency of 600 MHz)
| NMR tube | Sample volume (μl) | Concentration of NaCl (mM) | π/2 Pulse length (μs) | Observed SNR | SNR per unit volume (ml) |
|---|---|---|---|---|---|
| Slot tube | 170 | 0 | 12.7 | 74 ± 6 | 435 ± 34 |
| 100 | 13.9 | 63 ± 6 | 371 ± 34 | ||
| 200 | 15.1 | 55 ± 7 | 320 ± 38 | ||
| 300 | 15.8 | 46± 4 | 273 ± 25 | ||
| 5 mm o.d. microtube | 280 | 0 | 13.3 | 123 ± 10 | 438 ± 35 |
| 100 | 19.5 | 58 ± 5 | 206 ± 17 | ||
| 200 | 23.0 | 44 ± 4 | 157 ± 15 | ||
| 300 | 27.3 | 34 ± 3 | 123 ± 9 | ||
| Oval-shaped tube | 380 | 0 | 12.4 | 100 ± 6 | 263 ± 16 |
| 100 | 14.2 | 61 ± 4 | 161 ± 11 | ||
| 200 | 15.5 | 50 ± 3 | 131 ± 7 | ||
| 300 | 16.9 | 44 ± 3 | 115 ± 7 |
Table 2.
Summary of results at different salt concentrations and tube geometries at 22.3 T (1H frequency of 950 MHz)
| NMR tube | Solvent volume (μl) | Concentration of NaCl (mM) | π/2 Pulse length (μs) | Observed SNR | SNR per unit volume (ml) |
|---|---|---|---|---|---|
| Slot tube | 170 | 0 | 8.7 | 125 ± 8 | 735 ± 49 |
| 100 | 10.0 | 91 ± 7 | 534 ± 43 | ||
| 200 | 10.8 | 88 ± 6 | 517 ± 35 | ||
| 300 | 11.6 | 78 ± 7 | 458 ± 41 | ||
| 5 mm o.d. microtube | 280 | 0 | 10.1 | 155 ± 16 | 554 ± 59 |
| 100 | 14.3 | 87 ± 9 | 312 ± 32 | ||
| 200 | 17.3 | 72 ± 7 | 257 ± 26 | ||
| 300 | 20.0 | 56 ± 5 | 199 ± 16 | ||
| Oval-shaped tube | 380 | 0 | 8.8 | 117 ± 13 | 308 ± 35 |
| 100 | 10.0 | 87 ± 7 | 229 ± 19 | ||
| 200 | 10.9 | 74 ± 7 | 196 ± 18 | ||
| 300 | 12.0 | 62 ± 4 | 164 ± 11 |
In the absence of added salt, the highest SNR was achieved with the 5 mm microtube. However, at the highest salt concentration (300 mM), a concentration frequently required to solubilize proteins, all three tube designs achieved comparable SNR values, with the slot tube and oval-shaped tube slightly outperforming the 5 mm microtube at both 600 MHz (Table 1) and 950 MHz (Table 2).
In general, proteins and other biomolecules are quite expensive to produce, particularly when they are labeled uniformly or selectively with stable isotopes (2H, 13C, and or 15N). In addition, these biomolecules frequently have limited solubility and require the addition of salt to achieve solubility and stability. Thus the SNR per unit volume with samples of equal concentration is the most important criterion for comparison. Comparison of the SNR per unit volume values demonstrates the clear advantages of the slot tube design over the two alternatives at all salt concentrations and particularly at high salt and at high magnetic field. For example, at 600 MHz the SNR per unit volume for the protein solution containing 300 mM NaCl was over two times higher than for that of the other designs(Table 1) while at 950 MHz it was over two times higher than that for the 5 mm microtube and nearly three times higher than that of the oval-shaped tube at 950 MHz (Table 2).
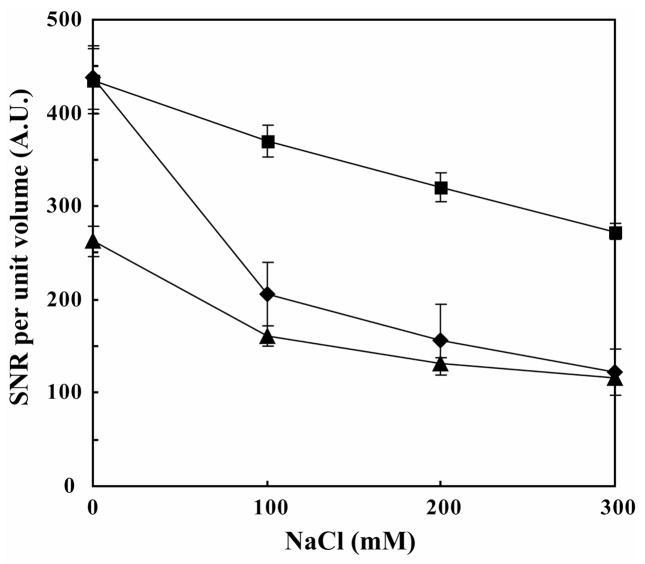
As shown in Fig. 4, the gradient of the decrease in the SNR per unit volume with increasing salt concentration was gentle for the slot tube and oval-shaped tube but much steeper for the 5 mm microtube. Similar results are shown by the salt dependence of the increase in the π/2 pulse length (Table 1) These results demonstrate that the shape of the slot tube, like that of the oval tube, successfully mitigate sensitivity losses arising from the ionic conductivity.
Figure 4. SNR per unit volume in different tubes and salt concentrations.
The SNR per unit volume for data acquired at 14.1 T (600 MHz 1H) evaluated for the 0.3 mM ubiquitin samples in the slot tube (■), 5 mm o.d. microtube (◆), and oval-shaped tube (▲) at different salt concentrations.
The improvement of SNR of the slot tube over the 5 mm microtube at 22.3 T was nearly identical to that at 14.1 T within experimental error. According to the report by Horiuchi and coworkers, the dielectric conductivity for water at 930 MHz is equivalent to the ionic conductivity of solution containing as little as 20 mM NaCl. (See Fig. 3 of ref [6]). Because dielectric losses increase drastically with increasing magnetic field over 1 GHz, the contribution of the dielectric tolerance of the slot tube should become more apparent at these higher fields. Also, dielectric losses increase markedly with decreasing temperature for aqueous solutions such that at 5° C they become equivalent to those of 50 mM NaCl at 900 MHz.
A current alternative to a shaped tube is to place the sample in cylindrical tube of smaller diameter. We have compared SNR with the protein sample containing 300 mM NaCl achieved with a 3 mm microtube (Shigemi), a 4 mm microtube (Shigemi), and the slot tube (Table 3). The SNR per unit volume is best for the 3 mm microtube (321) followed by that for the slot tube (273). However, if the sample quantity is not limiting, the slot tube provides the overall best SNR.
Table 3.
Summary of S/N at other type of tube geometries at 1H frequency of 600 MHz
| NMR tube | Solvent volume (μl) | Concentration of NaCl (mM) | π/2 Pulse length (μs) | Total SNR | SNR per unit volume |
|---|---|---|---|---|---|
| Slot tube | 170 | 300 | 15.8 | 46± 4 | 273 ± 25 |
| 4 mm o.d. microtube | 163 | 300 | 18.9 | 32 ± 2 | 197 ± 12 |
| 3 mm o.d. microtube | 98 | 300 | 15.0 | 31 ± 2 | 321 ± 21 |
Data are for 0.3 mM of [U-13C, 15N]-ubiquitin sample at 600 MHz.
To evaluate the influence of sample tube design on sample heating, we compared the performance of the slot tube with that of three microtubes of 3, 4 and 5 mm outer diameters (Fig. 5). The slot tube showed a much lower heating over time and reached a steady state plateau earlier than the other designs. Because the heat conductivity of glass is larger than that of surrounding air, sample heat appears to be dissipated more efficiently by the slot tube.
Figure 5. Evaluation of the sample heating in different tubes.
(a) Pulse sequence employed to evaluate the heating of a 99 % D2O water sample containing 1 mM DSS and 300 mM NaCl (pH 4.8). The experiments were performed using a DRX600 NMR spectrometer equipped with a TCI cryogenic probe regulated at 25 °C. Pre-saturation was carried out by continuous wave irradiation at a transmitter output of 0.4 W. Following the application of 32 dummy pulses, the 1H 1D spectrum was acquired in 2 transients. The increase of the sample temperature was measured from the chemical shift difference between the HDO peak and the methyl peaks of DSS: (b) Results for the slot tube (●), 3 mm o.d. microtube (▲), 4 mm o.d. microtube (■), 5 mm o.d. microtube (◆).
4. Conclusion
The slot tube described here exhibits practical advantages over alternative tube designs in terms of SNR per unit volume and minimization of sample heating, particularly for samples containing high salt concentrations and data collected at high fields. Use of the slot tube can minimize the quantity and hence the cost of biomolecular samples. The higher SNR achieved can reduce the required data collection time and enable data collection with samples that degrade over time. The slot tube can readily be introduced into normal laboratories at low cost, particularly when the probe is equipped with a sample positioning unit. Finally, the slot tube design likely will exhibit further advantages as NMR systems are developed that operate at still higher static magnetic fields.
Table 4.
Sensitivity gain at static magnetic fields of 14.1 T and 22.3 T
| NaCl (mM) | SNR ratio (slot tube / microtube) | |
|---|---|---|
| 14.1 T(1H: 600MHz) | 22.3 T (1H: 950MHz) | |
| 0 | 1.0 ± 0.2 | 1.3 ± 0.2 |
| 100 | 1.8 ± 0.2 | 1.7 ± 0.3 |
| 200 | 2.0 ± 0.2 | 1.9 ± 0.4 |
| 300 | 2.2 ± 0.4 | 2.3 ± 0.4 |
Table 5.
Comparison of relative glass-liquid surface/volume ratio
| NMR tube | Solvent volume (μl) | Relative volume | Length of glass-liquid cross-section (mm) | Rel. glass-liquid surface/volume ratio |
|---|---|---|---|---|
| Slot tube | 170 | 0.60 | 12.2 | 20.3 |
| 4 mm o.d. microtube | 163 | 0.58 | 10.05 | 17.3 |
Acknowledgments
This work was supported in part by Targeted Protein Research Program (MEXT) to M.K., and a Grant-in-Aid for Young Scientist (B) (21770110) to M.T. We thank Prof. Volker Dötsch, Institute of Biophysical Chemistry and Center of Biological Magnetic Resonance, Goethe-University, for his kind help in collecting the NMR data at 1H frequency of 950 MHz. Mr. Klaus Müller (Goethe University) is gratefully acknowledged for manufacturing the prototype sample holder for slotted NMR tubes. J.L.M. and K. H. were supported by US NIH grant P41 RR02301.
Footnotes
Publisher's Disclaimer: This is a PDF file of an unedited manuscript that has been accepted for publication. As a service to our customers we are providing this early version of the manuscript. The manuscript will undergo copyediting, typesetting, and review of the resulting proof before it is published in its final citable form. Please note that during the production process errors may be discovered which could affect the content, and all legal disclaimers that apply to the journal pertain.
References
- 1.Styles P, Soffe NF, Scott CA. An improved cryogenically cooled probe for high-resolution NMR. J Magn Reson. 1989;84:376–378. [Google Scholar]
- 2.Jerosch-Herold M, Kirschman RK. Potential benefits of a cryogenically cooled NMR probe for room-temperature samples. J Magn Reson. 1989;85:141–146. [Google Scholar]
- 3.Kovacs H, Moskau D, Spraul M. Cryogenically cooled probes—a leap in NMR technology. Progress NMR Spectr. 2005;46:131–155. [Google Scholar]
- 4.Gadian DG, Robinson FNH. Radiofrequency losses in NMR experiments on electrically conducting samples. J Magn Reson. 1979;34:449–455. [Google Scholar]
- 5.Kelly AE, Ou HD, Withers R, Dötsch V. Low-conductivity buffers for high-sensitivity NMR measurements. J Am Chem Soc. 2002;124:12013–12019. doi: 10.1021/ja026121b. [DOI] [PubMed] [Google Scholar]
- 6.Horiuchi T, Takahashi M, Kikuchi J, Yokoyama S, Maeda H. Effect of dielectric properties of solvents on the quality factor for a beyond 900 MHz cryogenic probe model. J Magn Reson. 2005;174:34–42. doi: 10.1016/j.jmr.2005.01.004. [DOI] [PubMed] [Google Scholar]
- 7.de Swiet TM. Optimal electric fields for different sample shapes in high resolution NMR spectroscopy. J Magn Reson. 2005;174:331–334. doi: 10.1016/j.jmr.2005.02.007. [DOI] [PubMed] [Google Scholar]
- 8.Wang AC, Bax A. Minimizing the effects of radio-frequency heating in multidimensional NMR experiments. J Biomol NMR. 1993;3:715–720. doi: 10.1007/BF00198374. [DOI] [PubMed] [Google Scholar]
- 9.Robosky1 LC, Reily1 MD, Avizonis D. Improving NMR sensitivity by use of salt-tolerant cryogenically cooled probes. Anal Bioanal Chem. 2007;387:529–532. doi: 10.1007/s00216-006-0982-4. [DOI] [PubMed] [Google Scholar]
- 10.Voehler MW, Collier G, Young JK, Stone MP, Germann MW. Performance of cryogenic probes as a function of ionic strength and sample tube geometry. J Magn Reson. 2006;183:102–109. doi: 10.1016/j.jmr.2006.08.002. [DOI] [PMC free article] [PubMed] [Google Scholar]
- 11.Kc R, Gowda YN, Diukovic D, Henry ID, Park GH, Raftery D. Susceptibility-matched plugs for microcoil NMR probes. J Magn Reson. 2010;205:63–68. doi: 10.1016/j.jmr.2010.04.001. [DOI] [PMC free article] [PubMed] [Google Scholar]
- 12.Pervushin K, Riek R, Wider G, Wüthrich K. Attenuated T2 relaxation by mutual cancellation of dipole–dipole coupling and chemical shift anisotropy indicates an avenue to NMR structures of very large biological macromolecules in solution. Proc Natl Acad Sci USA. 1997;94:12366–12371. doi: 10.1073/pnas.94.23.12366. [DOI] [PMC free article] [PubMed] [Google Scholar]
- 13.Wishart DS, Sykes BD. Chemical Shifts as a Tool for Structure Determination. Methods Enzymology. 1994;239:363–392. doi: 10.1016/s0076-6879(94)39014-2. [DOI] [PubMed] [Google Scholar]
- 14.Hoult DI, Richards RE. The signal-to-noise ratio of the nuclear magnetic resonance experiment. J Magn Reson. 1976;24:71–85. doi: 10.1016/j.jmr.2011.09.018. [DOI] [PubMed] [Google Scholar]
- 15.Weiger M, Speck T, Fey M. Gradient shimming with spectrum optimization. J Magn Reson. 2006;182:38–48. doi: 10.1016/j.jmr.2006.06.006. [DOI] [PubMed] [Google Scholar]


