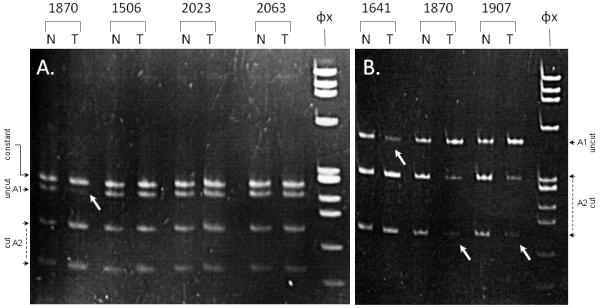
Figure 2. Loss of heterozygosity analyses.

Panel A: PCR amplification products of marker rs1057035 in representative normal (N) / tumor (T) pairs digested with MwoI. Tumor 1870 demonstrates LOH (DICER1 expression = 2.38 arbitrary units).
Panel B: PCR amplification products of marker rs1209904 in representative normal (N) / tumor (T) pairs digested with HpyCH4IV. Tumors 1641 (DICER1 expression = 12.29 arbitrary units), 1870 (DICER1 expression = 2.38 arbitrary units) and 1907 (DICER1 expression = 0.48 arbitrary units) demonstrate allelic imbalance.
White arrows indicate the allelic fragment(s) with reduced intensity.
