Abstract
In this work, we report novel fibrin targeted “soft-type” manganese-based contrast agents for MRI with the potential to noninvasively image intravascular thrombus which could warrant aggressive medical intervention to preclude subsequent myocardial infarction or stroke.
The discipline of molecular imaging has rapidly evolved over the past decade through the integration of molecular biology, cell biology, and diagnostic imaging.1 Magnetic resonance imaging (MRI) uses paramagnetic and superparamagnetic probes to produce high resolution noninvasive images in space and time of normal as well as abnormal cellular processes at a molecular or genetic level of function.2 It is being successfully used to provide characterization and measurement of biological processes in living animals and humans (in vivo).3
In cardiovascular research, MRI has emerged as a particularly sensitive, nonionizing modality to noninvasively visualize thromboses within the carotid artery.4 Improvements in high spatial resolution black-blood techniques have greatly advanced noninvasive imaging of human coronary and carotid arteries and facilitated the early assessment of atherosclerotic disease. Recent imaging algorithms have continued to address the primary challenge of cardio-respiratory motion that has complicated coronary imaging with MRI.5 Nanoparticle and peptide based MRI contrast agents have been developed that are capable of detecting and quantifying microthrombus.6 Gadolinium (Gd) based contrast agents are widely used for MR imaging, but their recent association with nephrogenic systemic fibrosis (NSF) in some patients with renal disease or following liver transplant has led to new concerns and FDA restrictions on use.7,8 Moreover, the uncertainties surrounding NSF in nonexcluded patients have triggered reconsideration of alternative approaches based on non-lanthanide metals, e.g., manganese.9 Manganese (Mn) has many properties that favour its potential as an MRI contrast agent such as high spin number, labile water exchange and long electronic relaxation time, natural prevalance and known human biochemistry.10 Manganese was one of the first reported examples of paramagnetic contrast materials studied in cardiac and hepatic MRI and has historically been used as a blood pool agent in both bivalent and trivalent form.10,11 Manganese-based “hard-particle” approaches have been explored recently for molecular imaging with MRI.9a,e,f Unfortunately, hard particles (>10 nm) are poorly excreted in humans and often are slowly or never biometabolized, creating a tissue residue biosafety issue. Soft particles1h can be referred as self-assemblies of small molecules or small metal crystals each of which can be metabolized, recycled or excreted. These particles are more compliant and survive better as they flow through the complex microvasculature of clearance organs.
In this work, we report for the first time the synthesis and MR characterization of “soft” type manganese oxide nanocolloid (ManOC) and manganese oleate nanocolloids (ManOL) incorporating divalent manganese. These nanocolloids are encapsulated by phospholipid and are constrained to the vasculature by size (>120 nm) to avoid extravasation into non-target, non-clearance tissues within the arterial wall or beyond. Metals are uniquely entrapped within the core matrix to avoid unfavourable interactions with surface homing ligands or surrounding plasma proteins. These uniquely constructed nanocolloids possess a long shelf-life stability and retain the particle integrity for viable clinical translation.
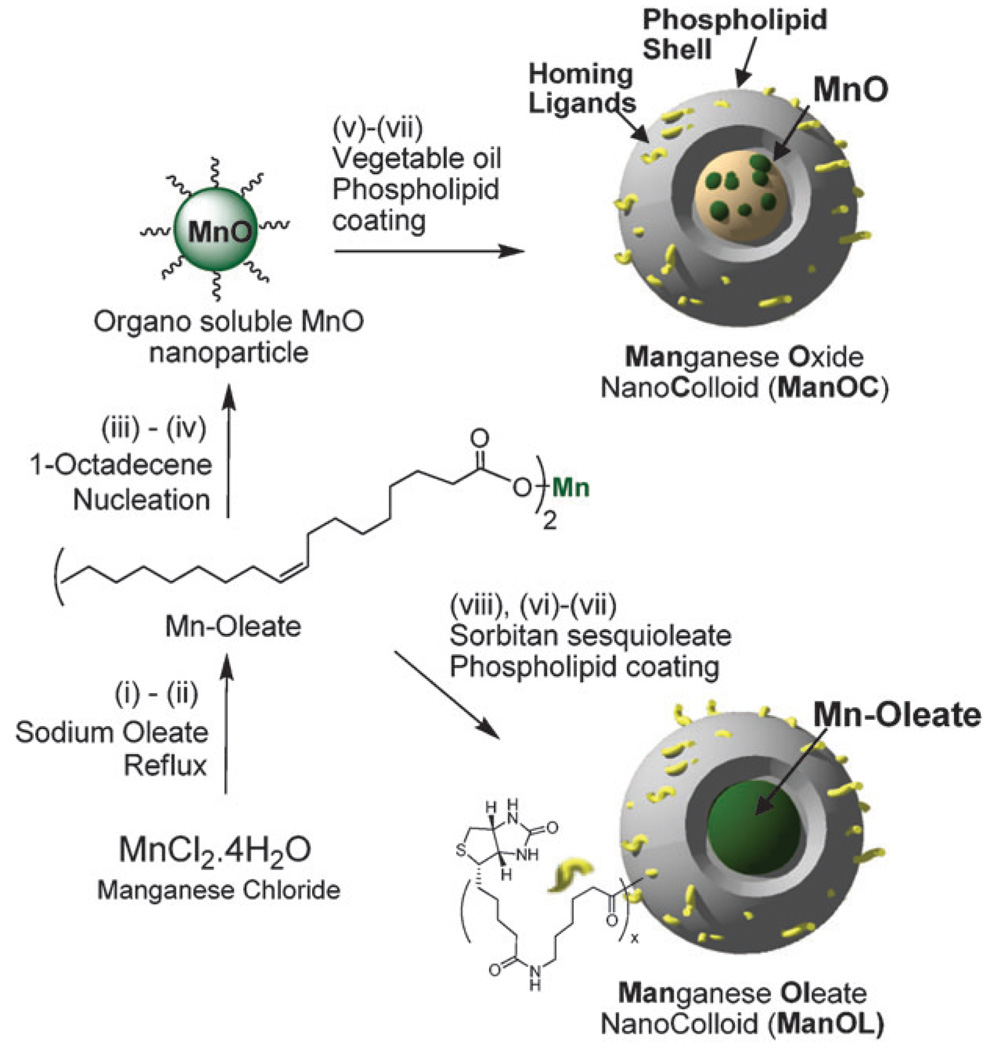
Two simple but elegant approaches were followed that allowed us to incorporate manganese oxide (MnO) nanoparticle and manganese oleate to synthesize ManOC and ManOL, respectively (Scheme 1). In a typical procedure, coated MnO crystals, confirmed by transmission electron microscopy (TEM) and FT-IR (see ESI†), were synthesized according to a previously published procedure with similar results.9a Briefly, manganese chloride tetrahydrate was reacted with sodium oleate (TCI chemical) in a mixture of ethanol–water–hexane for 14 h maintaining the temperature at 80 °C and 4 h at ambient temperature to afford Mn-oleate, which was characterized by FT-IR, ESI-MS and TGA (see ESI†). Mn-oleate was then subjected to thermal decomposition in octadecene at 325 °C for 70 min. The purified coated MnO nanoparticles were 8–12 nm in size and easily dispersed in chloroform. Coated MnO (2 w/v% of inner matrix) was suspended in vegetable oil and homogenized with the surfactant mixture at 20 000 psi for 4 min to produce ManOC. The surfactant mixture mainly comprised phosphatidylcholine (PC) (~90 mol%) and biotin-caproyl-PE (~1%) (Scheme 1) for targeting. To achieve a higher (>2 w/v%) loading, Mn-oleate was suspended with polysorbates (e.g. sorbitan sesquioleate) as inner matrix and homogenized with surfactant mixture to synthesize ManOL. This unique methodology allowed us to prepare nanocolloids (NC) that are constrained to the vasculature by size (>120 nm).
Scheme 1.
Preparation of ManOC and ManOL. (i)–(ii) sodium oleate, reflux, stirring; (iii)–(iv) 1-octadecene, 325 °C/70 min, stirring; (v) suspended with vegetable oil (2 w/v%), vortex, mixing; evaporation of chloroform under reduced pressure, 45 °C; (vi) thin film formation from phospholipids mixture; (vii) homogenization, 20 000 psi, 4 min, 0 °C; (viii) Mn-oleate, suspended with sorbitan sesquioleate (>2 w/v%), vortex, mixing, evaporation of chloroform under reduced pressure, 45 °C; then steps (vi), followed by (vii).
A control nanocolloid (ConNC) was prepared following a similar procedure without the incorporation of MnO or Mn-oleate. Typically for ConNC, the surfactant co-mixture included PC (90 mol%), cholesterol (8 mol%), and biotinylated-dipalmitoyl phosphatidylethanolamine (2 mol%). The core comprised 20% v/v vegetable oil. In the present study, the targeted MR contrast was directed against thrombus and more specifically to fibrin, its architectural scaffold. Given the in vitro nature of these studies, classic biotin–avidin interactions were employed to couple the nanoparticles to the fibrin-specific monoclonal antibody.
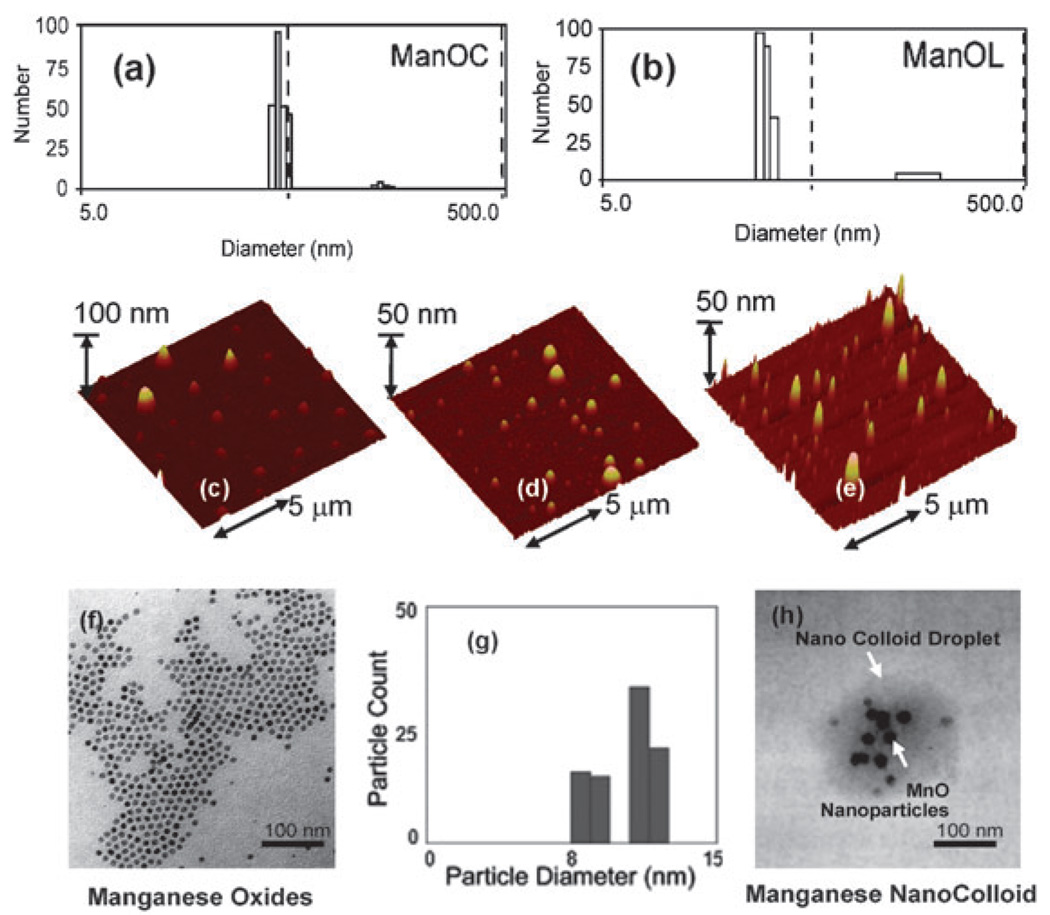
Manganese nanocolloids were characterized by multiple analytical techniques (Table 1). Hydrodynamic particle sizes for the biotinylated-ManOC (136 ± 6 nm), biotinylated-ManOL (134 ± 2 nm) and biotinylated-ConNC (no metal) (154 ± 6 nm) were found to be similar with narrow distribution (polydispersity indexes, PDI; 0.09 ± 0.02, 0.13 ± 0.03, and 0.08 ± 0.03, respectively for ManOC, ManOL and ConNC) (Fig. 1). The particle stability and successful phospholipid-encapsulation were confirmed based on the presence of negative electrophoretic potential (ζ) values. Manganese content was determined as 0.37 ± 0.02 mg mL−1 and 0.49 ± 0.02 mg mL−1 for ManOC and ManOL respectively by ICP-OES. The presence of multiple MnO nanoparticles within the final formulated colloidal nanoparticle was observed by TEM in the anhydrous state.
Table 1.
Characterization of manganese nanocolloids and control
| Nanocolloid | Dav/nma | ζ/mVb | Hav/nmc | Metal/mg mL−1d |
|---|---|---|---|---|
| ManOC | 136 ± 6 | −37 ± 05 | 74 ± 42 | 0.37 ± 0.02 |
| ManOL | 134 ± 2 | −25 ± 02 | 86 ± 32 | 0.49 ± 0.02 |
| ConNC | 154 ± 6 | −26 ± 05 | 71 ± 40 | None |
Number averaged DLS.
Electrophoretic (zeta) potential.
AFM.
ICP-OES.
Fig. 1.
Characterization of ManOC and ManOL: number averaged hydrodynamic (DLS) distribution of (a) ManOC and (b) ManOL; (c)–(e) atomic force microscopy (AFM) images of ManOC, ManOL and ConNC respectively; (f) TEM image of coated MnO drop deposited over nickel grid and (g) their distribution; (h) TEM image of ManOC.
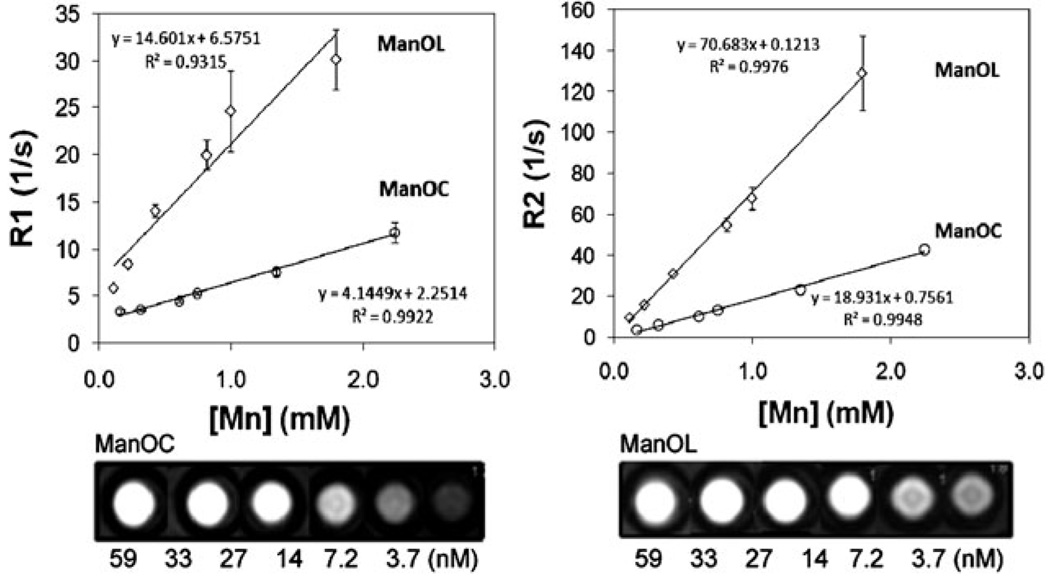
A single slice inversion recovery sequence (i.e., the Look–Locker technique)12 was used to calculate the ionic (per metal) and particulate (relaxivity per nanoparticle)1c r1 relaxivities of serially diluted NCs at 3.0 T and 25 °C. Similarly, r2 relaxivity was measured using a multi echo–spin echo technique. The ionic r1 relaxivities of ManOC and ManOL were 4.1 ± 0.9 (s mmol [Mn])−1 and 14.6 ± 1.1 (s mmol [Mn])−1, respectively, and the particulate relaxivities were approx. 91 127 ± 2 323 (s mmol [ManOC])−1 and 423 420 ± 10 564 (s mmol [ManOL])−1, respectively. The ionic r2 relaxivities of ManOC and ManOL were 18.9 ± 1.1 (s mmol [Mn])−1 and 70.7 ± 1.2 (s mmol [Mn])−1, respectively. The particulate r2 relaxivities were approx. 441 120 ± 11 213 (s mmol [ManOC])−1 and 2 135 482 ± 20 543 (s mmol [ManOL])−1 for ManOC and ManOL respectively. The specific relaxivities, obtained by measuring the relaxation rate as a function of the manganese and nanoparticle concentrations, were found to be 3- and 5-fold increased, respectively, for the ManOL as compared to the ManOC (Fig. 2). The increased relaxivity of the ManOC may relate to the intraparticle distribution of the metal complex relative to the surfactant layer. The smaller Mn-oleate may be interspersed within the phospholipid layer, closer to the surrounding water medium than the metal crystals. Alternatively, the metal crystals may interact and cluster more with the central core of the particle than the more homogeneously dispersed Mn-oleate. Further focused study will be required to elucidate the physical-chemical basis for this effect. The sensitivity of detection of the ManOL particles extended to 3.7 nM, suggesting that the vascular expression of even sparse biomarkers, such as neovascular integrins, could also be imaged.
Fig. 2.
MR characterization of ManOC and ManOL in suspension: (top) ionic R1 (left) and R2 (right) relaxivity. The measured R1 relaxation rate at 3 T for ManOC (circles) and ManOL (diamonds) as a function of manganese concentration. (Bottom) A T1-weighted spin echo MR image (3 T) showing cross-sections of test tubes revealing a bright signal from the high particulate concentration (59 nM) with a progressively lower signal with dilution.
The concept of molecular imaging of fibrin-rich clots was demonstrated in vitro following a classic, avidin–biotin sandwich technique in which a fibrin-rich clot is serially incubated with excess biotinylated antifibrin monoclonal antibody, avidin, and the biotinylated ManOC, ManOL, or control particles. The unbound excess of each component is removed by washing after each step. Fibrin-rich clots supported on a silk suture (string) were suspended in phosphate buffered saline (PBS, pH 7.4) with sealed polystyrene test tubes (75 mm) (see ESI†). ManOC, ManOL, non-targeted ManOL (no biotin) and ConNC were targeted to the clots via a fibrin-specific monoclonal antibody (NIB5F3).13 T1w gradient echo MR images (3 T) of the clots were acquired (Fig. 3) using a birdcage coil oriented with all groups visible within the imaging slice. The fibrin clots targeted with ManOC and ManOL presented obvious homogeneous T1w contrast enhancement with signal intensities: ManOC, 85 ± 7 a.u.; ManOL, 102 ± 21 a.u.; ConNC, 12 ± 5 a.u.; and nontargeted ManOL, 22 ± 6 a.u. The background air signal intensity was 7 ± 4 a.u. Further advanced characterization studies to probe the efficacy and safety of these agents in vivo are warranted.
Fig. 3.
MRI images of fibrin-targeted nanocolloids: (a) ManOC; (b) ConNC; (c) non targeted-ManOL and (d) ManOL, bound to cylindrical plasma clots measured at 3 T (pixel dimension: 0.73 mm × 0.73 mm × 5 mm slice thickness).
In conclusion, we have successfully synthesized and demonstrated fibrin-specific “soft” type manganese nanocolloids with high relaxivity and detection sensitivity reaching to the low nM range. While both agents possessed strong MR effectiveness, the incorporation of manganese as a metal complex allowed markedly higher loading which provided greater T1w contrast than could be achieved with manganese oxide crystal encapsulation. Molecular imaging of intra vascular thrombus with these agents may allow early, direct identification of ruptured plaque, which could warrant aggressive medical or procedural intervention to preclude subsequent myocardial infarction or stroke.
Supplementary Material
Acknowledgments
The financial support from the AHA (0835426N), the NIH (NS059302, CA119342, and HL073646) and the NCI (N01CO37007) is greatly appreciated.
Footnotes
Electronic supplementary information (ESI) available: Experimental details. See DOI: 10.1039/b902875g
Notes and references
- 1.(a) Wickline SA, Lanza GM. Circulation. 2003;107:1092. doi: 10.1161/01.cir.0000059651.17045.77. [DOI] [PubMed] [Google Scholar]; (b) Wickline SA, Lanza GM. J. Cell. Biochem. 2002;39:90. doi: 10.1002/jcb.10422. [DOI] [PubMed] [Google Scholar]; (c) Winter PM, Caruthers SD, Wickline SA, Lanza GM. Curr. Cardiol. Rep. 2006;8:65. doi: 10.1007/s11886-006-0013-2. [DOI] [PubMed] [Google Scholar]; (d) Jaffer FA, Libby P, Weissleder R. Circulation. 2007;116:1052. doi: 10.1161/CIRCULATIONAHA.106.647164. [DOI] [PubMed] [Google Scholar]; (e) Cassidy PJ, Radda GK. J. R. Soc. Interface. 2005:1. doi: 10.1098/rsif.2005.0040. [DOI] [PMC free article] [PubMed] [Google Scholar]; (f) Rollo FD. Radiol. Manage. 2003;25(3):28. [PubMed] [Google Scholar]; (g) Weissleder R, Mahmood U. Radiology. 2001;219(2):316. doi: 10.1148/radiology.219.2.r01ma19316. [DOI] [PubMed] [Google Scholar]; (h) Nayak S, Lyon LA. Angew. Chem., Int. Ed. 2005;44:7686. doi: 10.1002/anie.200501321. [DOI] [PubMed] [Google Scholar]
- 2.(a) Brindle KM. Br. J. Radiol. 2003;76 suppl. 2:S111. doi: 10.1259/bjr/50577981. [DOI] [PubMed] [Google Scholar]; (b) Bulte JW, Kraitchman DL. NMR Biomed. 2004;17:484. doi: 10.1002/nbm.924. [DOI] [PubMed] [Google Scholar]
- 3.(a) Massoud TF, Gambhir SS. Genes Dev. 2003;17(5):545. doi: 10.1101/gad.1047403. [DOI] [PubMed] [Google Scholar]; (b) Won J, Kim M, Yi Y-W, Kim YH, Jung N, Kim TK. Science. 2005;309:121. doi: 10.1126/science.1112869. [DOI] [PubMed] [Google Scholar]
- 4.(a) Jaffer FA, Weissleder R. Circulation. 2004;94:433. doi: 10.1161/01.RES.0000119321.18573.5A. [DOI] [PubMed] [Google Scholar]; (b) Moody AR, Allder S, Lennox G, Gladman J, Fentem P. Lancet. 1999;353:122. doi: 10.1016/s0140-6736(05)76159-6. [DOI] [PubMed] [Google Scholar]
- 5.Fayad Z, Fuster V. Ann. N. Y. Acad. Sci. 2000;902:173. doi: 10.1111/j.1749-6632.2000.tb06312.x. [DOI] [PubMed] [Google Scholar]
- 6.(a) Flacke S, Fischer S, Scott MJ, Fuhrhop RJ, Allen JS, McLean M, Winter P, Sicard GA, Gaffney PJ, Wickline SA, Lanza GM. Circulation. 2001;104:1280. doi: 10.1161/hc3601.094303. [DOI] [PubMed] [Google Scholar]; (b) Botnar RM, Perez AS, Witte S, Wiethoff AJ, Laredo J, Hamilton J, Quist W, Parsons EC, Vaidya A, Kolodziej A, Barrett JA, Graham PB, Weisskoff RM, Manning WJ, Johnstone MT. Circulation. 2004;109:2023. doi: 10.1161/01.CIR.0000127034.50006.C0. [DOI] [PMC free article] [PubMed] [Google Scholar]; (c) Nair SA, Kolodziej AF, Bhole G, Greenfield MT, McMurry TJ, Caravan P. Angew. Chem., Int. Ed. 2008;47:4918. doi: 10.1002/anie.200800563. [DOI] [PubMed] [Google Scholar]
- 7.(a) Kuo PH. J. Am. Coll. Radiol. 2008;5(1):29. doi: 10.1016/j.jacr.2007.08.014. [DOI] [PubMed] [Google Scholar]; (b) Abu-Alfa AK. J. Am. Coll. Radiol. 2008;5(1):45. doi: 10.1016/j.jacr.2007.08.018. [DOI] [PubMed] [Google Scholar]; (c) Ersoy H, Rybicki FJ. J. Magn. Reson. Imaging. 2007;26(5):1190. doi: 10.1002/jmri.21135. [DOI] [PMC free article] [PubMed] [Google Scholar]; (d) Drug Safety Update. UK: Medicines and Healthcare products Regulatory Agency; 2007. Aug, pp. 2–4. [Google Scholar]
- 8.(a) Cowper SE. Curr. Opin. Rheumatol. 2003;15:785. doi: 10.1097/00002281-200311000-00017. [DOI] [PubMed] [Google Scholar]; (b) Bhave G, Lewis JB, Chang SS. J. Urol. 2008;180(3):830. doi: 10.1016/j.juro.2008.05.005. [DOI] [PMC free article] [PubMed] [Google Scholar]; (c) Stratta P, Canavese C, Aime S. Curr. Med. Chem. 2008;15(12):1229. doi: 10.2174/092986708784310396. [DOI] [PubMed] [Google Scholar]
- 9.(a) Na HB, Lee JH, An K, Park Y, Park M, Lee IS, Nam D-H, Kim ST, Kim S-H, Kim S-W, Lim K-H, Kim K-S, Kim S-O, Hyeon T. Angew. Chem., Int. Ed. 2007;46:5397. doi: 10.1002/anie.200604775. [DOI] [PubMed] [Google Scholar]; (b) Caravan P, Ellison JJ, McMurry TJ, Lauffer RB. Chem. Rev. 1999;99:2293. doi: 10.1021/cr980440x. [DOI] [PubMed] [Google Scholar]; (c) Ponce AM, Viglianti BL, Yu D, Yarmolenko PS, Michelich CR, Woo J, Bally MB, Dewhirst MW. J. Natl. Cancer Inst. 2007;99(1):53–63. doi: 10.1093/jnci/djk005. [DOI] [PubMed] [Google Scholar]; (d) Schwendener RA, Wuthrich R, Duewell S, Westera G, von Schulthess GK. Int. J. Pharm. 1989;3(1):249–259. [Google Scholar]; (e) Shin J, Anisur RM, Ko MK, Im GH, Lee JH, Lee IS. Angew. Chem., Int. Ed. 2009;48:321. doi: 10.1002/anie.200802323. [DOI] [PubMed] [Google Scholar]; (f) Gilad AA, Walczak P, McMahon MT, Na HB, Lee JH, An K, Hyeon T, van Zijl PCM, Bulte JWM. Magn. Reson. Med. 2008;60(1):1. doi: 10.1002/mrm.21622. [DOI] [PMC free article] [PubMed] [Google Scholar]; (g) Pelled G, Bergman H, Ben-Hur T, Goelman G. J. Magn. Reson. Imaging. 2007;26:863. doi: 10.1002/jmri.21051. [DOI] [PubMed] [Google Scholar]
- 10.(a) Rocklage SM, Cacheris WP, Quay SC, Hahn FE, Raymond KN. Inorg. Chem. 1989;28:477. [Google Scholar]; (b) Silva AC, Lee JH, Aoki I, Koretsky AP. NMR Biomed. 2004;17:532. doi: 10.1002/nbm.945. [DOI] [PubMed] [Google Scholar]
- 11.Wendland MF. NMR Biomed. 2004;17(8):581. doi: 10.1002/nbm.943. [DOI] [PubMed] [Google Scholar]
- 12.Look DC, Locker DR. Rev. Sci. Instrum. 1970;41(2):621. [Google Scholar]
- 13.Raut S, Gaffney PJ. Thromb. Haemostasis. 1996;76:56. [PubMed] [Google Scholar]
Associated Data
This section collects any data citations, data availability statements, or supplementary materials included in this article.


