Abstract
Magnetic Resonance Elastography (MRE) is a rapidly developing technology for quantitatively assessing the mechanical properties of tissue. The technology can be considered to be an imaging-based counterpart to palpation, commonly used by physicians to diagnose and characterize diseases. The success of palpation as a diagnostic method is based on the fact that the mechanical properties of tissues are often dramatically affected by the presence of disease processes such as cancer, inflammation, and fibrosis. MRE obtains information about the stiffness of tissue by assessing the propagation of mechanical waves through the tissue with a special magnetic resonance imaging (MRI) technique. The technique essentially involves three steps:
generating shear waves in the tissue,
acquiring MR images depicting the propagation of the induced shear waves and
processing the images of the shear waves to generate quantitative maps of tissue stiffness, called elastograms.
MRE is already being used clinically for the assessment of patients with chronic liver diseases and is emerging as a safe, reliable and noninvasive alternative to liver biopsy for staging hepatic fibrosis. MRE is also being investigated for application to pathologies of other organs including the brain, breast, blood vessels, heart, kidneys, lungs and skeletal muscle. The purpose of this review article is to introduce this technology to clinical anatomists and to summarize some of the current clinical applications that are being pursued.
Keywords: elasticity imaging, palpation, mechanical properties, shear stiffness
Introduction
The use of palpation to feel the difference in the mechanical properties of tissues and to differentiate abnormal and normal tissues remains a time-tested diagnostic tool for physicians. The mechanical properties of tissues vary widely among different physiological and pathological states (Duck, 1990; Sarvazyan et al., 1995) and hence have significant diagnostic potential. For instance, the relative hardness of malignant tumors is the basis for the use of palpation to detect breast cancer (Barton et al., 1999). Surgeons often detect liver tumors by simple touch at laparotomy that may not have been detected in preoperative imaging (Elias et al., 2005). However, except at surgery, palpation is applicable only to superficial organs and pathologies and is qualitative, subjective and limited to the touch sensitivity of the practitioner. Unfortunately, none of the conventional medical imaging techniques, such as computed tomography (CT), magnetic resonance imaging (MRI) and ultrasonography (US), are capable of depicting the properties that are assessed by palpation. These considerations have provided motivation for developing special imaging technologies for quantitatively assessing the mechanical properties of tissue.
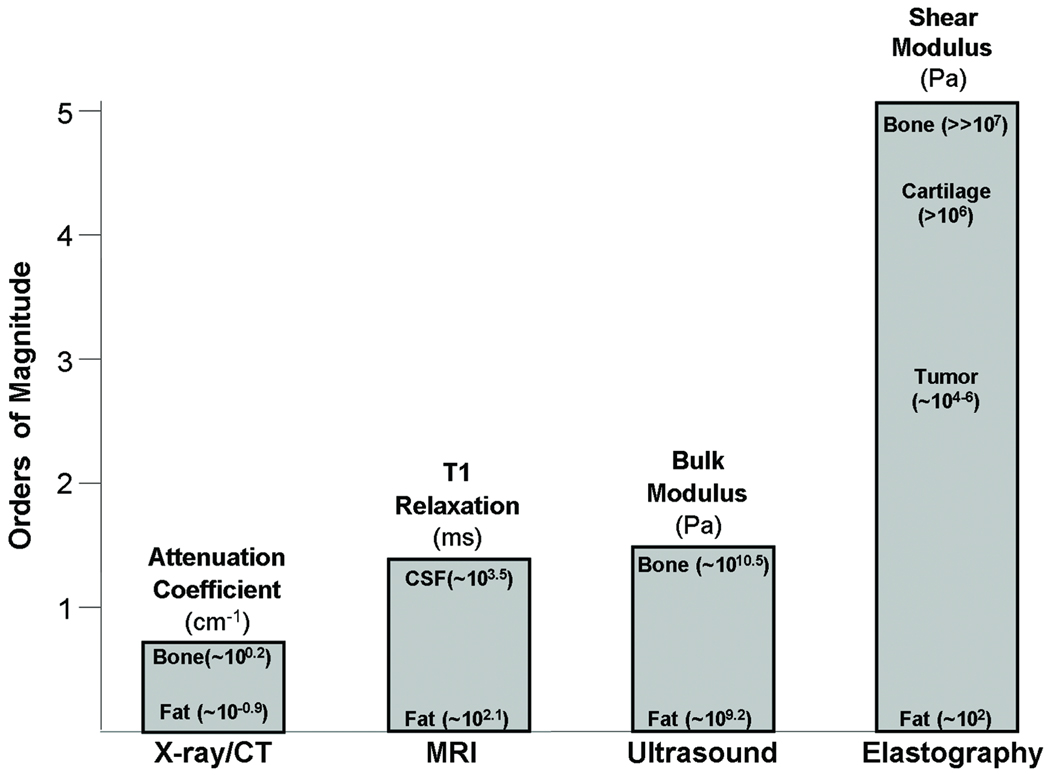
In engineering terms, the property assessed by palpation is called the elastic modulus. As shown in Figure 1, the elastic modulus of tissues varies by over five orders of magnitude and the tissue properties assessed by other modalities such as US, CT and MRI vary over a much smaller scale.
Figure 1. Imaging modality contrast mechanisms.
Examples of different imaging modalities and the spectrum of contrast mechanisms utilized by them are shown. The shear modulus has the largest variation with variations over 5 orders of magnitude among various physiological states of normal and pathologic tissues.
Elasticity Imaging
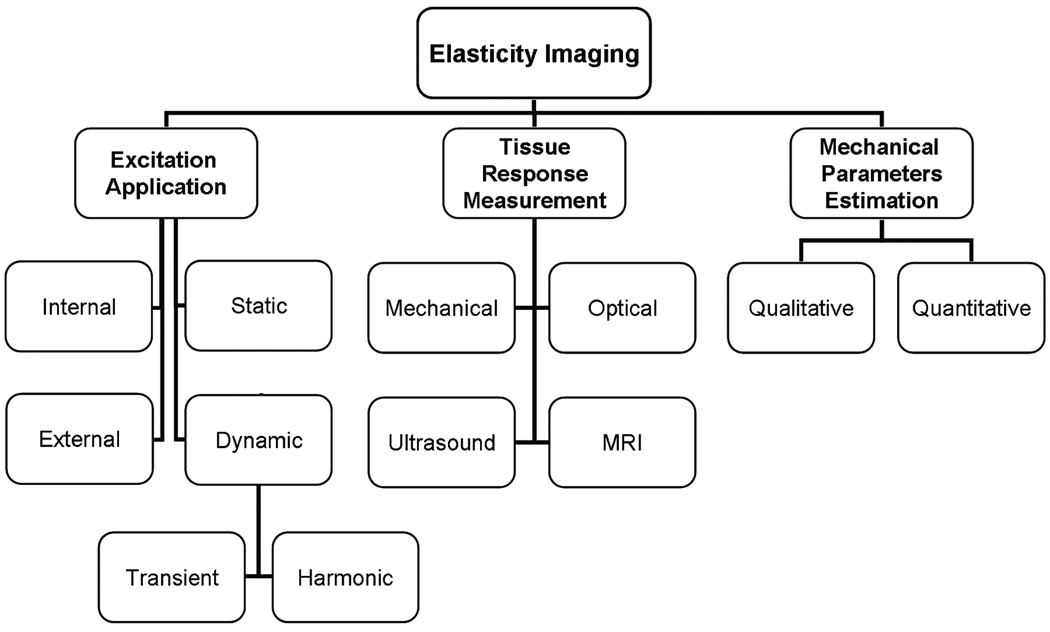
Investigators have evaluated a number of different approaches for imaging the mechanical properties of tissue. Most of the elasticity imaging methods apply some kind of stress or mechanical excitation to the tissue, measure the tissue response to this stimulus, and from this response calculate parameters that reflect the mechanical properties. Figure 2 shows a classification of these various approaches based on the three essential steps in elasticity imaging.
Figure 2. Various approaches to elasticity imaging.
The flowchart lists the various approaches to the three basic steps to elasticity imaging: (1) excitation application, (2) tissue response detection, and (3) calculation of the mechanical properties of the tissue.
A detailed review of all of the approaches is beyond the scope of this article; however some of the primary methods are highlighted below so that the reader can appreciate the breadth of the field. More technical discussions can be found in the literature, such as in (Greenleaf et al., 2003; Sarvazyan et al., 1995; Wilson et al., 2000).
Excitation Application
The mechanical stress that is applied to tissue can be produced either through internal sources of motion like respiration or cardiac pulsations (Bae et al., 2007; Kanai, 2004; Mai and Insana, 2002) or through external mechanical sources of motion (Bercoff et al., 2004; Kruse et al., 2008; Xu et al., 2007). The stimulus can also be classified based on the temporal characteristics of the excitation as static (or quasistatic) or dynamic. Manual palpation can be thought of as a static elasticity assessment technique. Static compressions are widely employed for elasticity imaging and the techniques that use static forces include strain-encoding imaging (Osman, 2003), elastography (Ophir, 1991) and stimulated-echo elasticity imaging (Chenevert et al., 1998; Steele et al., 2000). Dynamic excitation techniques induce vibrations, usually in the range of 50 to 500 Hz, and image the propagation of the waves produced by the excitation throughout the tissue. These techniques include vibration sonoelastography (Lerner et al., 1990; Levinson et al., 1995) and magnetic resonance elastography (Muthupillai et al., 1995; Sack et al., 2004; Sinkus et al., 2000).
Measurement of Tissue Response to Applied Stress
The most critical component of elasticity imaging is to measure the response or strain of the tissue that results from the applied stress. Figure 2 lists the main methods used for the tissue response measurement: (1) optical, (2) mechanical, (3) ultrasonography and (4) magnetic resonance imaging. One of the early works in elasticity imaging investigated in 1952 used visible light to measure mechanical wave propagation to determine tissue elasticity and viscosity (Gierke et al., 1952). Since then, sophisticated optical imaging techniques like optical coherence tomography (OCT) elastography and tissue Doppler optical coherence elastography (tDOCE) have been developed. (Rogowska et al., 2004; Ruikang et al., 2006; van Soest et al., 2007). Mechanical sensors, such as pressure sensors and accelerometers, have also been used to measure the tissue response to an applied stimulus since the underlying tissue properties are mechanical in nature (Egorov et al., 2006; Sarvazyan, 1998).
Ultrasonography has been widely used for elasticity imaging. Both cross-correlation methods and Doppler imaging methods have been used to measure the tissue motion (Krouskop et al., 1987; Lerner et al., 1990; Yamakoshi et al., 1990). The term ‘elastography’ as such was introduced to describe a technique (Ophir, 1991) in which the tissue strain resulting from external compression is measured with ultrasound, which provides a qualitative impression of the stiffness of tissue. Another method for elasticity imaging with ultrasound called transient elastography (TE, (de Ledinghen et al., 2007; Sandrin et al., 2003)) induces a single transient shear wave into tissue via a special transducer, images the propagation of this wave using ultrasound and uses this information to calculate the Young’s modulus of the tissue. Even though ultrasound-based techniques are fast, inexpensive, and widely used, they also have limitations including the need for a suitable acoustic window for the ultrasound measurements and a limited depth for the measurements due to the limited penetration of ultrasound waves in tissue.
One of the early implementations of MRI to measure tissue motion was for the assessment of cardiac function and pathologies using MR tagging techniques (Axel and Dougherty, 1989; Zerhouni et al., 1988). Other MR-based imaging techniques based on the synchronous use of quasistatic compressions and motion-encoding gradients (Chenevert et al., 1998; Plewes et al., 1995) have also been developed. Muthupillai et al. developed a technique called magnetic resonance elastography (MRE) which involves inducing harmonic vibrations of acoustic-range frequencies in tissue and imaging the propagation of these vibrations in the tissue to calculate quantitative values for tissue mechanical parameters (Muthupillai et al., 1995; Muthupillai et al., 1996).
Mechanical Parameter Estimation
The third step in quantitative elasticity imaging is to process the acquired data to estimate the mechanical properties of the tissue. Typically, tissue is assumed to be linearly elastic, isotropic and Hookean for elasticity imaging techniques. The elastic properties that correspond to what is assessed by palpation are expressed as Young’s modulus (E), or shear modulus (μ). For most soft tissues, the Young’s modulus and the shear modulus are related by a simple scale factor of 3: E = 3μ, which means that the calculation of Young’s modulus or shear modulus provides the same information.
While obtaining quantitative values of the elastic properties of tissue may be preferable, obtaining a qualitative contrast between normal and abnormal tissues can be helpful in many applications. Most of the techniques that apply quasistatic excitations calculate tissue displacement or strain as qualitative indicators of the underlying mechanical properties (Mai and Insana, 2002; O'Donnell et al., 1994; Osman, 2003). To calculate quantitative values of the shear modulus, for example, accurate determination of the accompanying tissue stresses is necessary, which is difficult due to complicated boundary conditions and unknown applied forces. On the other hand, with dynamic wave propagation techniques, quantitative shear modulus values can be calculated from the propagation of the shear waves using appropriate wave equations (Muthupillai et al., 1995; Sandrin et al., 2003).
Magnetic Resonance Elastography
Magnetic resonance elastography (MRE) is a dynamic elasticity imaging technique that uses mechanical waves to quantitatively assess the shear modulus (or stiffness) of tissues (Muthupillai et al., 1995). The technology is becoming available as an upgrade on conventional MRI scanners, and the most important initial clinical application has been for noninvasively assessing hepatic fibrosis, which increases the stiffness of liver tissue (Venkatesh et al., 2008b; Yin et al., 2007). The three basic steps of this MRE are
shear waves with frequencies ranging from 50 – 500 Hz are induced in the tissue using an external driver,
the waves are imaged inside the body using a special MRI technique and
the resulting data are processed to generate quantitative images displaying the stiffness of tissue.
The following sections highlight some of the key components of the MRE methodology and provide some sample applications under investigation.
Generating Mechanical Waves in Tissue
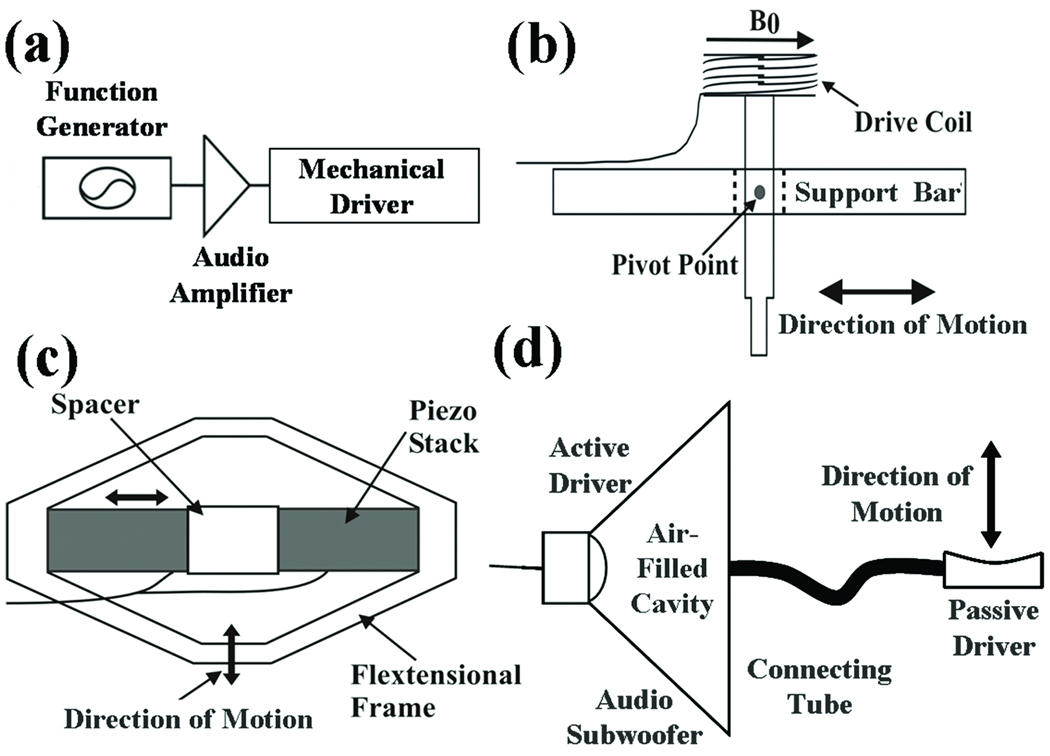
MRE typically uses vibrations of a single frequency (within the audio frequency range) generated by external driver devices. The electrical signal for these devices is created by a signal generator triggered by and synchronized to the MR pulse sequence and is amplified by an audio amplifier before being fed into the mechanical driver, as can be seen in Figure 3a.
Figure 3. External driver systems.
(a) Block diagram of the external driver setup. Examples of typical mechanical drivers include (b) electromechanical, (c) piezoelectric-stack, and (d) pressure-activated driver systems.
Over the years, several driving mechanisms have been developed, each with their own advantages and limitations (Tse et al., 2009). Three of the most commonly used driver systems are schematically shown in Figures 3b–d. Figure 3b shows an electromechanical driver that works via the Lorentz force and utilizes the magnetic field of the main MRI magnet (Braun et al., 2003; Muthupillai et al., 1995). A piezoelectric stack driver system is shown in Figure 3c, where the motion created is based on the piezoelectric property of certain materials (Chen et al., 2006; Othman et al., 2005). Focused-ultrasound-based (FUS-based) radiation force has also been investigated as a means to create mechanical motion for various elasticity imaging strategies including MRE, where shear waves are created directly within tissue with externally placed ultrasound transducers (Bercoff et al., 2004; Nightingale et al., 2001; Wu et al., 2000).
Another widely used method of creating the required vibrations for MRE utilizes the motion of the voice coils used in acoustic speaker systems. The required vibrations are again produced by the Lorentz force, but the static magnetic field is from a devoted permanent magnet present in the acoustic speaker (Asbach et al., 2008; Yin et al., 2007). These speakers, with their own permanent magnets, have to be placed away from the main MR magnet, thus this system necessitates an additional component to couple the vibrations produced by the speakers to the tissue. One approach is to enclose the area around the speaker cone or its equivalent, to use a long connecting tube to pneumatically conduct the harmonic pressure variations of the air into the scanner and to terminate the tube in a passive drum-like driver kept in contact with the tissue (pressure-activated driver, shown schematically in Figure 3d). This driver can be easily manipulated, and the portion of the driver system actually in the vicinity of the patient is made out of materials that do not produce MR image artifacts. This system is used by several groups for clinical hepatic MRE (Venkatesh et al., 2008b). Since the actual vibrations are produced by an active component different from the passive component in contact with the tissue, the passive component can be adapted to suit any organ of interest, such as the breast or brain. The amplitude of the vibrations induced within the tissue is very low and is maintained within vibration safety limits derived from a European Union directive limiting occupational exposure to whole-body and extremity vibrations (Ehman et al., 2008).
Imaging the Propagating Waves
The fundamentals of MR imaging underpinning MRE can be found in references such as (Bernstein et al., 2004; Vlaardingerbroek and Den boer, 2003). Measuring the tissue motion produced by a driver with MRE is based on an MR imaging technique called phase-contrast MRI (Moran, 1982). Muthupillai et al. developed the technique of dynamic phase-contrast MRE where propagating shear waves in tissue are encoded into the phase of the MR images with the help of motion-encoding gradient (MEG) pairs (Muthupillai et al., 1995). After continuous harmonic motion is induced in the tissue, a MEG oscillating at the same frequency as the motion is applied and conventional MR imaging is performed. The phase contribution to the MR image ϕ due to the motion and the applied magnetic field gradient at a given position vector r⃗ and phase offset θ between the motion and the MEG can be written as
where γ is the gyromagnetic ratio of the tissue protons , N is the number of gradient pairs used to sensitize the motion, T is the period of the motion-encoding gradient, G⃗ is its amplitude, ξ⃗0 is the peak amplitude of motion, and k⃗ is the wave number. This equation states that the phase of harmonically vibrating tissue is directly proportional to its displacement.
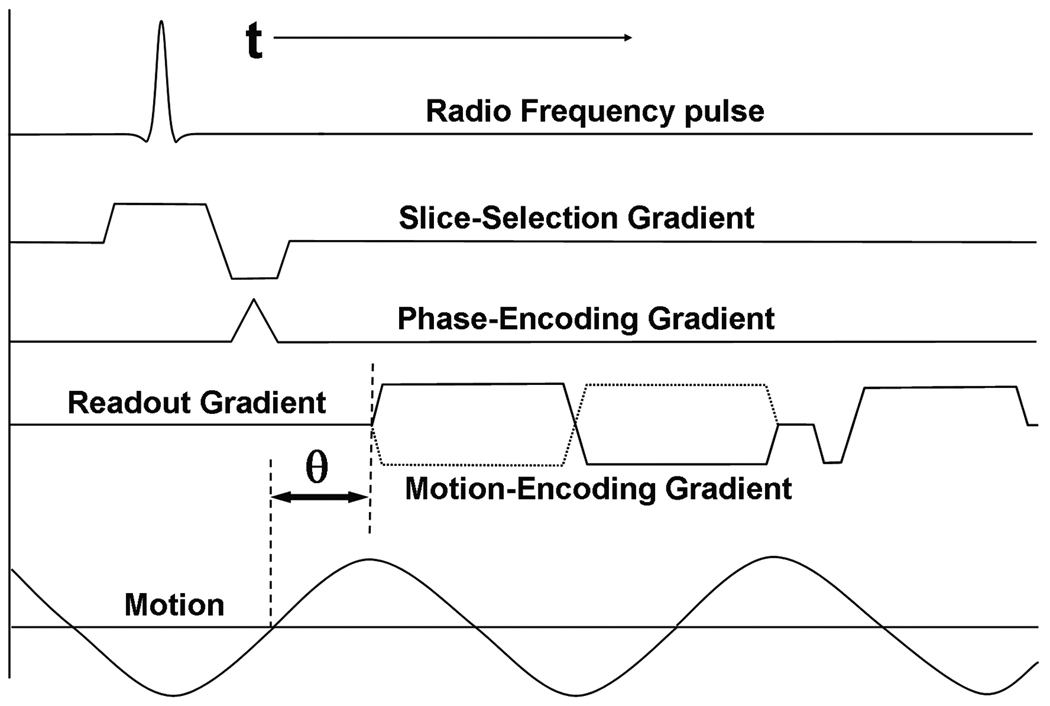
Figure 4 shows a typical MRE pulse sequence using a gradient-recalled echo with the conventional radiofrequency (RF) pulse waveform, slice-selection gradient, phase-encoding gradient and frequency-encoding gradient. The motion-encoding gradient (shown here only in the frequency-encoding direction) is placed after the RF excitation of the sample and before the measurement of the induced signal. Motion occurring in any direction can be encoded into the phase of the MR image by manipulating the axes on which the MEGs are placed. In this example, only the motion occurring in the frequency-encoding direction will be sensitized to and encoded into the image phase. The motion-encoding capability of this technique is very sensitive and can detect motion on the order of 100’s of nanometers (Muthupillai et al., 1996).
Figure 4. MRE pulse sequence.
Shown is an example of a gradient-recalled echo MRE pulse sequence diagram. A typical bipolar motion-encoding gradient (MEG) is shown (solid line) as well as the negative MEG (dotted line) used for phase-contrast imaging. The motion waveform and its temporal relationship (θ) with the MEG are also shown.
An MR image thus obtained containing information about the propagating wave in its phase is called a wave image. Typically two such wave images are collected with opposite polarity of the MEG and a phase-difference image is calculated to remove non-motion-related phase information. The solid and the dotted lines in Figure 4 indicate the MEG waveforms with opposed polarities used sequentially to produce these phase-difference wave images.
Figure 4 also schematically shows the induced continuous sinusoidal motion of the tissue and its temporal relationship with the MEG (θ). Changing this temporal relationship in subsequent acquisitions is utilized to acquire snapshots of the propagation of the waves, typically at 4–8 temporal samples (called phase offsets) spaced equally over a period of the wave motion, to show the propagation of the wave in MRE experiments and to permit processing of the data through time. From this temporal data, displacement information at the applied mechanical frequency can be extracted for subsequent processing and spurious phase information that is at other frequencies can be removed. In some applications where mechanical transient waves are being investigated as a tool to overcome some of the problems that arise due to the use of harmonic waves, such as wave reflections and interference, the series of images with increasing temporal delay values are acquired over a longer time interval to study the origination and evolution of the transient wave (McCracken et al., 2005).
Since the motion-encoding gradients necessary for MRE are inserted into conventional MR pulse sequences, MRE can be implemented with many MR imaging sequences, each with its own advantages and limitations. Various groups have demonstrated using different pulse sequences for different applications and hence MRE pulse sequences based on spin echo (SE), gradient-recalled echo (GRE), balanced steady-state free precision (bSSFP) and echo planar imaging (EPI) techniques exist (Bieri et al., 2006; Kruse et al., 2006; Maderwald et al., 2006; Rydberg et al., 2001). These pulse sequences can be designed to have the MEG frequency matched to the frequency of motion (optimally sensitive to motion of that particular frequency (Muthupillai et al., 1995)), a particular multiple of the motion frequency (which has lower motion sensitivity) to reduce the echo time for applications involving short-T2 tissues (Rump et al., 2007), or can be designed to be sensitive to motion with a broad range of frequencies (Asbach et al., 2008; Romano et al., 2003).
Mechanical Parameter Estimation
From the wave images indicating the propagation of shear waves in the tissue, mathematical inversion algorithms based on equations of motion, with simplifying assumptions like isotropy, homogeneity, and incompressibility, allow for the calculation of mechanical properties like the shear modulus to be used for clinical interpretations. The frequency-domain constitutive equation of motion for a general, homogeneous, anisotropic, viscoelastic material relates an applied stress to the resultant strain and can be expressed as a rank-4 tensor with 21 independent complex quantities (Auld, 1990). Making the assumption of isotropy reduces the number of independent quantities to two, typically the two Lamé constants λ and μ that predominantly control the longitudinal and shear strains, respectively. In soft tissues, the first Lamé parameter λ is usually much larger than the shear modulus μ, which makes the simultaneous calculation of both λ and μ impractical. However, the effect of λ can be simply neglected in some cases (if the excitation is primarily shear) or can be removed by filtering out longitudinal wave motion with bandpass filtering or curl filtering (Manduca et al., 2001).
The shear modulus μ is a complex quantity and can be written as μr + iμi, where μr indicates the storage modulus and μi is the loss modulus reflecting the attenuation of a viscoelastic medium. From the complex shear modulus at a particular frequency, the shear wave speed can be calculated and an effective shear modulus (often called the shear stiffness) can be calculated using the simple relation: μ = ρVs2, where ρ is the density of the material (typically assumed to be around 1000 kg/m3 for tissue in MRE) and Vs is the wave speed of the shear wave. Since the wave speed can be written as a product of the operating frequency and the spatial wavelength, early MRE analysis methods focused on measuring the wavelength of the shear wave and were initially manually performed. Later, automatic algorithms that could calculate the wavelength (local frequency estimation, LFE; phase gradient, PG) were adopted and implemented (Manduca et al., 1996). As the field grew, algorithms that solved the wave equation directly to calculate both μr and μi were developed (direct inversion, DI; (Oliphant et al., 2001)). Even with these methods, the stiffness values are still often reported as the product of density and squared wave speed out of convention and convenience. A detailed review of these methods is provided in (Manduca et al., 2001).
The images of the mechanical properties of tissue calculated in MRE are often referred to as elastograms and in this review all of the elastograms presented indicate the tissue shear stiffness at a single frequency of operation. Depending on the technique used to derive the elastograms from the original MR images, elastograms can theoretically (e.g., absent any noise) have half the resolution of the native MR images (which can range from 50 µm to 10 mm depending on the application), however they more typically have one-third to one-fifth of the MRI resolution. Shear wave interference can cause artifacts in the stiffness calculations using several of the above techniques, and a preprocessing technique called directional filtering has been developed to reduce these artifacts (Manduca et al., 2003a).
Applications
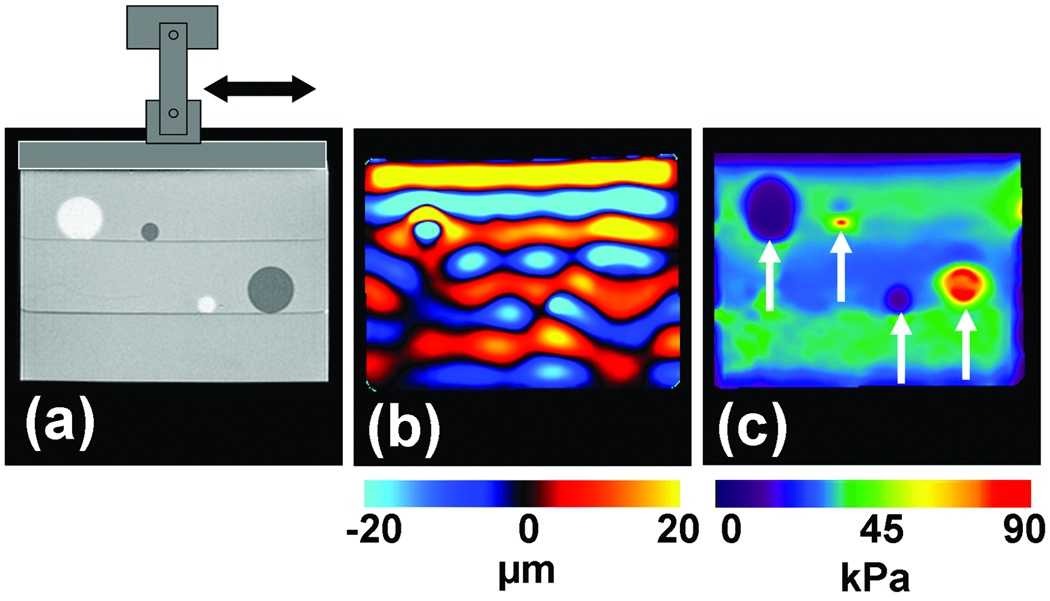
As is evident from the above discussion about MRE driver technology, imaging methods, and inversion techniques, there have been numerous MRE developments over the years, most of which have required preliminary testing before progressing to in vivo applications. Figure 5 shows an example of data obtained from a typical phantom experiment designed to test MRE principles in tissue-mimicking media. These phantoms are often constructed with regions of different stiffnesses. In this example, the background region is made up of a 2% agarose gelatin, the two soft inclusions that can be seen in the MR magnitude image in Figure 5a as hyperintense regions are made up of softer 1% agar and the hypointense stiff inclusions are made up of stiffer 3% agar.
Figure 5. MRE of an inclusion phantom.
(a) MR magnitude image of an inclusion phantom with soft and stiff inclusions seen as the hyperintense and hypointense regions, respectively. (b) A single wave image from the MRE acquisition performed at 100 Hz. The difference in the wavelengths in the different regions is evident. (c) An elastogram obtained from these data showing the stiff and soft regions.
An electromechanical shear driver, shown schematically in Figure 5a, induces harmonic shear waves (of 100 Hz in this particular example) into the phantom by vibrating in the direction indicated with the double-sided arrow. The propagation of these waves in the phantom is imaged with an MRE pulse sequence sensitive to motion in the horizontal direction. One of the wave images is shown in Figure 5b, where the displacement in the phantom due to the shear wave propagation is shown in units of microns. It can be seen that the wavelength decreases in the soft regions and increases in the stiff regions. From the wave data, a shear stiffness elastogram was calculated using the LFE inversion algorithm with directional filtering and is shown in Figure 5c in units of kPa. The stiffness contrast between the inclusions and the background gel is evident and both the soft and stiff inclusions can be visualized in this image based on the difference in their stiffnesses. Representative quantitative stiffness values for these regions can be calculated by averaging the values present in a region of interest drawn inside these regions. The values calculated for these regions were 32 kPa, 6 kPa and 85 kPa, respectively, for the background region, soft inclusions and the stiff inclusions.
Due to the flexibility, noninvasiveness and potential clinical applications, the field of MRE has been rapidly evolving with new applications emerging for various organs including liver, spleen, kidney, pancreas, brain, cartilage, prostate, heel fat pads, breast, heart, lungs, spinal cord, bone, eye, and muscle (Asbach et al., 2008; Chen et al., 2009; Chopra et al., 2009; Dresner et al., 2001; Goss et al., 2006; Huwart et al., 2007; Kemper et al., 2004; Kolipaka et al., 2009; Kruse et al., 2009; Kruse et al., 2008; Litwiller et al., 2010a; Litwiller et al., 2010b; Lopez et al., 2008; Mariappan et al., 2010; Mariappan et al., 2009c; McGee et al., 2008; Ringleb et al., 2007; Shah et al., 2004; Sinkus et al., 2005b; Weaver et al., 2005; Xu et al., 2007; Yin et al., 2007). Table 1 provides example shear stiffness values obtained (and the frequency at which they were calculated) using MRE for a select set of organs.
Table 1.
Typical shear stiffness values of various tissues.
| Tissue | Shear stiffness (kPa) |
Frequency of operation (Hz) |
References |
|---|---|---|---|
| Ocular Vitreous Humor | 0.01 | 10 | (Litwiller., 2010b) |
| Lung | 0.95 | 40 | (Goss et al., 2006) |
| Liver: Healthy Cirrhotic |
2.2 8.9 |
60 | (Yin et al., 2007) |
| Prostate: Central Peripheral |
2.2 3.3 |
65 | (Kemper et al., 2004) |
| Breast: Adipose tissue Fibroglandular tissue Tumor |
3.3 7.5 25 |
100 | (McKnight et al., 2002) |
| Brain: Gray matter White matter |
5.2 13.6 |
100 | (Kruse et al., 2008) |
| Muscle: Healthy Neuromuscular disease |
16.6 38.4 |
150 | (Basford et al., 2002) |
| Cartilage | 2000 | 5000 | (Lopez et al., 2008) |
| Bone | 0.8 × 10⁶ | 1500 | (Chen et al., 2009) |
The following discussion summarizes some of the current applications of MRE that are being investigated.
Liver MR Elastography
Magnetic resonance elastography has been widely investigated for the diagnosis of hepatic diseases (Huwart et al., 2007; Rouviere et al., 2006) and is currently used in clinical practice for fibrosis and cirrhosis assessment where the stiffness of the diseased liver is significantly higher than normal liver tissue stiffness (Venkatesh et al., 2008b). Clinical hepatic MRE is performed at a frequency of 60 Hz using pneumatic-based pressure-activated drivers. Wave data are acquired with four phase offsets and a modified direct-inversion algorithm with multiscale capabilities is used for the estimation of the liver stiffness.
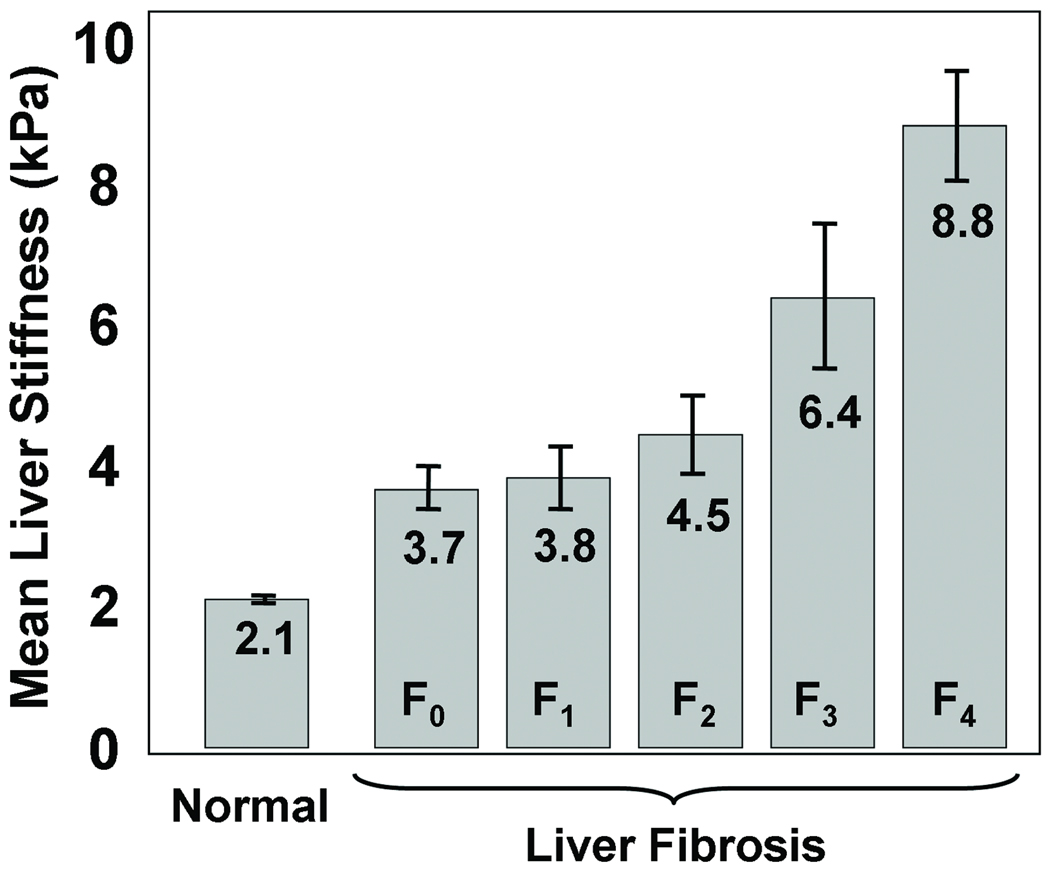
Figure 6 shows a graph (based on (Yin et al., 2007)) that shows the liver stiffness for volunteers with normal livers and for patients with livers at different stages of fibrosis. The stiffness of the liver is directly related to the fibrosis stage and it increases with the progression of the disease. Based on ROC analysis, a cutoff of 2.93 kPa was found to be an optimal threshold for distinguishing healthy livers from fibrotic ones, with sensitivity and specificity values of 98% and 99%, respectively. Other imaging methods, such as CT, ultrasound and conventional MRI are very limited in their capability of demonstrating the presence of liver fibrosis until the disease has advanced to irreversible cirrhosis (Faria et al., 2009; Talwalkar et al., 2008).
Figure 6. Liver stiffness due to Fibrosis.
MRE-derived stiffness of healthy liver tissue at 60 Hz compared to the stiffness of liver tissue at various stages of fibrosis. The stiffness increases gradually with the progression of the fibrosis. A cutoff of 2.93 kPa well differentiates the healthy and fibrotic livers.
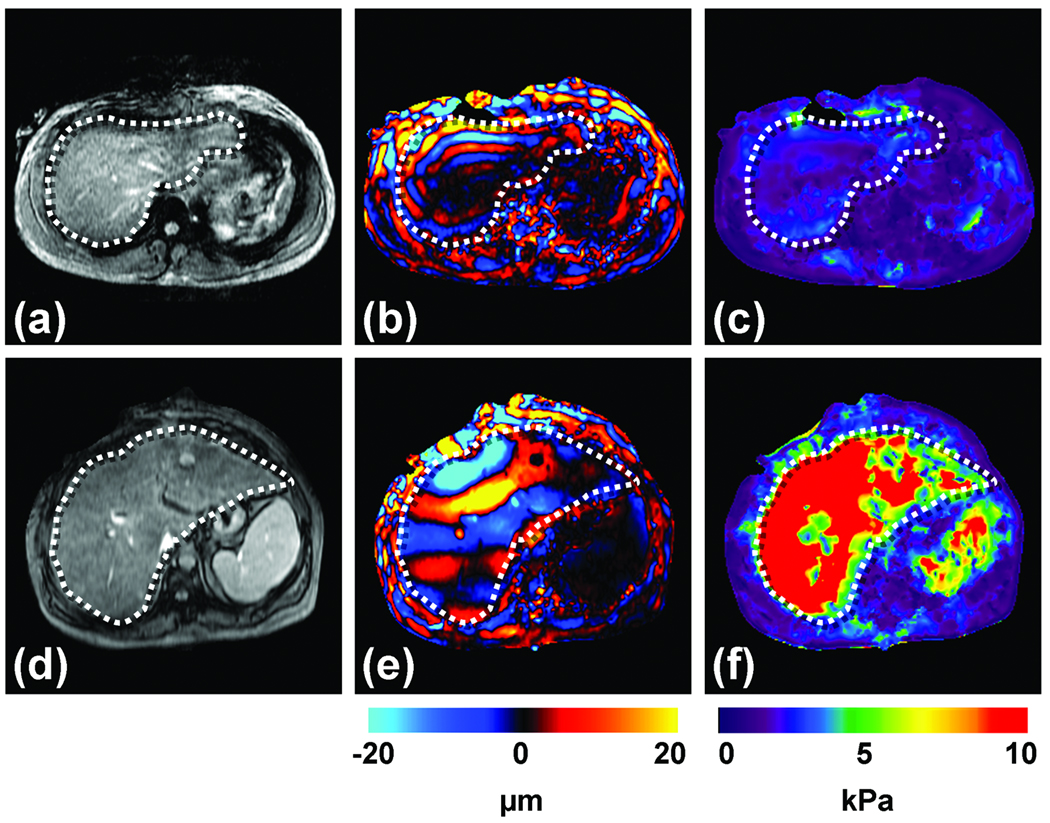
Two examples of clinical MRE exams are shown in Figure 7, one from a patient with a normal liver (top row) and another from a patient with cirrhosis (bottom row). The MR magnitude images of the normal liver and the diseased liver are shown in Figures 7a and 7d, respectively, with the boundaries of the livers marked with dotted lines. From these images, no information about the presence or the absence of the disease can be obtained. A single wave image obtained from MRE at 60 Hz is shown in Figures 7b and 7e for the normal and abnormal livers, respectively. It can be seen that the shear waves in the cirrhotic liver are longer than the shear waves in the normal liver. The corresponding stiffness estimates of the livers are shown in Figures 7c and 7f and the increased stiffness of the cirrhotic liver is evident. Quantitatively, the mean stiffness of the normal and the abnormal livers were calculated to be 1.7 kPa and 18.83 kPa respectively.
Figure 7. Hepatic MRE.
Results are shown from clinical hepatic MRE exams of a patient with a normal liver (top row) and a patient with a cirrhotic liver. (a,d) Conventional abdominal MR magnitude images of the two patients, showing no significant difference between the two livers. (b,e) Wave images from the MRE acquisition at 60 Hz showing shear waves with a shorter wavelength in the first patient, and a substantially longer wavelength in the second patient. (c,f) The corresponding elastograms indicating that the two livers were normal (1.7 kPa) and cirrhotic (18.83 kPa), respectively.
MRE is also being investigated as a means to characterize hepatic tumors and it has been found that malignant liver tumors have significantly greater mean shear stiffness than benign tumors and normal liver tissue and a cutoff value of 5 kPa can differentiate malignant tumors from benign tumors and normal liver parenchyma (Venkatesh et al., 2008a).
Breast MR Elastography
Another application of MRE that is being investigated with great interest is for the assessment of breast cancer (McKnight et al., 2002; Sinkus et al., 2005b). Breast tumors are known to be typically stiffer than benign lesions and normal breast tissue (Krouskop et al., 1998). Manual palpation is a recommended part of routine screening for breast cancer and helps in the detection of these hard masses (Barton et al., 1999). Contrast-enhanced MR imaging (CE-MRI) has proven to have a very high sensitivity for the detection of tumor nodules, but the specificity of the technique can be a problem (Heywang-Kobrunner et al., 1997) leading to numerous false positives and unnecessary biopsies. MRE is being investigated as a complementary technique to CE-MRI to provide additional information about these suspicious regions and the combined technique has shown promise to increase diagnostic specificity (Sinkus et al., 2007).
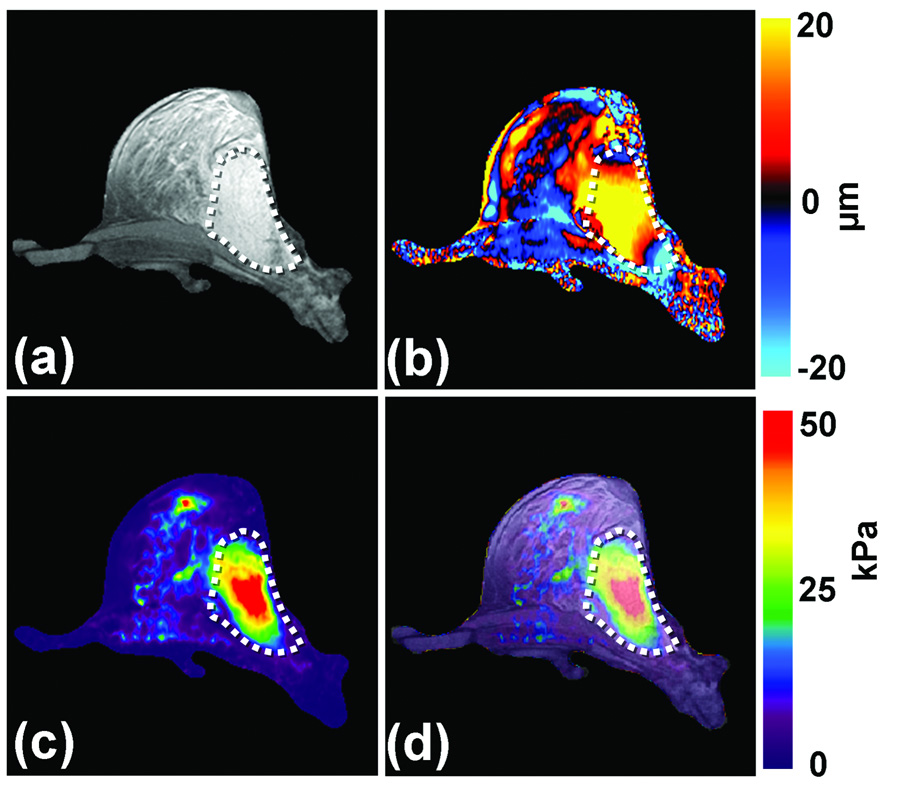
Figure 8 shows an example MRE exam of a patient with a known 5-cm adenocarcinoma. An anatomic MR image of the breast is shown in Figure 8a with the tumor outlined. 100-Hz shear waves were introduced into the breast tissue with the help of electromechanical drivers and wave images were obtained with a gradient-echo MRE sequence. One of the wave images is shown in Figure 8b showing that the shear wavelengths are longer in the tumor compared to the normal glandular tissues. The elastogram is shown in Figure 8c. As expected from the wave data, the tumor is significantly stiffer than the normal tissue. Figure 8d shows an overlay image of the stiffness map on the magnitude image of the breast and the stiff region correlates well with the location of the tumor.
Figure 8. Breast MRE.
(a) An axial MR magnitude image of the right breast of a patient volunteer is shown. A large adenocarcinoma is shown as the outlined, mildly hyperintense region on the lateral side of the breast. (b) A single wave image from MRE performed at 100 Hz is shown along with the corresponding elastogram (c). (d) An overlay image of the elastogram and the magnitude image shows good correlation between the tumor and the stiff region detected by MRE.
Skeletal Muscle MR Elastography
MRE has also been extensively investigated for studying the stiffness of skeletal muscle since it is well known that the stiffness changes significantly depending upon the contractile state of the muscle (Dresner et al., 2001; Duck, 1990; Ringleb et al., 2007; Sack et al., 2002). Skeletal muscle MRE can be used for studying the physiological response of diseased and damaged muscles. For instance, it has been found that there is a difference in the stiffness of muscles with and without neuromuscular disease (Basford et al., 2002).
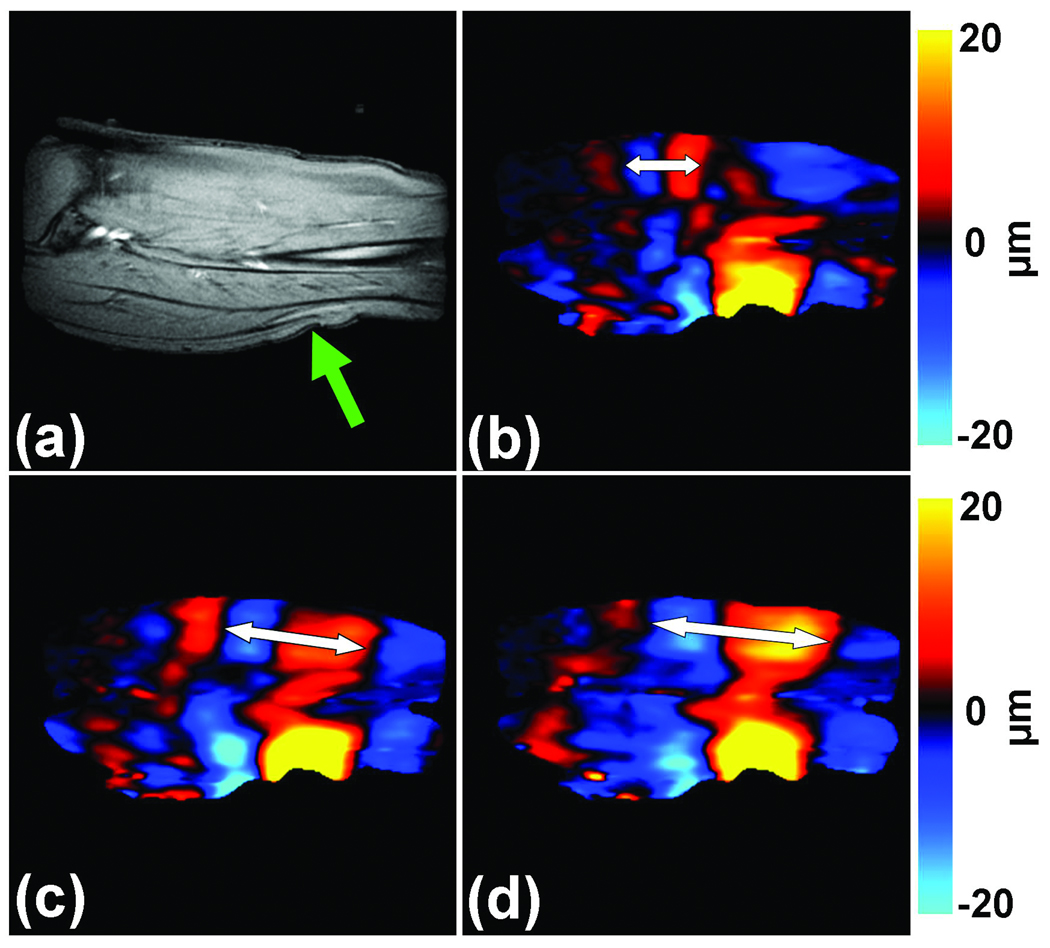
Figure 9 shows an example of MRE of the calf soleus muscle of a healthy subject. The MR magnitude image of the muscle in the imaged slice is shown in Figure 9a with the position of the electromechanical driver used to create the shear waves indicated by the arrow. The images in Figures 9b–d show wave images acquired using 100-Hz vibrations while the muscle was exerting forces of 0, 5 and 10 N/m, respectively, in a custom-built leg press. It can be seen that the wavelength of the waves increased as the force exerted by the muscle increased, as indicated by the double sided arrows. Due to the anisotropy of the muscle, usually the stiffness of muscle is calculated by manually measuring the shear wavelength along a 1D profile drawn in the direction of primary wave propagation along the muscle fibers, and the values for the data shown in Figures 9b–d were found to be 16, 36 and 96 kPa, respectively. In accordance with the wave images, the stiffness of the muscle increased as the force that it exerted increased.
Figure 9. Skeletal muscle MRE.
(a) A sagittal MR image of the calf soleus muscle with the location of the driver indicated by the arrow is shown. 100-Hz MRE wave images of the muscle are shown while exerting 0 (b), 5 (c) and 10 N/m (d) of force. The increase in the wavelength (and thus stiffness) with the increase in muscle force is easily visible and is indicated by the double sided arrows.
Brain MR Elastography
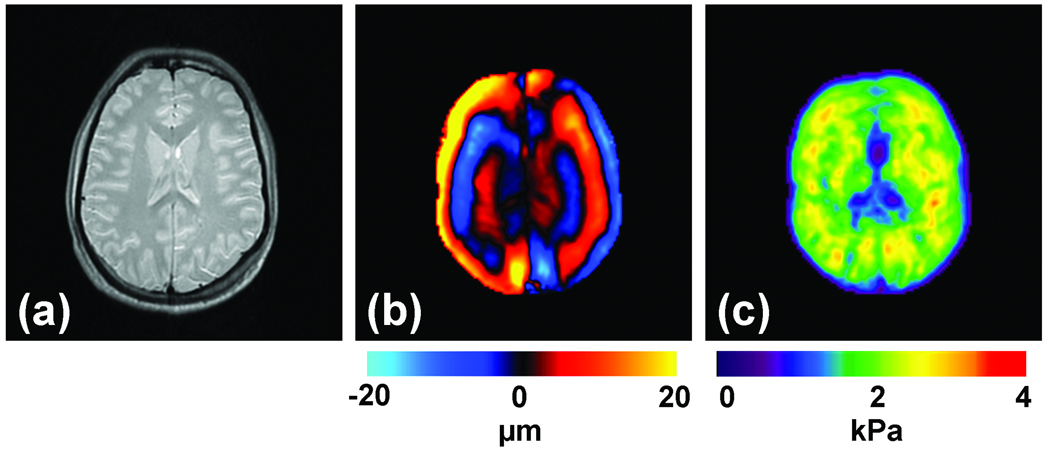
Assessment of the mechanical properties of brain tissue with MRE is another area of significant research and clinical interest (Green et al., 2008; Kruse et al., 2008; Xu et al., 2007) due to the diagnostic potential of brain tissue stiffness information as it may be related to diseases like Alzheimer’s disease, hydrocephalus, brain cancer and multiple sclerosis. While it would be difficult to use ultrasound-based approaches to noninvasively assess brain mechanical properties, MRE is well suited for this application. An example of brain MRE data from a healthy volunteer is shown in Figure 10. Multiple axial slices of the brain were imaged and the magnitude image of a single slice is shown in Figure 10a. Vibrations at 60 Hz were introduced into the brain with the help of a pressure-activated driver placed under the head. A single wave image and its corresponding elastogram are shown in Figures 10b and 10c, respectively.
Figure 10. Brain MRE.
(a) Shown is an axial MR magnitude image of the brain showing white matter, gray matter, and cerebrospinal fluid. (b) A single wave image from MRE performed at 60 Hz. (c) The corresponding elastogram is shown and a good correlation between the magnitude image and the stiffness estimate is evident.
MR Elastography for Visualizing Anatomy
The primary applications of MRE that have been developed have focused on the study of the mechanical properties of different tissues. However, the capability of MRE to measure the displacement of tissues has also been investigated to address other clinical questions. Such applications include a shearline imaging technique designed to investigate the functionality of slip interfaces and a vibration imaging technique used to localize the functional compartments of the forearm flexor muscles (Mariappan et al., 2009a; Mariappan et al., 2009b).
As an example of these applications, the vibration imaging technique is introduced here, the goal of which is to locate the finger-specific functional compartments of the extrinsic forearm flexor muscles that partly control the flexion of the interphalangeal joints of the index, middle, ring and little fingers. Even though these flexor muscles (flexor digitorum superficialis, FDS and flexor digitorum profundus, FDP) do not possess anatomically distinct compartments, they can exert almost independent action on specific fingers through selective activation of functional compartments specific for each finger (Bhadra et al., 1999; Fleckenstein et al., 1992; Jeneson et al., 1990). The knowledge of the location and boundaries of these segments is useful for localizing techniques like MR spectroscopy and biopsy, but is difficult to obtain currently. With the proposed vibration imaging technique based on MRE principles, this can be achieved by vibrating a finger of interest independently of the others and measuring the amount of motion within the forearm musculature that is transferred through the structurally connected tendons.
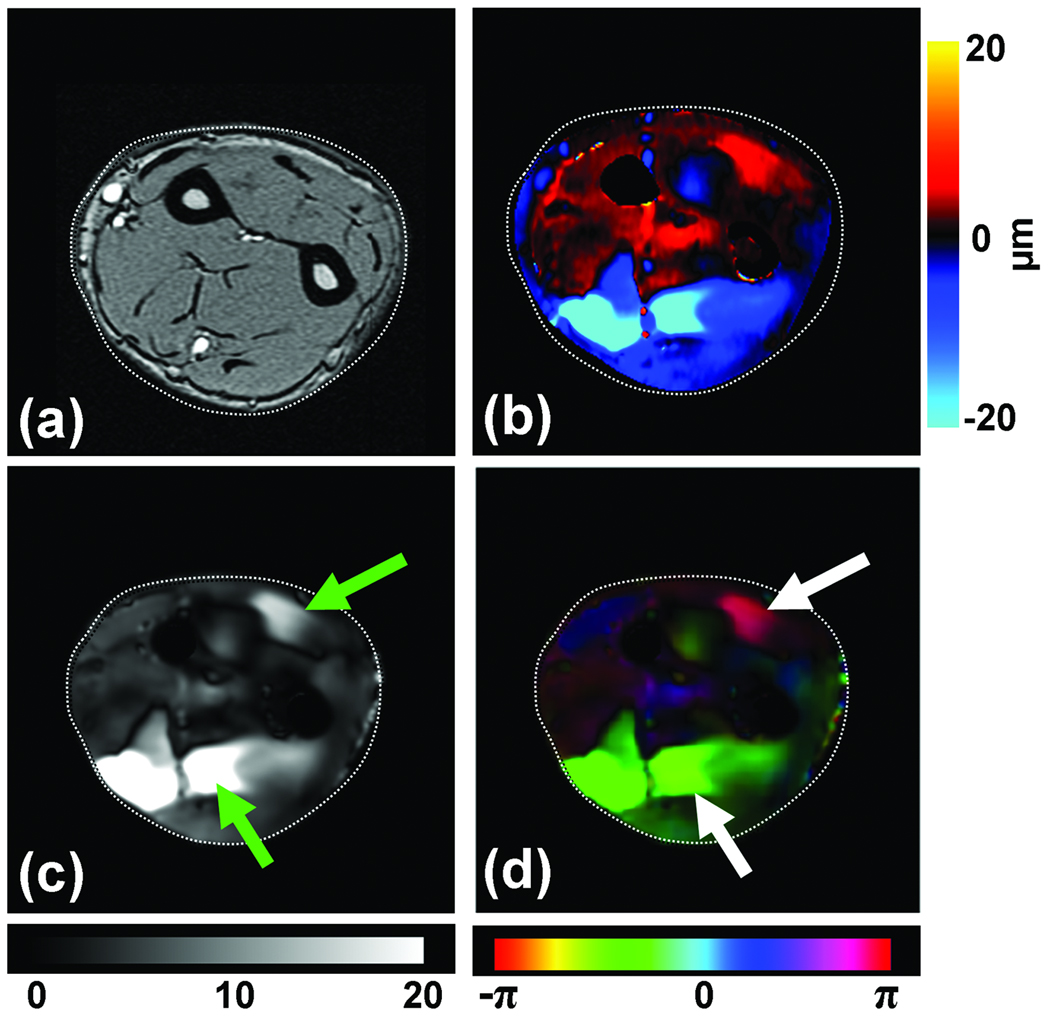
Preliminary data from this technique has indicated that it is capable of delineating these functional compartments and Figure 11 shows an example of vibration imaging data obtained with the ring finger selectively vibrated. Figure 11a shows the magnitude image of the imaged axial slice of the forearm. Figure 11b shows a wave image at this slice location with the MR imaging sequence sensitized to the through-plane motion of the forearm tissues when the ring finger alone was vibrated at a frequency of 90 Hz. Figures 11c and 11d show the amplitude and phase of the motion at the frequency of vibration obtained from a Fourier transformation of the wave images through time. It can be seen that distinct regions within the extrinsic flexor and extensor muscles (indicated by the arrows) had high displacement, indicating that these regions are mechanically coupled with the finger being vibrated. It can also be noticed from the motion amplitude image (Fig. 11c) that finger-specific compartments exist within both the flexor and extensor muscles, and from the phase image (11d) it can be seen that these compartments within the flexor and extensor regions move with opposite phase. Furthermore, it can be noted that the vibration of a single finger, in addition to creating motion within its own compartment, also elicited some low-amplitude motion within the compartments corresponding to other fingers, confirming the theory of incomplete subdivision of these functional compartments from previous electromyography studies (Reilly and Schieber, 2003). These findings indicate future potential applications for this technique for the study of hand and wrist biomechanics.
Figure 11. Functional compartments of the flexor muscles.
(a) MR magnitude image of the right forearm of a healthy volunteer. (b) An example wave image obtained using MRE motion encoding of tissue vibrations in the forearm induced by selectively vibrating the ring finger at 90 Hz. (c) An amplitude map obtained from wave images indicating localized regions of higher displacement corresponding to the compartments of the flexor and extensor muscles (arrows). (d) A phase map obtained from the wave images indicating that the compartments of the flexor and extensor muscles of the activated finger are moving out of phase with each other.
Challenges and Future Directions
There are many challenges and opportunities for further technical development of MRE. The effective spatial resolution of the technique increases as the frequency of the applied waves is increased. Unfortunately, high-frequency shear waves are attenuated more rapidly than low-frequency waves, so there can be a tradeoff between spatial resolution and distance from the vibration source in some applications. Improved driver technology for MRE, such as the use of arrays of multiple vibration sources, is also under investigation (Mariappan et al., 2009d). Very stiff tissues such as bone, tendon, and cartilage require much higher vibration frequencies (in the kilohertz range) than soft tissues for evaluation with MRE. Current MRI scanners do not have gradient hardware that is capable of encoding wave motion at such high frequencies. These limitations may be addressed in the future with specialized hardware solutions (Lopez et al., 2008). While simple 2-dimensional sectional wave imaging may be adequate for some applications of MRE, many other applications require acquisition of wave data from an entire 3D volume. This type of acquisition may be prohibitively long using conventional sequences, but is becoming more practical with the introduction of special high-speed imaging techniques such as echo planar and parallel imaging in MRE (Glaser et al., 2006; Kruse et al., 2006). The mathematical techniques used to process the wave data to generate elastograms have also improved significantly in recent years, but there are still many opportunities to advance these methods and to generate additional tissue characterization parameters, such as estimates of mechanical anisotropy, nonlinearity, and viscoelastic behavior (Asbach et al., 2008; Manduca et al., 2003b; Romano et al., 2005; Sack et al., 2002; Sack et al., 2004; Sinkus et al., 2005a; Sinkus et al., 2005b).
Conclusions
Elasticity imaging has received considerable attention due to its intuitive source of mechanical contrast paralleling the information provided by palpation and the significant diagnostic potential that this information can provide. Magnetic resonance elastography is an MRI-based technique which is capable of noninvasively assessing tissue stiffness and it has already been shown to be beneficial as a clinical tool for the diagnosis of hepatic fibrosis. A number of other applications of MRE for determining tissue properties, structure, and function, such as the ones discussed here, are being investigated which could offer valuable information to clinicians and researchers in the future and interest in the field continues to grow rapidly.
Acknowledgments
Grant Support: NIH EB001981
References
- Asbach P, Klatt D, Hamhaber U, Braun J, Somasundaram R, Hamm B, Sack I. Assessment of liver viscoelasticity using multifrequency MR elastography. Magn Reson Med. 2008;60:373–379. doi: 10.1002/mrm.21636. [DOI] [PubMed] [Google Scholar]
- Auld BA. Acoustic fields and waves in solids. 2nd ed. Malabar, Florida: R.E. Krieger; 1990. [Google Scholar]
- Axel L, Dougherty L. MR imaging of motion with spatial modulation of magnetization. Radiology. 1989;171:841–845. doi: 10.1148/radiology.171.3.2717762. [DOI] [PubMed] [Google Scholar]
- Bae U, Dighe M, Dubinsky T, Minoshima S, Shamdasani V, Kim Y. Ultrasound thyroid elastography using carotid artery pulsation: preliminary study. Journal of Ultrasound in Medicine. 2007;26:797–805. doi: 10.7863/jum.2007.26.6.797. [DOI] [PubMed] [Google Scholar]
- Barton MB, Harris R, Fletcher SW. Does This Patient Have Breast Cancer?: The Screening Clinical Breast Examination: Should It Be Done? How? JAMA. 1999;282:1270–1280. doi: 10.1001/jama.282.13.1270. [DOI] [PubMed] [Google Scholar]
- Basford JR, Jenkyn TR, An KN, Ehman RL, Heers G, Kaufman KR. Evaluation of healthy and diseased muscle with magnetic resonance elastography. Archive of Physical Medicine and Rehabilitation. 2002;83:1530–1536. doi: 10.1053/apmr.2002.35472. [DOI] [PubMed] [Google Scholar]
- Bercoff J, Tanter M, Fink M. Supersonic shear imaging: a new technique for soft tissue elasticity mapping. Ultrasonics, Ferroelectrics and Frequency Control, IEEE Transactions on. 2004;51:396–409. doi: 10.1109/tuffc.2004.1295425. [DOI] [PubMed] [Google Scholar]
- Bernstein MA, King KF, Zhou XJ. Handbook of MRI pulse sequences, Illustrated ed. Elsevier; 2004. [Google Scholar]
- Bhadra N, Keith MW, Peckham PH. Variations in innervation of the flexor digitorum profundus muscle. J Hand Surg [Am] 1999;24:700–703. doi: 10.1053/jhsu.1999.0700. [DOI] [PubMed] [Google Scholar]
- Bieri O, Maderwald S, Ladd ME, Scheffler K. Balanced alternating steady-state elastography. Magnetic Resonance in Medicine. 2006;55:233–241. doi: 10.1002/mrm.20812. [DOI] [PubMed] [Google Scholar]
- Braun J, Braun K, Sack I. Electromagnetic actuator for generating variably oriented shear waves in MR elastography. Magnetic Resonance in Medicine. 2003;50:220–222. doi: 10.1002/mrm.10479. [DOI] [PubMed] [Google Scholar]
- Chen J, McGregor H, Glaser K, Mariappan Y, Kolipaka A, Ehman R. Magnetic Resonance Elastography in Trabecular Bone: Preliminary Results. Proceedings 17th Scientific Meeting, International Society for Magnetic Resonance in Medicine; Honolul. 2009. p. 847. [Google Scholar]
- Chen J, Ni C, Zhuang T. Imaging mechanical shear waves induced by piezoelectric ceramics in magnetic resonance elastography. Chinese Science Bulletin. 2006;51:755–760. doi: 10.1109/IEMBS.2005.1616122. [DOI] [PubMed] [Google Scholar]
- Chenevert TL, Skovoroda AR, O'Donnell M, Emelianov SY. Elasticity reconstructive imaging by means of stimulated echo MRI. Magnetic Resonance in Medicine. 1998;39:482–490. doi: 10.1002/mrm.1910390319. [DOI] [PubMed] [Google Scholar]
- Chopra R, Arani A, Huang Y, Musquera M, Wachsmuth J, Bronskill M, Plewes D. In vivo MR elastography of the prostate gland using a transurethral actuator. Magn Reson Med. 2009;62:665–671. doi: 10.1002/mrm.22038. [DOI] [PubMed] [Google Scholar]
- de Ledinghen V, Le Bail B, Rebouissoux L, Fournier C, Foucher J, Miette V, Castera L, Sandrin L, Merrouche W, Lavrand F, Lamireau T. Liver stiffness measurement in children using FibroScan: feasibility study and comparison with fibrotest, aspartate transaminase to platelets ratio index, and liver biopsy. Journal of Pediatric Gastroenterology and Nutrition. 2007;45:443–450. doi: 10.1097/MPG.0b013e31812e56ff. [DOI] [PubMed] [Google Scholar]
- Dresner MA, Rose GH, Rossman PJ, Muthupillai R, Manduca A, Ehman RL. Magnetic resonance elastography of skeletal muscle. J Magn Reson Imaging. 2001;13:269–276. doi: 10.1002/1522-2586(200102)13:2<269::aid-jmri1039>3.0.co;2-1. [DOI] [PubMed] [Google Scholar]
- Duck FA. Physical Properties of Tissues -- A Comprehensive Reference Book. 6th edition 1990. [Google Scholar]
- Egorov V, Ayrapetyan S, Sarvazyan AP. Prostate mechanical imaging: 3-D image composition and feature calculations. Medical Imaging, IEEE Transactions on. 2006;25:1329–1340. doi: 10.1109/tmi.2006.880667. [DOI] [PMC free article] [PubMed] [Google Scholar]
- Ehman EC, Rossman PJ, Kruse SA, Sahakian AV, Glaser KJ. Vibration safety limits for magnetic resonance elastography. Phys Med Biol. 2008;53:925–935. doi: 10.1088/0031-9155/53/4/007. [DOI] [PMC free article] [PubMed] [Google Scholar]
- Elias D, Sideris L, Pocard M, de Baere T, Dromain C, Lassau N, Lasser P. Incidence of Unsuspected and Treatable Metastatic Disease Associated With Operable Colorectal Liver Metastases Discovered Only at Laparotomy (and Not Treated When Performing Percutaneous Radiofrequency Ablation) Ann Surg Oncol. 2005;12:298–302. doi: 10.1245/ASO.2005.03.020. [DOI] [PubMed] [Google Scholar]
- Faria SC, Ganesan K, Mwangi I, Shiehmorteza M, Viamonte B, Mazhar S, Peterson M, Kono Y, Santillan C, Casola G, Sirlin CB. MR imaging of liver fibrosis: current state of the art. Radiographics. 2009;29:1615–1635. doi: 10.1148/rg.296095512. [DOI] [PMC free article] [PubMed] [Google Scholar]
- Fleckenstein JL, Watumull D, Bertocci LA, Parkey RW, Peshock RM. Finger-specific flexor recruitment in humans: depiction by exercise-enhanced MRI. J Appl Physiol. 1992;72:1974–1977. doi: 10.1152/jappl.1992.72.5.1974. [DOI] [PubMed] [Google Scholar]
- Gierke HE, Oestreicher HL, Franke EK, Parrack HO, Wittern WW. Physics of vibrations in living tissues. J Appl Physiol. 1952;4:886–900. doi: 10.1152/jappl.1952.4.12.886. [DOI] [PubMed] [Google Scholar]
- Glaser KJ, Felmlee JP, Ehman RL. Rapid MR elastography using selective excitations. Magn Reson Med. 2006;55:1381–1389. doi: 10.1002/mrm.20913. [DOI] [PubMed] [Google Scholar]
- Goss BC, McGee KP, Ehman EC, Manduca A, Ehman RL. Magnetic resonance elastography of the lung: technical feasibility. Magn Reson Med. 2006;56:1060–1066. doi: 10.1002/mrm.21053. [DOI] [PubMed] [Google Scholar]
- Green MA, Bilston LE, Sinkus R. In vivo brain viscoelastic properties measured by magnetic resonance elastography. NMR in Biomedicine. 2008;21:755–764. doi: 10.1002/nbm.1254. [DOI] [PubMed] [Google Scholar]
- Greenleaf JF, Fatemi M, Insana M. Selected methods for imaging elastic properties of biological tissues. Annual Review of Biomedical Engineering. 2003;5:57–78. doi: 10.1146/annurev.bioeng.5.040202.121623. [DOI] [PubMed] [Google Scholar]
- Heywang-Kobrunner SH, Viehweg P, Heinig A, Kuchler C. Contrast-enhanced MRI of the breast: accuracy, value, controversies, solutions. European Journal of Radiology. 1997;24:94–108. doi: 10.1016/s0720-048x(96)01142-4. [DOI] [PubMed] [Google Scholar]
- Huwart L, Sempoux C, Salameh N, Jamart J, Annet L, Sinkus R, Peeters F, ter Beek LC, Horsmans Y, Van Beers BE. Liver fibrosis: noninvasive assessment with MR elastography versus aspartate aminotransferase-to-platelet ratio index. Radiology. 2007;245:458–466. doi: 10.1148/radiol.2452061673. [DOI] [PubMed] [Google Scholar]
- Jeneson JA, Taylor JS, Vigneron DB, Willard TS, Carvajal L, Nelson SJ, Murphy-Boesch J, Brown TR. 1H MR imaging of anatomical compartments within the finger flexor muscles of the human forearm. Magn Reson Med. 1990;15:491–496. doi: 10.1002/mrm.1910150316. [DOI] [PubMed] [Google Scholar]
- Kanai H. Viscoelasticity measurement of heart wall in in vivo; Ultrasonics Symposium, 2004 IEEE; 2004. pp. 482–485. [Google Scholar]
- Kemper J, Sinkus R, Lorenzen J, Nolte-Ernsting C, Stork A, Adam G. MR elastography of the prostate: initial in vivo application. RoFo; Fortschritte auf dem Gebiete der Rontgenstrahlen und der Nuklearmedizin. 2004;176:1094–1099. doi: 10.1055/s-2004-813279. [DOI] [PubMed] [Google Scholar]
- Kolipaka A, McGee KP, Araoz PA, Glaser KJ, Manduca A, Romano AJ, Ehman RL. MR elastography as a method for the assessment of myocardial stiffness: comparison with an established pressure-volume model in a left ventricular model of the heart. Magn Reson Med. 2009;62:135–140. doi: 10.1002/mrm.21991. [DOI] [PMC free article] [PubMed] [Google Scholar]
- Krouskop TA, Dougherty DR, Vinson FS. A pulsed Doppler ultrasonic system for making noninvasive measurements of the mechanical properties of soft tissue. J Rehabil Res Dev. 1987;24:1–8. [PubMed] [Google Scholar]
- Krouskop TA, Wheeler TM, Kallel F, Garra BS, Hall T. Elastic moduli of breast and prostate tissues under compression. Ultrason Imaging. 1998;20:260–274. doi: 10.1177/016173469802000403. [DOI] [PubMed] [Google Scholar]
- Kruse S, Kolipaka A, Manduca A, Ehman R. Feasibility of Evaluating the Spinal Cord with MR Elastography. Proceedings 17th Scientific Meeting, International Society for Magnetic Resonance in Medicine; Honolulu. 2009. p. 629. [Google Scholar]
- Kruse SA, Grimm RC, Lake DS, Manduca A, Ehman RL. Fast EPI based 3D MR elastography of the brain. Proceedings of the International Society for Magnetic Resonance in Medicine; Seattle, Washington. 2006. p. 3385. [Google Scholar]
- Kruse SA, Rose GH, Glaser KJ, Manduca A, Felmlee JP, Jack CR, Ehman RL. Magnetic resonance elastography of the brain. NeuroImage. 2008;39:231–237. doi: 10.1016/j.neuroimage.2007.08.030. [DOI] [PMC free article] [PubMed] [Google Scholar]
- Lerner RM, Huang SR, Parker KJ. 'Sonoelasticity' images derived from ultrasound signals in mechanically vibrated tissues. Ultrasound in Medicine and Biology. 1990;16:231–239. doi: 10.1016/0301-5629(90)90002-t. [DOI] [PubMed] [Google Scholar]
- Levinson SF, Shinagawa M, Sato T. Sonoelastic determination of human skeletal-muscle elasticity. Journal of Biomechanics. 1995;28:1145–1154. doi: 10.1016/0021-9290(94)00173-2. [DOI] [PubMed] [Google Scholar]
- Litwiller D, Lee S, Kolipaka A, Glaser K, Pulido J, Ehman R. MR Elastography of the Ex vivo Bovine Globe. J Magn Reson Imaging. 2010a doi: 10.1002/jmri.22217. Accepted with minor revisions. 2010. [DOI] [PMC free article] [PubMed] [Google Scholar]
- Litwiller D, Mariappan YK, Ehman R. MRE of the Ocular Vitreous body. Proceedings 18th Scientific Meeting, International Society for Magnetic Resonance in Medicine; Stockholm. 2010b. [Google Scholar]
- Lopez O, Amrami KK, Manduca A, Ehman RL. Characterization of the dynamic shear properties of hyaline cartilage using high-frequency dynamic MR elastography. Magnetic Resonance in Medicine. 2008;59:356–364. doi: 10.1002/mrm.21474. [DOI] [PubMed] [Google Scholar]
- Maderwald S, Uffmann K, Galban CJ, de Greiff A, Ladd ME. Accelerating MR elastography: a multiecho phase-contrast gradient-echo sequence. Journal of Magnetic Resonance Imaging. 2006;23:774–780. doi: 10.1002/jmri.20570. [DOI] [PubMed] [Google Scholar]
- Mai JJ, Insana MF. Strain imaging of internal deformation. Ultrasound in Medicine and Biology. 2002;28:1475–1484. doi: 10.1016/s0301-5629(02)00645-2. [DOI] [PubMed] [Google Scholar]
- Manduca A, Lake DS, Kruse SA, Ehman RL. Spatio-temporal directional filtering for improved inversion of MR elastography images. Medical Image Analysis. 2003a;7:465–473. doi: 10.1016/s1361-8415(03)00038-0. [DOI] [PubMed] [Google Scholar]
- Manduca A, Lake DS, Kugel JL, Rossman PJ, Ehman RL. Dispersion measurements from simultaneous multi-frequency MR elastography. Toronto, Ontario, Canada: International Society for Magnetic Resonace in Medicine; 2003b. p. 550. [Google Scholar]
- Manduca A, Muthupillai R, Rossman PJ, Greenleaf JF, Ehman RL. Local wavelength estimation for magnetic resonance elastography. Image Processing, 1996. Proceedings., International Conference on; 1996. pp. 527–530. [Google Scholar]
- Manduca A, Oliphant TE, Dresner MA, Mahowald JL, Kruse SA, Amromin E, Felmlee JP, Greenleaf JF, Ehman RL. Magnetic resonance elastography: non-invasive mapping of tissue elasticity. Med Image Anal. 2001;5:237–254. doi: 10.1016/s1361-8415(00)00039-6. [DOI] [PubMed] [Google Scholar]
- Mariappan YK, Glaser KJ, Manduca A, Ehman RL. Cyclic motion encoding for enhanced MR visualization of slip interfaces. J Magn Reson Imaging. 2009a;30:855–863. doi: 10.1002/jmri.21914. [DOI] [PMC free article] [PubMed] [Google Scholar]
- Mariappan YK, Glaser KJ, Manduca A, Ehman RL. Vibration Imaging for Functional Analysis of Flexor Muscle Compartments. J Magn Reson Imaging. 2009b doi: 10.1002/jmri.22183. In Press, 2010. [DOI] [PMC free article] [PubMed] [Google Scholar]
- Mariappan YK, Glaser KJ, Manduca A, Ehman RL, McGee KP. MRE of In Vivo Human Lung Parenchyma: Feasibility Study of Motion Encoding using the Imaging Gradients with 1H MRI. Proceedings of the International Society for Magnetic Resonance in Medicine.2010. [Google Scholar]
- Mariappan YK, Glaser KJ, Manduca A, Romano AJ, Venkatesh SK, Yin M, Ehman RL. High-frequency mode conversion technique for stiff lesion detection with magnetic resonance elastography (MRE) Magn Reson Med. 2009c;62:1457–1465. doi: 10.1002/mrm.22091. [DOI] [PMC free article] [PubMed] [Google Scholar]
- Mariappan YK, Rossman PJ, Glaser KJ, Manduca A, Ehman RL. Magnetic resonance elastography with a phased-array acoustic driver system. Magn Reson Med. 2009d;61:678–685. doi: 10.1002/mrm.21885. [DOI] [PMC free article] [PubMed] [Google Scholar]
- McCracken PJ, Manduca A, Felmlee JP, Ehman RL. Mechanical transient-based magnetic resonance elastography. Magnetic Resonance in Medicine. 2005;53:628–639. doi: 10.1002/mrm.20388. [DOI] [PubMed] [Google Scholar]
- McGee KP, Hubmayr RD, Ehman RL. MR elastography of the lung with hyperpolarized 3He. Magnetic Resonance in Medicine. 2008;59:14–18. doi: 10.1002/mrm.21465. [DOI] [PubMed] [Google Scholar]
- McKnight AL, Kugel JL, Rossman PJ, Manduca A, Hartmann LC, Ehman RL. MR elastography of breast cancer: preliminary results. American Journal of Roentgenology. 2002;178:1411–1417. doi: 10.2214/ajr.178.6.1781411. [DOI] [PubMed] [Google Scholar]
- Moran PR. A flow velocity zeugmatographic interlace for NMR imaging in humans. Magn Reson Imaging. 1982;1:197–203. doi: 10.1016/0730-725x(82)90170-9. [DOI] [PubMed] [Google Scholar]
- Muthupillai R, Lomas DJ, Rossman PJ, Greenleaf JF, Manduca A, Ehman RL. Magnetic resonance elastography by direct visualization of propagating acoustic strain waves. Science. 1995;269:1854–1857. doi: 10.1126/science.7569924. [DOI] [PubMed] [Google Scholar]
- Muthupillai R, Rossman PJ, Lomas DJ, Greenleaf JF, Riederer SJ, Ehman RL. Magnetic resonance imaging of transverse acoustic strain waves. Magnetic Resonance in Medicine. 1996;36:266–274. doi: 10.1002/mrm.1910360214. [DOI] [PubMed] [Google Scholar]
- Nightingale KR, Palmeri ML, Nightingale RW, Trahey GE. On the feasibility of remote palpation using acoustic radiation force. The Journal of the Acoustical Society of America. 2001;110:625–634. doi: 10.1121/1.1378344. [DOI] [PubMed] [Google Scholar]
- O'Donnell M, Skovoroda AR, Shapo BM, Emelianov SY. Internal displacement and strain imaging using ultrasonic speckle tracking. Ultrasonics, Ferroelectrics and Frequency Control, IEEE Transactions on. 1994;41:314–325. [Google Scholar]
- Oliphant TE, Manduca A, Ehman RL, Greenleaf JF. Complex-valued stiffness reconstruction for magnetic resonance elastography by algebraic inversion of the differential equation. Magn Reson Med. 2001;45:299–310. doi: 10.1002/1522-2594(200102)45:2<299::aid-mrm1039>3.0.co;2-o. [DOI] [PubMed] [Google Scholar]
- Ophir J, cespedes I, Ponnekanti H, Yazdi Y, Li X. Elastography : a quantitative method for imaging the elasticity of biological tissues. Ultrason Imaging. 1991;13(2):111–134. doi: 10.1177/016173469101300201. [DOI] [PubMed] [Google Scholar]
- Osman NF. Detecting stiff masses using strain-encoded (SENC) imaging. Magnetic Resonance in Medicine. 2003;49:605–608. doi: 10.1002/mrm.10376. [DOI] [PubMed] [Google Scholar]
- Othman SF, Xu H, Royston TJ, Magin RL. Microscopic magnetic resonance elastography (μMRE) Magnetic Resonance in Medicine. 2005;54:605–615. doi: 10.1002/mrm.20584. [DOI] [PubMed] [Google Scholar]
- Plewes DB, Betty I, Urchuk SN, Soutar I. Visualizing tissue compliance with MR imaging. J Magn Reson Imaging. 1995;5:733–738. doi: 10.1002/jmri.1880050620. [DOI] [PubMed] [Google Scholar]
- Reilly KT, Schieber MH. Incomplete functional subdivision of the human multitendoned finger muscle flexor digitorum profundus: an electromyographic study. J Neurophysiol. 2003;90:2560–2570. doi: 10.1152/jn.00287.2003. [DOI] [PubMed] [Google Scholar]
- Ringleb SI, Bensamoun SF, Chen Q, Manduca A, An KN, Ehman RL. Applications of magnetic resonance elastography to healthy and pathologic skeletal muscle. J Magn Reson Imaging. 2007;25:301–309. doi: 10.1002/jmri.20817. [DOI] [PubMed] [Google Scholar]
- Rogowska J, Patel NA, Fujimoto JG, Brezinski ME. Optical coherence tomographic elastography technique for measuring deformation and strain of atherosclerotic tissues. Heart. 2004;90:556–562. doi: 10.1136/hrt.2003.016956. [DOI] [PMC free article] [PubMed] [Google Scholar]
- Romano AJ, Abraham PB, Rossman PJ, Bucaro JA, Ehman RL. Determination and analysis of guided wave propagation using magnetic resonance elastography. Magn Reson Med. 2005;54:893–900. doi: 10.1002/mrm.20607. [DOI] [PubMed] [Google Scholar]
- Romano AJ, Rossman PJ, Grimm RC, Bucaro JA, Ehman RL. Broad-spectrum beam magnetic resonance elastography. Toronto, Ontario, Canada: International Society for Magnetic Resonance in Medicine; 2003. [Google Scholar]
- Rouviere O, Yin M, Dresner MA, Rossman PJ, Burgart LJ, Fidler JL, Ehman RL. MR Elastography of the Liver: Preliminary Results. Radiology. 2006;240:440–448. doi: 10.1148/radiol.2402050606. [DOI] [PubMed] [Google Scholar]
- Ruikang KW, Zhenhe M, Sean JK. Tissue Doppler optical coherence elastography for real time strain rate and strain mapping of soft tissue. Applied Physics Letters. 2006;89:144103. [Google Scholar]
- Rump J, Klatt D, Braun J, Warmuth C, Sack I. Fractional encoding of harmonic motions in MR elastography. Magn Reson Med. 2007;57:388–395. doi: 10.1002/mrm.21152. [DOI] [PubMed] [Google Scholar]
- Rydberg J, Grimm R, Kruse S, Felmlee J, McCracken P, Ehman R. Fast spin-echo magnetic resonance elastography of the brain. Proceedings of the International Society for Magnetic Resonance in Medicine; Glasgow, Scotland: International Society for Magnetic Resonance in Medicine; 2001. p. 1647. [Google Scholar]
- Sack I, Bernarding J, Braun J. Analysis of wave patterns in MR elastography of skeletal muscle using coupled harmonic oscillator simulations. Magn Reson Imaging. 2002;20:95–104. doi: 10.1016/s0730-725x(02)00474-5. [DOI] [PubMed] [Google Scholar]
- Sack I, Mcgowan CK, Samani A, Luginbuhl C, Oakden W, Plewes DB. Observation of nonlinear shear wave propagation using magnetic resonance elastography. Magnetic Resonance in Medicine. 2004;52:842–850. doi: 10.1002/mrm.20238. [DOI] [PubMed] [Google Scholar]
- Sandrin L, Fourquet B, Hasquenoph JM, Yon S, Fournier C, Mal F, Christidis C, Ziol M, Poulet B, Kazemi F, Beaugrand M, Palau R. Transient elastography: a new noninvasive method for assessment of hepatic fibrosis. Ultrasound Med Biol. 2003;29:1705–1713. doi: 10.1016/j.ultrasmedbio.2003.07.001. [DOI] [PubMed] [Google Scholar]
- Sarvazyan A. Mechanical imaging - a new technology for medical diagnostics. International Journal of Medical Informatics. 1998;49:195–216. doi: 10.1016/s1386-5056(98)00040-9. [DOI] [PubMed] [Google Scholar]
- Sarvazyan AP, Skovoroda AR, Emelianov SY, Fowlkes JB, Pipe JG, Adler RS, Buxton RB, Carson PL. Biophysical Bases of Elasticity Imaging. In: JP Jones., editor. Acoustical Imaging. New York: Plenum Press; 1995. pp. 223–240. [Google Scholar]
- Shah NS, Kruse SA, Lager DJ, Farell-Baril G, Lieske JC, King BF, Ehman RL. Evaluation of renal parenchymal disease in a rat model with magnetic resonance elastography. Magn Reson Med. 2004;52:56–64. doi: 10.1002/mrm.20101. [DOI] [PubMed] [Google Scholar]
- Sinkus R, Lorenzen J, Schrader D, Lorenzen M, Dargatz M, Holz D. In vivo tensor MR-elastography - anisotropy of mamma-carcinoma. Proceedings of the International Society for Magnetic Resonance in Medicine; Denver, Colorado. 2000. p. 493. [Google Scholar]
- Sinkus R, Siegmann K, Xydeas T, Tanter M, Claussen C, Fink M. MR elastography of breast lesions: understanding the solid/liquid duality can improve the specificity of contrast-enhanced MR mammography. Magn Reson Med. 2007;58:1135–1144. doi: 10.1002/mrm.21404. [DOI] [PubMed] [Google Scholar]
- Sinkus R, Tanter M, Catheline S, Lorenzen J, Kuhl C, Sondermann E, Fink M. Imaging anisotropic and viscous properties of breast tissue by magnetic resonance elastography. Magnetic Resonance in Medicine. 2005a;53:372–387. doi: 10.1002/mrm.20355. [DOI] [PubMed] [Google Scholar]
- Sinkus R, Tanter M, Xydeas T, Catheline S, Bercoff J, Fink M. Viscoelastic shear properties of in vivo breast lesions measured by MR elastography. Magn Reson Imaging. 2005b;23:159–165. doi: 10.1016/j.mri.2004.11.060. [DOI] [PubMed] [Google Scholar]
- Steele DD, Chenevert TL, Skovoroda AR, Emelianov SY. Three-dimensional static displacement, stimulated echo NMR elasticity imaging. Physics in Medicine and Biology. 2000;45:1633–1648. doi: 10.1088/0031-9155/45/6/316. [DOI] [PubMed] [Google Scholar]
- Talwalkar JA, Yin M, Fidler JL, Sanderson SO, Kamath PS, Ehman RL. Magnetic resonance imaging of hepatic fibrosis: emerging clinical applications. Hepatology. 2008;47:332–342. doi: 10.1002/hep.21972. [DOI] [PubMed] [Google Scholar]
- Tse ZT, Janssen H, Hamed A, Ristic M, Young I, Lamperth M. Magnetic resonance elastography hardware design: a survey. Proc Inst Mech Eng H. 2009;223:497–514. doi: 10.1243/09544119JEIM529. [DOI] [PubMed] [Google Scholar]
- van Soest G, Mastik F, de Jong N, van der Steen AF. Robust intravascular optical coherence elastography by line correlations. Phys Med Biol. 2007;52:2445–2458. doi: 10.1088/0031-9155/52/9/008. [DOI] [PubMed] [Google Scholar]
- Venkatesh S, Yin M, Glockner J, Takahashi N, Grimm R, Manduca A, Ehman R. MR Elastography of Liver Tumors. Proceedings 16th Scientific Meeting, International Society for Magnetic Resonance in Medicine; Toronto. 2008a. p. 2781. [Google Scholar]
- Venkatesh SK, Yin M, Talwalkar JA, Ehman RL. Application of liver MR elastography in clinical practice. Proceedings of the International Society for Magnetic Resonance in Medicine; Toronto, Ontario, Canada. 2008b. p. 2611. [Google Scholar]
- Vlaardingerbroek MT, Den boer JA. Magnetic Resonance Imaging: Theory and Practice. Springer; 2003. [Google Scholar]
- Weaver JB, Doyley M, Cheung Y, Kennedy F, Madsen EL, Van Houten EEW, Paulsen K. Imaging the shear modulus of the heel fat pads. Clinical Biomechanics. 2005;20:312–319. doi: 10.1016/j.clinbiomech.2004.11.010. [DOI] [PubMed] [Google Scholar]
- Wilson LS, Robinson DE, Dadd MJ. Elastography - the movement begins. Physics in Medicine and Biology. 2000;45:1409–1421. doi: 10.1088/0031-9155/45/6/301. [DOI] [PubMed] [Google Scholar]
- Wu T, Felmlee JP, Greenleaf JF, Riederer SJ, Ehman RL. MR imaging of shear waves generated by focused ultrasound. Magnetic Resonance in Medicine. 2000;43:111–115. doi: 10.1002/(sici)1522-2594(200001)43:1<111::aid-mrm13>3.0.co;2-d. [DOI] [PubMed] [Google Scholar]
- Xu L, Lin Y, Xi ZN, Shen H, Gao PY. Magnetic resonance elastography of the human brain: a preliminary study. Acta Radiol. 2007;48:112–115. doi: 10.1080/02841850601026401. [DOI] [PubMed] [Google Scholar]
- Yamakoshi Y, Sato J, Sato T. Ultrasonic imaging of internal vibration of soft tissue under forced vibration. IEEE Transactions on Ultrasonics, Ferroelectrics, and Frequency Control. 1990;37:45–53. doi: 10.1109/58.46969. [DOI] [PubMed] [Google Scholar]
- Yin M, Talwalkar JA, Glaser KJ, Manduca A, Grimm RC, Rossman PJ, Fidler JL, Ehman RL. Assessment of hepatic fibrosis with magnetic resonance elastography. Clinical Gastroenterology and Hepatology. 2007;5:1207–1213. doi: 10.1016/j.cgh.2007.06.012. [DOI] [PMC free article] [PubMed] [Google Scholar]
- Zerhouni EA, Parish DM, Rogers WJ, Yang A, Shapiro EP. Human heart: tagging with MR imaging - a method for noninvasive assessment of myocardial motion. Radiology. 1988;169:59–63. doi: 10.1148/radiology.169.1.3420283. [DOI] [PubMed] [Google Scholar]


