Abstract
Many tomographic source localization algorithms used in biomagnetic imaging assume, explicitly or sometimes implicitly, that the source activity at different brain locations are either independent or that the correlation structure between sources is known. Among these algorithms is a class of adaptive spatial filters known as beamformers, which have superior spatiotemporal resolution abilities. The performance of beamformers is robust to weakly coherent sources. However, these algorithms are extremely sensitive to the presence of strongly coherent sources. A frequent mode of failure in beamformers occurs with reconstruction of auditory evoked fields (AEFs), in which bilateral auditory cortices are highly coherent in their activation. Here, we present a novel beamformer that suppresses activation from regions with interfering coherent sources. First, a volume containing the interfering sources is defined. The lead field matrix for this volume is computed and reduced into a few significant columns using singular value decomposition (SVD). A vector beamformer is then constructed by rejecting the contribution of sources in the suppression region while allowing for source reconstruction at other specified regions. Performance of this algorithm was first validated with simulated data. Subsequent tests of this modified beamformer were performed on bilateral AEF data. An unmodified vector beamformer using whole head coverage misplaces the source medially. After defining a suppression region containing the temporal cortex on one side, the described method consistently results in clear focal activations at expected regions of the contralateral superior temporal plane.
Index Terms: Beamformer, biomagnetism, functional neuroimaging, magnetoencephalography, MEG inverse problems, neuromagnetic signal processing
I. INTRODUCTION
Magnetoencephalography (MEG) is a functional neuroimaging technique with the ability to resolve brain dynamics on the order of milliseconds [1]. In contrast to other techniques, MEG provides a direct measure of the brain’s neuronal activity that is relatively undistorted by the various tissue layers of the head [2]. The potential for improved spatiotemporal reconstruction of neural activity has emerged with the advent of dense MEG sensor arrays with whole-head coverage.
Several source reconstruction algorithms, each employing a different set of assumptions, have been proposed to overcome the ill-posed inverse problem. Source reconstructions from MEG data can be classified as either parametric or tomographic. Parametric methods include equivalent current dipole (ECD) fitting techniques; they often require knowledge about the number of sources and their approximate locations, and poorly model sources with a large spatial extent. Tomographic methods reconstruct source activity at each voxel in the brain. It has been shown that a class of adaptive spatial filters known as beamformers [3] have the best spatial resolution and performance amongst existing tomographic methods [4]. Beamformers avoid the high number of parameters and nonlinear nature of ECD analysis. Beamformers can also be used to perform time-frequency analysis and study oscillatory power changes of neural sources, which are difficult to reconstruct using parametric methods [5]–[7].
However, the performance of beamformers degrades in the presence of highly correlated sources. For instance, the eigenspace beamformer is robust to moderate source correlations; however, sources that are strongly correlated (ρ > 0.9) are poorly resolved [8]. Whole-head coverage increases the likelihood of encountering such a situation since bilateral activations are often strongly coherent. For example, beamformer reconstructions of auditory evoked fields (AEFs) commonly exhibit this failure, attenuating the two true sources from each primary auditory cortex and often erroneously placing a single low-amplitude source centered between them.
A partial solution to this problem is to process left temporal sensors separately from right temporal sensors; this method was first employed to overcome difficulties encountered with ECD methods [9] and later applied to beamformers [10]. However, this method is not entirely satisfactory since it essentially discards most of the information gained from a whole-head sensor array; it also may not be sufficient for sources in closer proximity such as bilateral occipital activations evoked by visual stimuli or other more complex configurations.
We propose a modified beamformer method that circumvents these shortcomings by defining a region to ignore and augmenting the lead field matrix with this information. We demonstrate the efficacy of the proposed modified beamformer with simulations and real AEF data. Such a method improves upon the accuracy and resolution of beamforming.
Throughout this paper, plain italics indicate scalars, lowercase boldface italics indicate vectors, and uppercase boldface italics indicate matrices.
II. METHOD
A. Definitions and Problem Formulation
We shall define the magnetic field measured by the mth detector coil at time t as bm(t) and a column vector b(t) ≡ [b1(t), b2(t),…,bM (t)]T as a set of measured data, where M is the total number of detector coils, and the superscript T indicates the matrix transpose. The spatial location is represented by a three-dimensional vector r such that r = (x, y, z).
To express the moment magnitudes of the sources located at r at time t in the three orthogonal directions, we define s(r, t) ≡ [sx(r, t), sy(r, t), sz(r, t)]T.
To express the orientation of the qth source, we define the angles between its moment vector and the x, y, and z axes as respectively. The orientation of the qth source is defined as a vector . We assume in this paper that the orientation of each source is time independent.
The second-order moment matrix of the measurement is denoted Rb, i.e., Rb = 〈b(t)bT (t)〉, where 〈·〉 indicates the ensemble average. In practice, the ensemble average is often replaced with the time average over a certain time window. When 〈b(t)〉 = 0, Rb is also equal to the covariance matrix of the measurement.
The lead field vector for the μ component of a source at r is defined as . Here, expresses the mth sensor output induced by the unit-magnitude source that is located at r and oriented in the μ direction, where μ such that μ ∈ {x, y, z}. We define the lead field matrix as L(r) ≡ [lx(r), ly(r), lz(r)], representing the sensitivity of the sensor array at r in all three orthogonal directions. Modeling the head as a spherical volume conductor reduces the lead field to two orthogonal components in spherical coordinates, θ and ϕ [11]. In this case, the orientation of the qth source can instead be represented by a vector , resulting in L(r) = [lθ(r), lϕ(r)].
B. Conventional Adaptive Spatial Filtering
An adaptive spatial filter estimate of the source moment matrix ŝ(r, t) is given by
| (1) |
In (1), W(r) ≡ [wθ(r), wϕ(r)], and ŝ(r, t) ≡ [ŝθ(r, t), ŝϕ(r, t)]T, where wθ(r) and wϕ(r) are the weight vectors for the θ and ϕ directions, respectively, while ŝθ(r, t) and ŝϕ(r, t) are the corresponding components of the source moment vector.
This section reviews an eigenspace-projected linearly constrained minimum variance vector (LCMV) beamformer [12], [13]. Omitting r from the expression, the weight vectors wθ and wϕ are calculated with the following constraints:
| (2) |
| (3) |
The solution is known to be [13]
| (4) |
An eigenspace-projected minimum variance beamformer is obtained by projecting the weight matrix of the LCMV beamformer onto the signal subspace of the measurement covariance matrix
| (5) |
where ES contains the eigenvectors representing the signal subspace of Rb. This eigenspace projection overcomes the SNR degradation caused by array mismatch and smoothes time courses of source reconstruction [12].
C. Proposed Adaptive Beamformer With Coherent Suppression
1) A Method for Point Source Interference Suppression
The LCMV formulation allows one to add additional null constraints to suppress the influence of correlated sources. If the exact location of an interfering source is known to be at point ri, then the weight matrix can be reformulated
| (6) |
Similarly, for the orthogonal orientation ϕ
| (7) |
Therefore, the standard composite lead field matrix may be augmented with additional columns
| (8) |
resulting in a new weight matrix formulation
| (9) |
2) A Method for Region Suppression
However, the precise location of interference is seldom known a priori. Nevertheless, in many cases, an interfering source can safely be presumed to originate from somewhere within a larger brain region. For example, in auditory MEG experiments, interfering sources are typically present in superior temporal areas contralateral to the region of interest. It is, therefore, desirable to extend this formulation to suppress a selected region suspected to contain an interfering source.
In order to accomplish this, the lead field of the desired suppression region may be added to the null constraint of the weight matrix computation. As with a single point, the lead field matrix is augmented with the contribution from each voxel in the desired suppression region, Σ
| (10) |
where Σ is composed of the points {rΣ1, rΣ2,…, rΣN} and CΣ ≡ [lθ(rΣ1), lϕ(rΣ1),…,lθ(rΣN,lϕ(rΣN)]. Again, for orientation ϕ
| (11) |
Then, defining Lrs(r) ≡ [lθ(r), lϕ(r), CΣ], the weight matrix retains a familiar form
| (12) |
In practice, Σ will consist of several thousand voxels, making the product a highly singular matrix and, therefore, difficult to invert accurately. Furthermore, each additional column increases the computational load proportionately. To remedy these two problems, singular value decomposition (SVD) may be applied to CΣ; the most significant components can then be chosen to limit the number of additional columns and improve the condition number of this matrix. This has the added benefit of allowing the suppression region to be sampled at a different spatial resolution from the region of interest; a coarser suppression grid would be more computationally efficient without significantly compromising accuracy.
Let us define CS such that CS ≡ [c1,…,cP], the P left singular vectors of CΣ, and L̃rs(r) ≡ [lθ(r), lϕ(r), CS]. Then, building on the full eigenspace-projection beamformer, we construct an orthonormal basis ẼS by performing Gram-Schmidt orthogonalization on the composite matrix [ES, CS]. Finally, substituting ẼS for ES from (5), and L̃rs(r) for Lrs(r) from (12), we obtain
| (13) |
We use the first two columns of Wrs(r) as wθ(r) and wϕ(r). That is, defining p + 2-dimensional column vectors f1 and f2 such that
the weight vectors, wθ(r) and wϕ(r), are obtained using
| (14) |
The normalized lead field matrix L̃rs(r)/‖L̃rs(r)‖ may be used to prevent erroneous values near the local sphere origin [13], [14].
III. NUMERICAL EXPERIMENTS
A. Data Generation
A series of numerical experiments were conducted to test the effectiveness of the proposed method. The sensor configuration of the 275-channel CTF Omega 2000 biomagnetic measurement system (VSM MedTech, Coquitlam, BC, Canada) was used. Data were simulated and processed using a development version of NUTMEG [15].
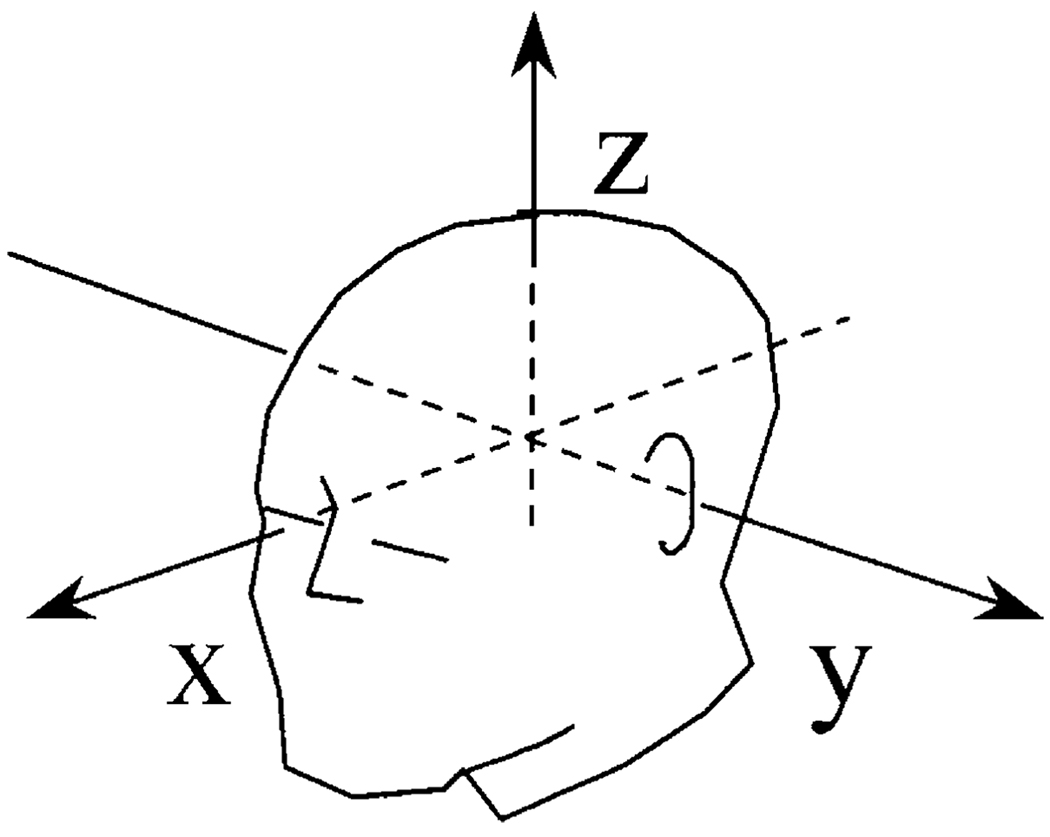
Two identical synchronous sine wave sources were synthesized and placed at (0, 30, 40) mm and (0, −30, 40) mm, with coordinates defined as in Fig. 1. A sensor lead field was calculated using a single-layer spherical volume conductor as the forward model [11] and the Omega 2000’s sensor geometry, with 2-mm grid spacing. Gaussian white noise was added to the generated data such that the signal-to-noise (SNR) was equal to 2. The SNR was defined as the ratio of the Frobenius norm of the MEG data matrix to that of the noise matrix.
Fig. 1.
The x, y, and z coordinates used to express the reconstruction results in Section IV. The midpoint between the left and right preauricular points was defined as the coordinate origin. The axis directed away from the origin to the left preauricular point was defined as the +y axis, and that from the origin to the nasion was the +x axis. The +z axis was defined as the axis perpendicular to both these axes and was directed from the origin toward the vertex.
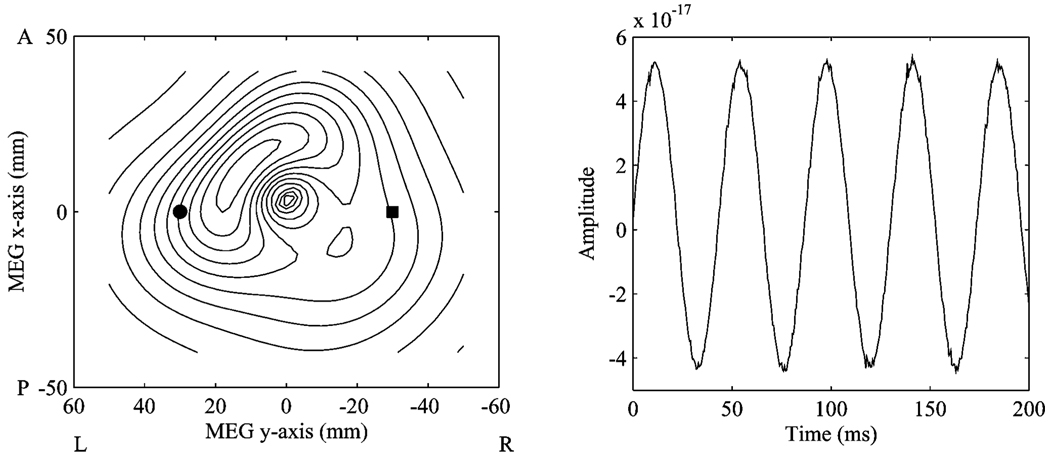
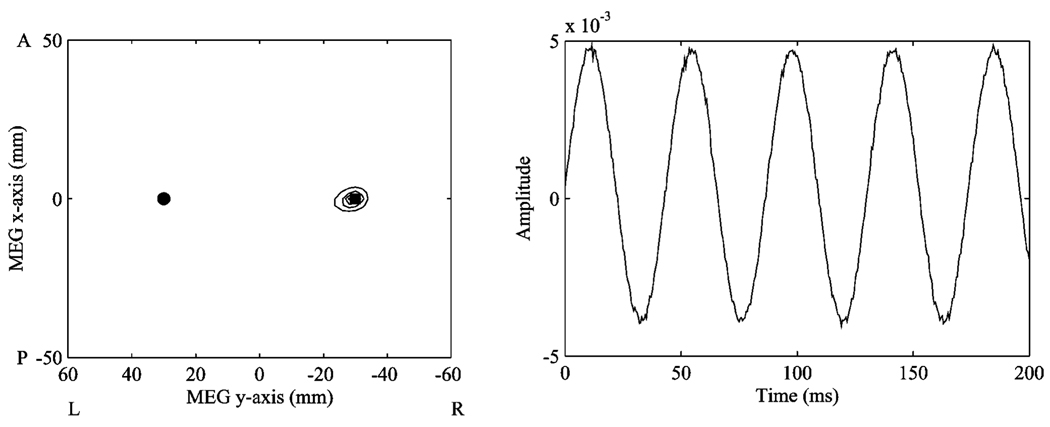
The conventional beamformer erroneously placed a diffuse “source” centered at (8.0, 6.0, 40.0) mm, shown in Fig. 2. Note also the corresponding time course does not show discernible distortion or other indications of an inaccurate reconstruction, and can be misleading in applications to real data. Applying point suppression to the coordinates of one source resulted in a highly focal and accurate reconstruction of the other source (Fig. 3).
Fig. 2.
Above left, the reconstruction profile on the z = 40 mm plane, using the conventional beamformer. The circle and square indicate the locations of the two simulated coherent sources. At right, the time series associated with the spatial peak at (8.0, 6.0, 40.0) mm.
Fig. 3.
Above left, the reconstruction profile on the z = 40 mm plane, using the beamformer with the point suppression modification and the same simulated data as in Fig. 2. The left source was suppressed, perfectly reconstructing the right source. At right, the time series reconstructed for the right source.
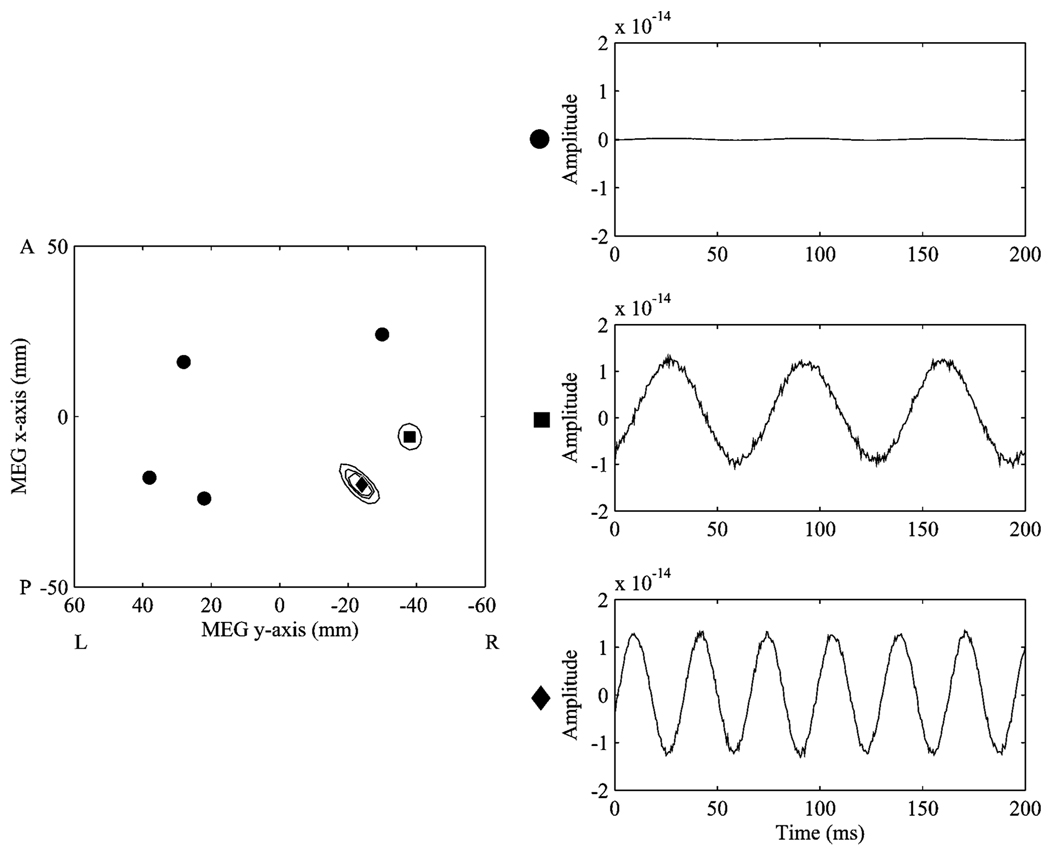
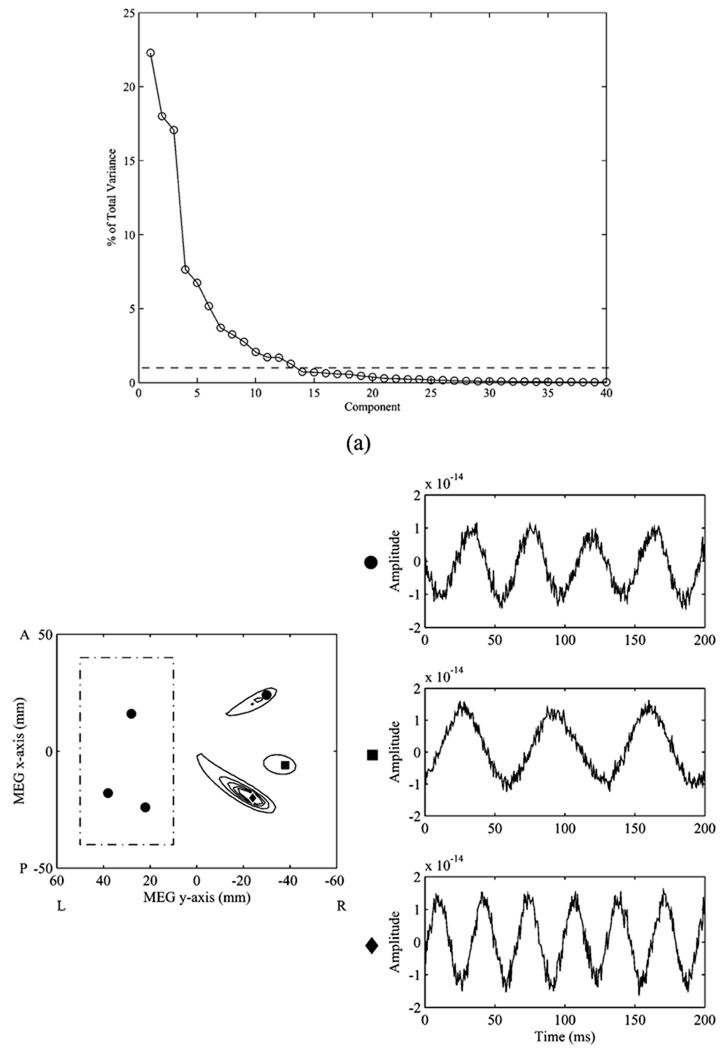
Next, we synthesized a total of six sine wave sources to test the region-based suppression technique. Four of these sources were synchronous, while the other two had different frequencies and phases. As expected, the conventional beamformer reconstructs the two unique sources, but fails to resolve any of the four correlated sources (Fig. 4). A suppression region was defined covering three of the four correlated sources, leaving three sources in the region of interest; the region was 80 × 40 × 20 mm. The eigenspectrum of this region’s lead field is shown in Fig. 5(a). Choosing eigenvectors that represent 95% of the variance is generally acceptable; however, often the precise eigenvalue thresholding is apparent by inspection. In this case, the first 13 eigenvectors, representing 93% of the variance, were chosen to augment the lead field of the reconstruction region as a null constraint. As shown in Fig. 5(b), all three sources of interest were resolved; the peak of the reconstructed correlated source had a localization error of 4.9 mm (approximately two voxels), while the other two were reconstructed perfectly with no localization error.
Fig. 4.
The reconstruction profile and time courses obtained from six simulated sources, four of which are coherent (indicated by circles) and two of which are uncorrelated (indicated by the square and the diamond). None of the four coherent sources are resolved.
Fig. 5.
(a) Eigenspectrum of the lead field of the suppression region. 13 eigenvalues, accounting for 93% of the total variance, were chosen by inspection. (b) The reconstruction profile and time courses obtained when defining the boxed area as the suppression region. The four circles indicate the coherent sources, while the sources indicated by the square and diamond are uncorrelated.
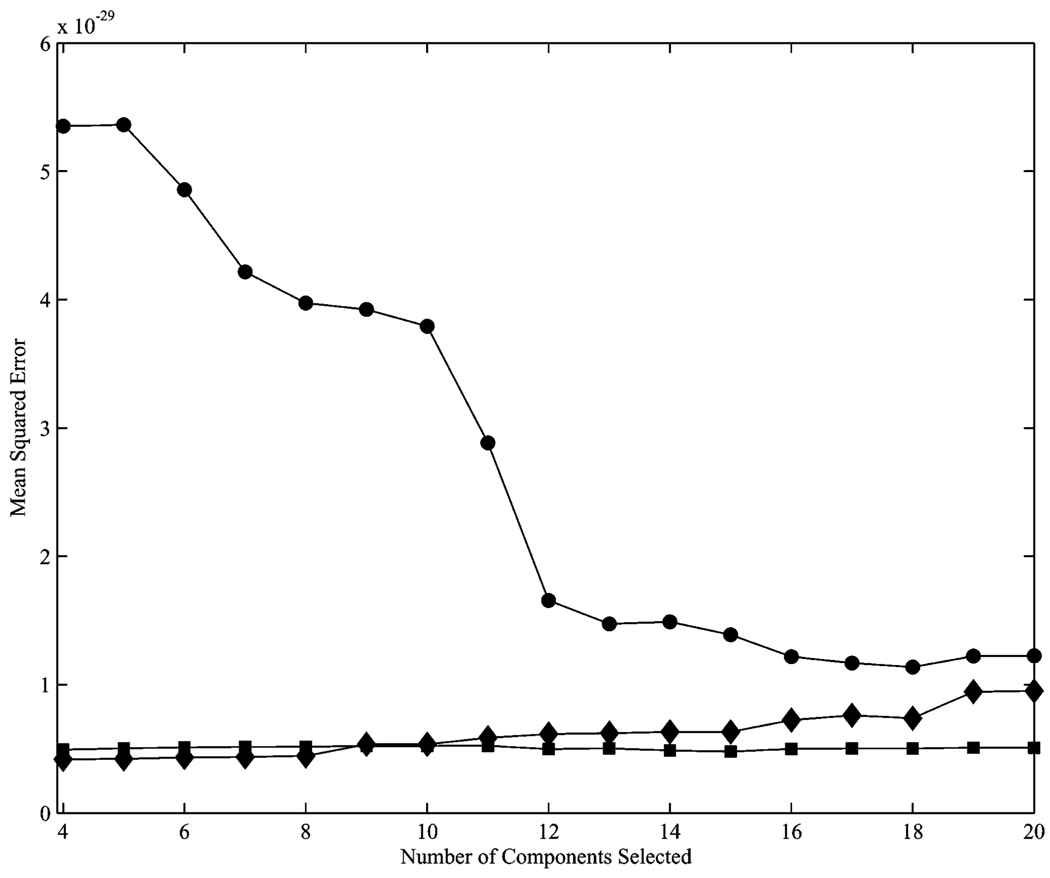
The size of the pseudosignal subspace represented by Ẽs is greater than the true signal subspace Es, hence a small increase in noise was observed in the reconstructed time series. To assess how noise is affected by the chosen eigenvectors, the mean square errors (MSE) of the time courses were calculated for several choices (see Fig. 6). As expected, the MSE of the time course for the correlated source reduced with more eigenvalues, leveling off at approximately 13. The error of one uncorrelated source increased slightly with more eigenvalues, while the other remained fairly constant.
Fig. 6.
Mean squared error of the time courses of the three sources as a function of eigenvector components selected for the lead field of the suppression region. The circles, diamonds, and squares correspond to the sources in Figs. 4 and 5.
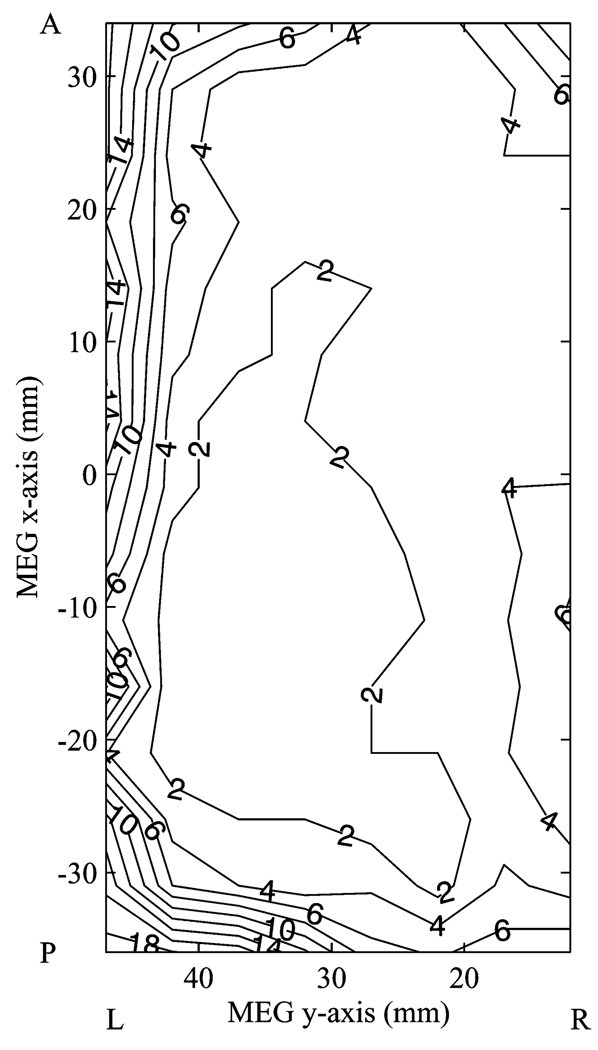
To assess how well an interfering source is suppressed depending on its position within the suppression region, we returned to the case of two synchronous sine wave sources. Using the left hemisphere suppression region defined above, one source was fixed at (0, −30,40) mm, while the algorithm was evaluated with the other source at each of 190 locations throughout the suppression region. Fig. 7 shows the localization error of the source of interest as a function of the interfering source within the suppression region. The mean error was 4.8 mm, with 73% of locations within the suppression region yielding reconstruction errors of 5 mm or less. Interfering sources placed within 5 mm of the edges farthest from the model sphere center produced the largest errors of up to 20 mm.
Fig. 7.
Contour map showing reconstruction error (mm) of right source as a function of position of left source within suppression region.
IV. APPLICATION TO AUDITORY-EVOKED MEG DATA
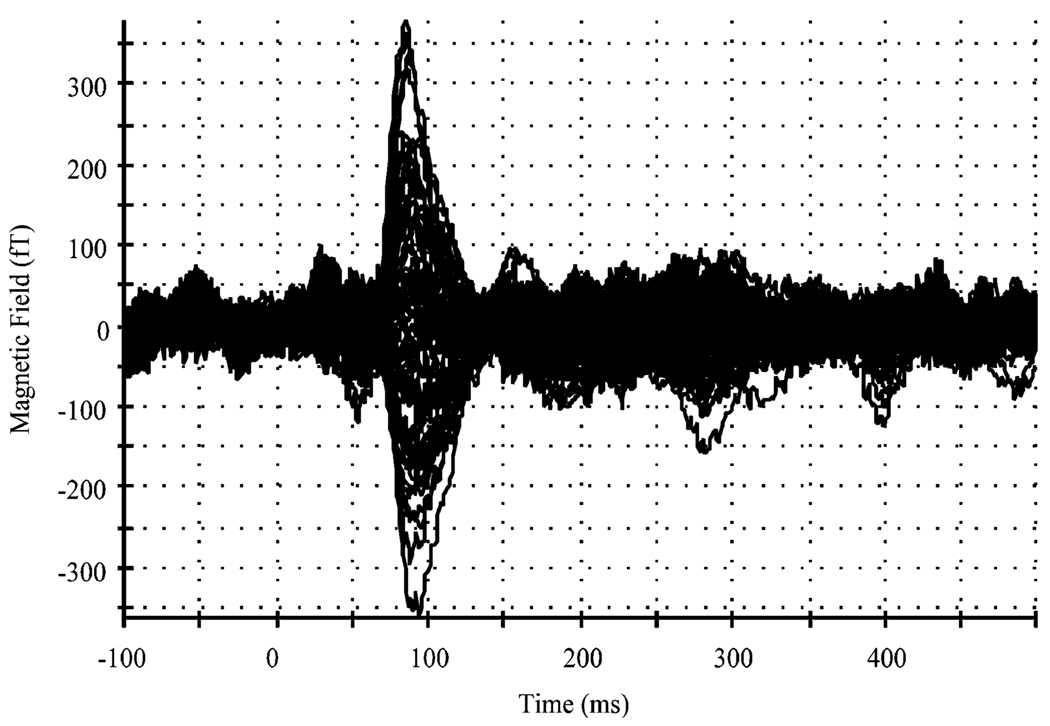
In order to apply our proposed technique to real data, auditory evoked field data was acquired from a 24-year-old female using pure tones. Data was acquired with a 275-channel whole-head MEG device from CTF Systems (VSM MedTech, Coquitlam, BC, Canada). The recordings were collected in accordance with the ethical standards of the UCSF Institutional Review Board and Helsinki Declaration of 1975, as revised in 1983. The auditory stimuli consisted of 1-kHz pure tones of 400 ms duration. The interstimulus interval was randomly varied between 1.5–1.6 s. The sampling frequency was set at 1200 Hz. All post-processing and analysis were performed using a development version of NUTMEG [15]. A digital filter was used to highpass the data at 1 Hz. After visual rejection of trials containing eye-blink and movement artifacts, a total of 112 trials were averaged (Fig. 8).
Fig. 8.
A bilateral AEF response to a 1-kHz pure tone, with data from sensors over the left and right temporal cortices overlaid.
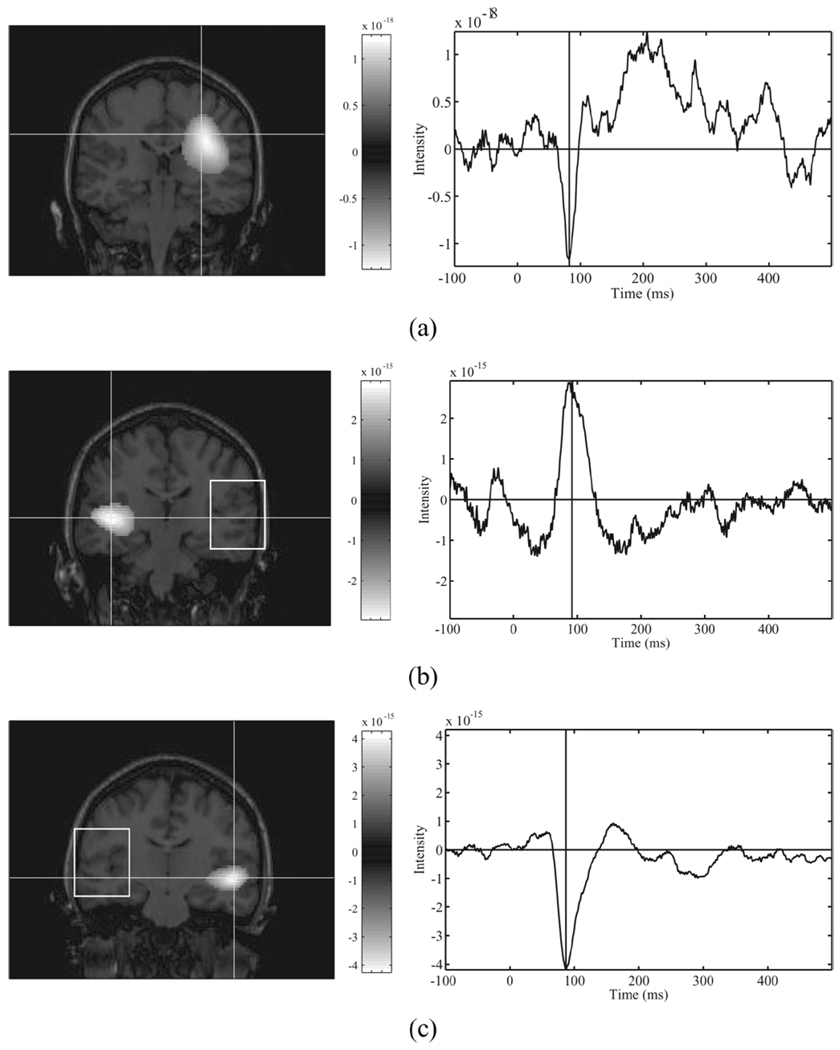
Source reconstruction using a standard eigenspace vector beamformer with the full 275-channel array shows a failure typical of simultaneous bilateral activation, placing a low-amplitude, diffuse source bleeding towards the center of the model sphere [Fig. 9(a)]. For this reconstruction, the signal subspace dimension Q was set to two because the eigenspectrum showed two dominant eigenvalues. Note that the reconstructed time series appears to be reasonable and does not show obvious symptoms of failure.
Fig. 9.
(a) Conventional beamformer reconstruction of AEF data, exhibiting failure due to correlated sources. The algorithm reconstructs a false source, placed in the frontal lobe, superior and anterior to the expected location on the superiotemporal plane. The spatial activation shown is at FWHM. The time course shown is for the spatial peak marked by the crosshairs. (b) Reconstruction of AEF data with suppression of the outlined region (left temporal cortex). Right auditory cortex is revealed, along with its time course. (c) Similarly, region suppression of right temporal cortex reveals left auditory cortex.
Applying the proposed technique, we used all 275 channels and defined the suppression region to be a broad volume (75 × 40 × 65 mm) containing right temporal areas. We then projected the lead field of the suppression region onto the 13 dominant eigenvectors and completed source reconstruction. As shown in Fig. 9(b), a plausible location for left primary auditory cortex on the superior temporal plane clearly emerges. Similarly, selecting a similar suppression region containing left temporal areas results in a peak at a plausible location for right primary auditory cortex [Fig. 9(c)]. Furthermore, no spurious activations near the center of the model sphere were observed. The correlation coefficient between the reconstructed time series for the two peaks was observed to be 0.90.
For comparison, the data were also fit to a spatiotemporal ECD model with DipoleFit (VSM MedTech, Coquitlam, BC, Canada). Using the same single-sphere head model as the beamformer analyses, two dipoles were fit simultaneously over the interval 75 ms to 100 ms, achieving a total weighted error of 9.8%. The left dipole localized 12.5 mm lateral and inferior to the left source reconstructed by the modified beamformer, while the right dipole localized 6.4 mm superior and slightly medial to the reconstructed right source. Both of these locations were within the full-width at half-maximum (FWHM) of each peak of the modified beamformer. The correlation coefficient between the two dipole moments was 0.93.
V. CONCLUSION
Adaptive beamformers have been shown to have zero bias and the highest spatial resolution amongst various spatial filtering methods used in neuromagnetic source reconstruction [16]. However, the accurate resolution of highly correlated sources has been problematic for beamformer techniques. One workaround has been to simply process different sensor groups independently, especially for auditory experiments. While such results may be satisfactory for some situations, this method likely will not be sufficient for correlated sources that are in the same hemisphere or otherwise closer together. Hence, highly correlated visual or somatosensory activity may not be accurately resolved by simply ignoring distant sensors.
The described method for suppressing regions of coherent activation is an important development for MEG inverse techniques. We have presented a modification that solves the problem of coherent sources when the approximate region of one source is known and disjoint from the other. This method essentially allows for a specific exception to the assumption of independent sources commonly made in beamformer reconstructions. Thus, simultaneous bilateral activations may now be accurately reconstructed using this technique without discarding any channels. It may also provide a solution in the case of highly correlated sources located in the same hemisphere or otherwise close to each other.
While the manual selection of the suppression region is a drawback of the method proposed here, the suppression region can be defined with the aid of a priori knowledge, potentially including information from functional magnetic resonance imaging studies. It may also be possible to automate the selection through a method that scans through several potential suppression regions.
ACKNOWLEDGMENT
The authors would like to thank A. M. Findlay and S. M. Honma for their assistance in acquiring MEG data, as well as J. M. Zumer and K. E. Hild for helpful discussions.
The work of S. S. Dalal was supported in part by the National Institutes of Health (NIH) under Grant F31 DC006762. The work of S. S. Nagarajan was supported in part by the NIH under Grant R01 DC004855-01A1.
Biographies
Sarang S. Dalal (S’99) was born in Hayward, CA, in 1978. He received the B.S. degree in biomedical engineering, with a concentration in electrical engineering and a minor in psychology, from the Johns Hopkins University, Baltimore, MD, in 2000. He is currently working towards the Ph.D. degree in bioengineering, based jointly at the University of California, San Francisco (UCSF) and the University of California, Berkeley.
His research interests include neuromagnetic source reconstruction, time-frequency analyses, cortical connectivity, and auditory/language processing.
Mr. Dalal is a member of the IEEE Engineering in Medicine and Biology Society. He received the Young Investigator Award from the International Conference on Biomagnetism (2004) and the Ruth L. Kirschstein National Research Service Award from the National Institute on Deafness and Other Communication Disorders (NIDCD).
Kensuke Sekihara (M’88–SM’06) received the M.S. and Ph.D. degrees from Tokyo Institute of Technology, Tokyo, Japan, in 1976 and 1987, respectively.
From 1976 to 2000, he worked with the Central Research Laboratory, Hitachi, Ltd., Tokyo. He was a Visiting Research Scientist at Stanford University, California, Stanford, from 1985 to 1986, and at Basic Development, Siemens Medical Engineering, Erlangen, Germany, from 1991 to 1992. From 1996 to 2000, he worked with the “Mind Articulation” research project sponsored by the Japan Science and Technology Corporation. He is currently a Professor at the Department of Systems Design & Engineering, Tokyo Metropolitan University, Tokyo. His research interests include neuromagnetic source reconstruction and statistical signal processing, especially its application to functional neuroimaging.
Dr. Sekihara is a member of the IEEE Engineering in Medicine and Biology Society and the IEEE Signal Processing Society.

Srikantan S. Nagarajan (S’90–M’91) received the M.S. and Ph.D. degrees in biomedical engineering from Case Western Reserve University (CWRU), Cleveland, OH.
He began his research career at the Applied Neural Control Laboratory, CWRU. After graduate school, he did a postdoctoral fellowship at the Keck Center for Integrative Neuroscience at the University of California, San Francisco, under the mentorship of Dr. M. Merzenich and Dr. C. Schreiner. Subsequently, he was a tenure-track faculty member in the Department of Bioengineering at the University of Utah, Salt Lake City. Currently, he is the Director of the Biomagnetic Imaging Laboratory, an Associate Professor in Residence in the Department of Radiology, and a member of the UCSF/Berkeley Joint Graduate Group in Bioengineering. His research interests are in the area of neural engineering, where his goal is to better understand dynamics of brain networks involved in the processing and learning of complex human behaviors, such as speech, through the development of functional brain imaging technologies.
Contributor Information
Sarang S. Dalal, The UCSF/Berkeley Joint Graduate Group in Bioengineering and the Department of Radiology, University of California, San Francisco, CA 94143-0628 USA (sarang@hurricane.ucsf.edu).
Kensuke Sekihara, The Department of Systems Design and Engineering, Tokyo Metropolitan University, Tokyo 191-0065, Japan (ksekiha@cc.tmit.ac.jp).
Srikantan S. Nagarajan, The UCSF/Berkeley Joint Graduate Group in Bioengineering and the Department of Radiology, University of California, San Francisco, CA 94143-0628 USA (sri@radiology.ucsf.edu).
REFERENCES
- 1.Hämäläinen M, Hari R, IImoniemi RJ, Knuutila J, Lounasmaa OV. Magnetoencephalography-theory, instrumentation, and applications to noninvasive studies of the working human brain. Rev. Mod. Phys. 1993;vol. 65:413–497. [Google Scholar]
- 2.Hämäläinen M, Sarvas J. Realistic conductivity geometry model of the human head for interpretation of neuromagnetic data. IEEE Trans. Biomed. Eng. 1989 Feb;vol. 36(no. 2):165–171. doi: 10.1109/10.16463. [DOI] [PubMed] [Google Scholar]
- 3.van Veen BD, Buckley KM. Beamforming: a versatile approach to spatial filtering. IEEE Acoust. Speech Signal Process. Mag. 1988 Apr;vol. 5:4–24. [Google Scholar]
- 4.Darvas F, Pantazis D, Kucukaltun-Yildirim E, Leahy RM. Mapping human brain function with MEG and EEG: methods and validation. NeuroImage. 2004;vol. 23(no.) Suppl. 1:S289–S299. doi: 10.1016/j.neuroimage.2004.07.014. [DOI] [PubMed] [Google Scholar]
- 5.Ishii R, Shinosaki K, Ukai S, Inouye T, Ishihara T, Yoshimine T, Hirabuki N, Asada H, Kihara T, Robinson SE, Takeda M. Medial prefrontal cortex generates frontal midline theta rhythm. Neuroreport. 1999;vol. 10:675–679. doi: 10.1097/00001756-199903170-00003. [DOI] [PubMed] [Google Scholar]
- 6.Taniguchi M, Kato A, Fujita N, Hirata M, Tanaka H, Kihara T, Ninomiya H, Hirabuki N, Nakamura H, Robinson SE, Cheyne D, Yoshimine T. Movement-related desynchronization of the cerebral cortex studied with spatially filtered magnetoencephalography. NeuroImage. 2000;vol. 12:298–306. doi: 10.1006/nimg.2000.0611. [DOI] [PubMed] [Google Scholar]
- 7.Dalal SS, Edwards E, Kirsch HE, Soltani M, Canolty RT, Barbaro NM, Knight RT, Nagarajan SS. Spatiotemporal dynamics of cortical networks preceding finger movement and speech production. presented at the 16th Meeting of the International Society for Brain Electromagnetic Topography; Bern, Switzerland. 2005. Oct, [Google Scholar]
- 8.Sekihara K, Nagarajan SS, Poeppel D, Marantz A. Performance of an MEG adaptive-beamformer technique in the presence of correlated neural activities: effects on signal intensity and time-course estimates. IEEE Trans. Biomed. Eng. 2002 Dec;vol. 49(no. 12):1534–1546. doi: 10.1109/tbme.2002.805485. [DOI] [PubMed] [Google Scholar]
- 9.Pekkonen E, Huotilainen M, Virtanen J, Sinkkonen J, Rinne T, Ilmoniemi RJ, Näätänen R. Age-related functional differences between auditory cortices: a whole-head MEG study. Neuroreport. 1995;vol. 6:1803–1806. doi: 10.1097/00001756-199509000-00023. [DOI] [PubMed] [Google Scholar]
- 10.Herdman AT, Wollbrink A, Chau W, Ishii R, Ross B, Pantev C. Determination of activation areas in the human auditory cortex by means of synthetic aperture magnetometry. NeuroImage. 2003;vol. 20:995–991. doi: 10.1016/S1053-8119(03)00403-8. 005. [DOI] [PubMed] [Google Scholar]
- 11.Sarvas J. Basic mathematical and electromagnetic concepts of the biomagnetic inverse problem. Phys. Med. Biol. 1987;vol. 32:11–22. doi: 10.1088/0031-9155/32/1/004. [DOI] [PubMed] [Google Scholar]
- 12.Sekihara K, Nagarajan SS, Poeppel D, Marantz A, Miyashita Y. Reconstructing spatio-temporal activities of neural sources using an MEG vector beamformer technique. IEEE Trans. Biomed. Eng. 2001 Jul;vol. 48(no. 7):760–771. doi: 10.1109/10.930901. [DOI] [PubMed] [Google Scholar]
- 13.Van Veen BD, van Drongelen W, Yuchtman M, Suzuki A. Localization of brain electrical activity via linearly constrained minimum variance spatial filtering. IEEE Trans. Biomed. Eng. 1997 Sep;vol. 44(no. 9):867–880. doi: 10.1109/10.623056. [DOI] [PubMed] [Google Scholar]
- 14.Gross J, Ioannides AA. Linear transformations of data space in MEG. Phys. Med. Biol. 1999;vol. 44:2081–2097. doi: 10.1088/0031-9155/44/8/317. [DOI] [PubMed] [Google Scholar]
- 15.Dalal SS, Zumer JM, Agrawal V, Hild KE, Sekihara K, Nagarajan SS. NUTMEG: a neuromagnetic source reconstruction toolbox. Neurol. Clin. Neurophysiol. 2004:52. [PMC free article] [PubMed] [Google Scholar]
- 16.Sekihara K, Sahani M, Nagarajan SS. Localization bias and spatial resolution of adaptive and non-adaptive spatial filters for MEG source reconstruction. NeuroImage. 2005;vol. 25:1056–1067. doi: 10.1016/j.neuroimage.2004.11.051. [DOI] [PMC free article] [PubMed] [Google Scholar]


