Abstract
The objective of this study was to quantify the electrode-tissue interface impedance of electrodes used for deep brain stimulation (DBS). We measured the impedance of DBS electrodes using electrochemical impedance spectroscopy in vitro in carbonate and phosphate buffered saline solution and in vivo following acute implantation in the brain. The components of the impedance, including the series resistance (Rs), the Faradaic resistance (Rf) and the double layer capacitance (Cdl), were estimated using an equivalent electrical circuit. Both Rf and Cdl decreased as the sinusoidal frequency was increased, but the ratio of capacitive charge transfer to Faradaic charge transfer was relatively insensitive to the change of frequency. Rf decreased and Cdl increased as the current density was increased, and above a critical current density the interface impedance became nonlinear. Thus the magnitude of the interface impedance was strongly dependent on the intensity (pulse amplitude and duration) of stimulation. The temporal dependence and spatial non-uniformity of Rf and Cdl suggested that a distributed network, with each element of the network having dynamics tailored to a specific stimulus waveform, is required to describe adequately the impedance of the DBS electrode-tissue interface. Voltage transients to biphasic square current pulses were measured and suggested that the electrode-tissue interface did not operate in a linear range at clinically-relevant current amplitudes, and that the assumption of the DBS electrode being ideally polarizable was not valid under clinical stimulating conditions.
1. Introduction
Deep brain stimulation (DBS) for treatment of neurological disorders is delivered from a four-contact electrode array implanted in the thalamus or basal ganglia. The efficacy of DBS is dependent on localizing charge delivery to specific populations of neurons, and charge delivery is influenced by the electrode-tissue interface, where a transduction of charge carriers occurs from electrons in the metal electrode to ions in the tissue. Characterizing the impedance of the DBS electrode-tissue interface is required to determine the charge delivery to the brain. For example, the interface capacitance modified the volume of neural activation by deep brain stimulation (Butson and McIntyre 2005). Further, the interface impedance contributes to the distribution of current density on the electrode, which may influence neural excitation, tissue damage, and electrode corrosion during DBS. The purpose of this study was to quantify the impedance of the electrode-electrolyte interface of deep brain stimulation electrodes both in vitro and in vivo.
The impedance of deep brain stimulation electrodes was characterized using electrochemical impedance spectroscopy (EIS) in vitro in carbonate and phosphate buffered saline solution and in vivo following acute implantation in the brain. From the impedance spectrum, it is possible to deduce an equivalent electrical circuit model and match the circuit components to the physical characteristic of the interface. In a simple case, the interface can be modeled by a Randles circuit (Randles 1947), composed of a double-layer capacitor in parallel with the series combination of a charge-transfer resistance (Faradaic resistance) and a Warburg impedance (figure 1(a)). The Warburg impedance, which accounts for mass transfer limitations by diffusion, is negligible at high frequencies when the time scale is so short that diffusion does not influence reactions at the interface, or if the concentrations of reactants are high. It was determined experimentally that, under the frequencies and concentration used in this study, the Warburg impedance was negligible, and the equivalent model was reduced to the parallel combination of the double layer capacitance Cdl and the Faradaic resistance Rf (figure 1(b)). Our results indicate that the double layer capacitance and Faradaic resistance both decreased as the sinusoidal frequency was increased, and the double layer capacitance increased and Faradaic resistance decreased as the current density was increased.
Figure 1.
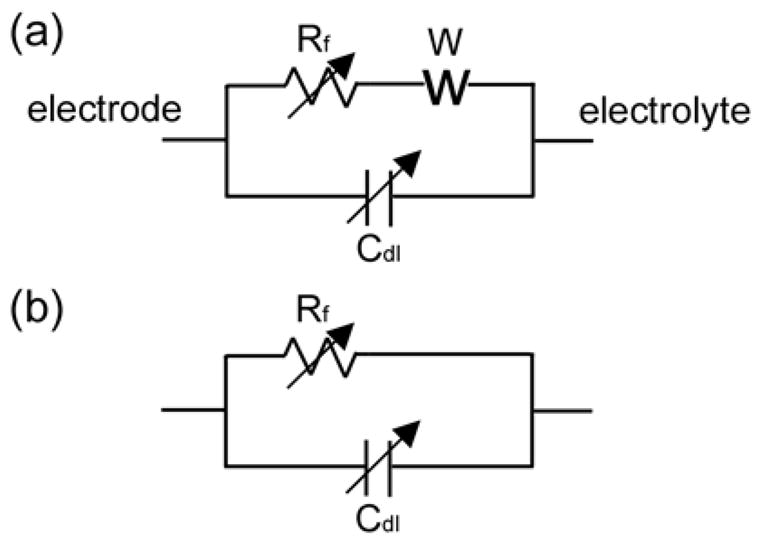
(a) The Randles equivalent circuit representation of the electrode-electrolyte interface. It is comprised of the double layer capacitance Cdl in parallel with the series combination of a charge transfer Faradaic resistance Rf and the Warburg impedance W. (b) The simplified equivalent circuit model of the electrode-electrolyte interface, which is valid when the Warburg impedance is negligible.
2. Methods
The impedance properties of clinical DBS electrodes (Model 3387, Medtronic Inc., Minnesota, USA) were measured in vivo following acute implantation in the cat brain and in vitro in a near-physiological saline electrolyte buffered with carbonate and phosphate at concentrations found in interstitial fluid (137 mM NaCl, 29 mM NaHCO3, 1.7 mM Na2HPO4, and 0.7 mM NaH2PO4) infused with a mixture of gas (5% CO2, 6% O2, and 89% N2) to maintain a pH of 7.4 (Cogan et al 2004). The clinical DBS electrode (Model 3387) includes a linear array of 4 cylindrical electrode contacts (1.5 mm length, 1.27 mm diameter, 5.98 mm2 surface area) separated by insulating rings (1.5 mm length). Impedance was measured with sinusoidal currents at 41 frequencies evenly distributed on a log scale between 1 Hz and 10 kHz, and at five root-mean-square amplitudes of 0.01 mA, 0.02 mA, 0.05 mA, 0.1 mA and 0.2 mA. As well, the voltage transients generated by applying symmetrical biphasic square currents (200 μs per phase and 1 ms per phase) were measured at 9 amplitudes from 0.01 mA to 5 mA. The measurements were replicated three times at each amplitude level for each of the four electrode contacts.
2.1. In vitro measurements
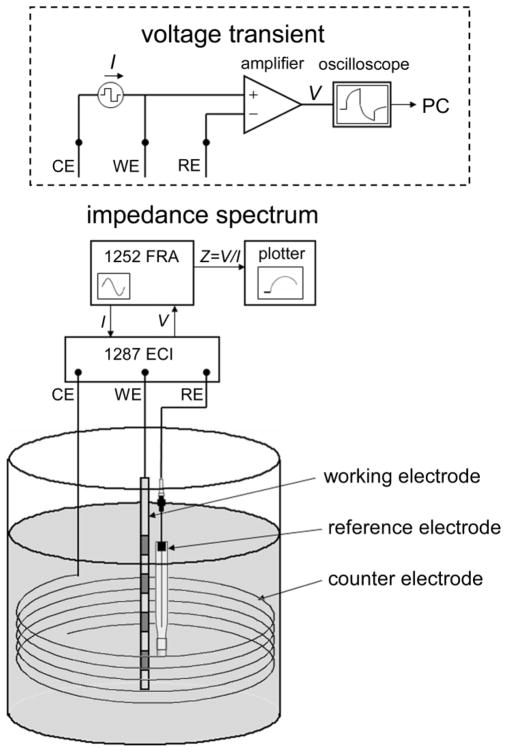
The three-electrode technique was used to measure impedance in vitro with an impedance analyzer (Model 1287 Electrochemical Interface (ECI) + Model 1252 Frequency Response Analyzer (FRA), Solatron Analytical, Hampshire, England) (figure 2). The electrode was placed vertically in the middle of a 200 ml beaker of buffered saline solution at room temperature (T ≈ 20 °C). Sinusoidal currents were applied between one contact of the DBS electrode (working electrode) and a counter electrode formed of stainless steel wire spiraling around the wall of the beaker. The resulting potential between the working electrode and a silver/silver chloride reference electrode (Model RE-5B, BAS Inc., West Lafayette, IN) was measured with the 1287 ECI (input impedance 10 G Ω in parallel with 50 pF). The impedance was calculated by dividing the measured potential by the applied current and included the electrode-electrolyte interface impedance in addition to the series resistance, Rs. The series resistance included the solution (in vitro) or tissue (in vivo) resistance between the working electrode and the reference electrode, plus the electrical resistance of the lead wire, which was 40±1 Ω (n=4). The series resistance was minimized by positioning the reference electrode within 5 mm of the working electrode.
Figure 2.
Experimental setup used to measure the impedance of DBS electrode and voltage transients generated by square currents. Abbreviations used in figure: CE - counter electrode, WE - working electrode, RE - reference electrode, ECI - Electrochemical Interface, FRA - Frequency Response Analyzer.
The same 3-electrode cell was also used to measure voltage transients generated by symmetrical biphasic square currents delivered between the working electrode and the counter electrode. Voltage transients were measured between the DBS electrode and the reference electrode with an isolated differential amplifier (input impedance 100 MΩ in parallel with 25 pF, frequency response ±0.5 dB to 1 MHz, Model SR560, Stanford Research Systems, Sunnyvale, CA), captured via a GPIB-equipped oscilloscope at a sampling rate of 1 MHz, and transferred to computer for storage and analysis (figure 2, inside dashed box).
2.2. In vivo measurements
Acute experiments were conducted in 3 adult male cats using the same instrumentation and methods used for the in vitro measurements. All animal care and experimental procedures were approved by the Institutional Animal Care and Use Committee of Duke University. Anesthesia was induced with ketamine HCl (Ketaset, 35 mg/kg, IM, supplemented as required during surgical preparation) and maintained with alpha-chloralose (65 mg/kg IV, supplemented at 15 mg/kg). Anesthesia level was determined by monitoring blood pressure, heart rate, and withdrawal and blink reflexes. Body temperature was maintained between 37° and 39° C with a water-circulating heating pad, and warm 0.9% saline with 8.4 mg/cc sodium bicarbonate and 5% dextrose added was administered intravenously (~15 cc/kg/hr). The head was held in an upright position using a stereotaxic frame. A 1–2 cm diameter craniotomy was made on the top of the skull and the dura was reflected to expose the underlying cortex. The DBS lead was inserted vertically into the neocortex, with the distal contact ~2 cm and the proximal contact ~1 cm beneath the brain surface. The stylet inside the lead, which ensured that the lead was stiff enough to penetrate the tissue, was then removed so that the lead could move with the brain tissue. The cortex was covered with surgical gauze soaked with physiological saline, and the reference electrode was positioned atop the gauze within 5 mm of the DBS lead. Thus, the distance from the active contact to the reference electrode varied from ~11–21 mm. The large-area stainless steel surgical retractor was used as the counter electrode. Impedance spectrograms and voltage transients were measured in vivo using the 3-electrode technique at the same amplitudes, frequencies, and repetitions as the in vitro measurements, except biphasic current pulse amplitudes were limited to ≤ 2 mA, as larger currents evoked strong motor responses.
2.3. Impedance characterization
2.3.1. Impedance characterization with sinusoidal currents
The measured impedance data were used to estimate the element values of a three-element equivalent circuit model including the parallel combination of Rf and Cdl in series with Rs:
where ω is the angular frequency, Z′ is the real part of impedance and Z′ is the imaginary part of impedance. Since charge transfer through the electrode-electrolyte interface was shunted by the double layer capacitance at very high frequency, series resistance Rs was determined as the asymptotic, high frequency impedance
The series resistance Rs was subtracted from the real part of impedance, and Rf and Cdl at each frequency were determined as
2.3.2. Impedance characterization with biphasic pulsed currents
In the voltage transient study, the element values of the three-element equivalent circuit model were determined by minimizing the sum of the squares of the residuals of the measured points minus the theoretical values. The theoretical voltage response to the biphasic square current pulses was described with the equations:
where I is the amplitude of the applied current, and PW is the pulse width of the current pulse. The voltage transient at t > 2 PW represents the discharge of double layer after the applied current returned to zero.
3. Results
We measured the impedance of deep brain stimulation electrodes with both sinusoidal and square currents in vitro in buffered saline solution and in vivo following acute implantation in the brain. Rf and Cdl were quantified as functions of current density and frequency from the impedance spectra, and as a function of current density from the voltage transients.
3.1. Impedance characteristics
3.1.1. Impedance Spectra
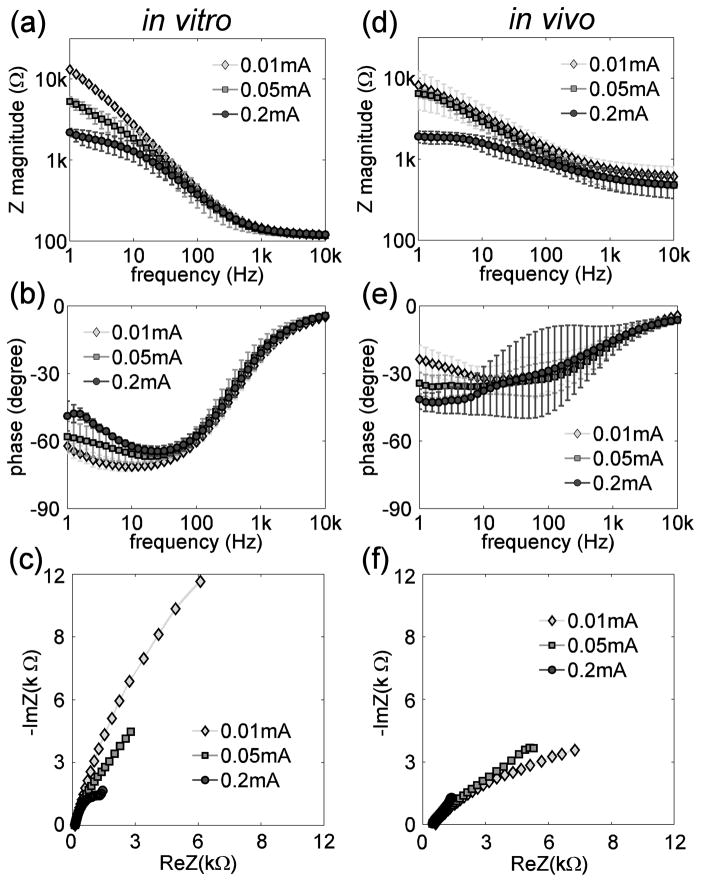
Impedance (amplitude and phase) spectra and impedance Nyquist plots measured in vitro and in vivo for a single DBS electrode contact at 3 current amplitudes are shown in figure 3. The measured impedance is composed of the electrode-electrolyte interface impedance, which dominates at low frequencies, and the series resistance, which dominates at high frequencies (Ragheb et al 1992). The asymptotic, high-frequency impedance resulting from the series resistance Rs was 119 ± 7 Ω (mean ± SD, range=107–141 Ω, n=60 (4 contacts×5 amplitudes×3 repetitions)) in vitro and 473 ± 159 Ω (mean ± SD, range=260–928 Ω, n=180 (4 contacts×5 amplitudes×3 repetitions×3 cats)) in vivo (figure 3(a), (d)). The phase of the impedance approached zero at high frequencies indicating the high-frequency impedance was mainly resistive (figure 3(b), (e)). The value of Rs can also be read from the Nyquist plots where the impedance loci intersect the abscissa (figure 3(c), (f)). The difference between Rs in vitro and Rs in vivo resulted from both the difference in the conductivities of the surrounding medium and the difference in the proximity of the reference electrode to the DBS contacts. The electrode-electrolyte interface impedance varied inversely with frequency – in the kΩ range at 1 Hz decreasing to almost zero at 10 kHz. At low frequencies (<100 Hz), the interface impedance also varied inversely with the current amplitude, both in vitro (figure 3(a)) and in vivo (figure 3(d)).
Figure 3.
(a)(d) Impedance magnitude spectra of the DBS electrode in vitro (a) and in vivo (d) measured at 41 frequencies evenly distributed on a log scale from 1 Hz to 10 kHz with sinusoidal currents at root-mean-square amplitudes of 0.01 mA, 0.05 mA and 0.2 mA. (b)(e) Impedance phase spectra of the DBS electrode in vitro (b) and in vivo (e) at amplitudes of 0.01 mA, 0.05 mA and 0.2 mA. (c)(f) Nyquist plots of the real and imaginary parts of the DBS electrode impedance in vitro (c) and in vivo (f) at amplitudes of 0.01 mA, 0.05 mA and 0.2 mA.
3.1.2. Changes of Rf and Cdl with frequency
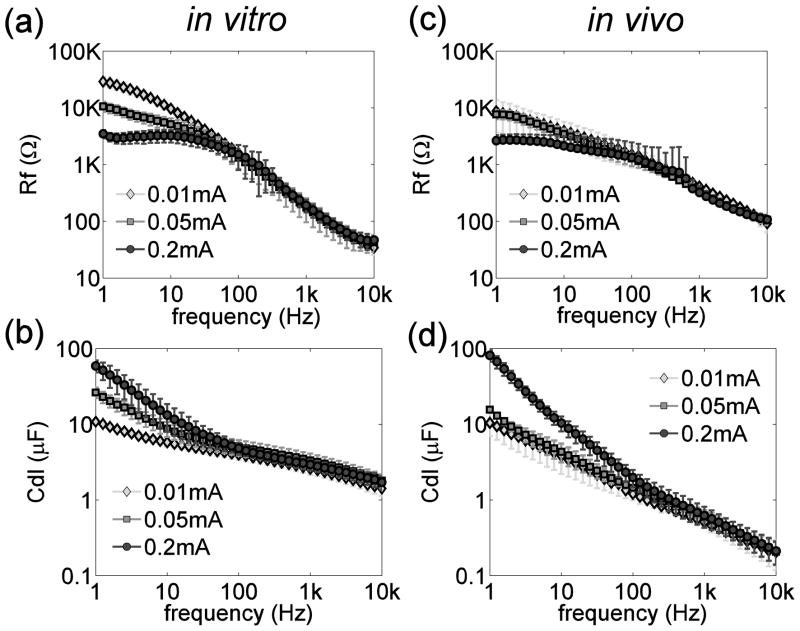
The Faradaic resistance Rf and double layer capacitance Cdl calculated from the impedance spectra in vitro and in vivo are shown in figure 4. Both Rf and Cdl decreased monotonically with increasing frequency from 1 to 10 kHz both in vitro and in vivo. Rf and Cdl were strongly dependent on the current amplitude at low frequencies (<100 Hz), but not at high frequencies (>100 Hz).
Figure 4.
(a)(c) Faradaic resistance (Rf) as a function of frequency in vitro (a) and in vivo (c). (b)(d) Double layer capacitance (Cdl) as a function of frequency in vitro (a) and in vivo (c). Note that only the upper error bars were plotted at 0.2 mA in (c) because the lower error bar at some frequencies extended beyond the lower range of the log scale.
3.1.3. Changes of Rf and Cdl with current density
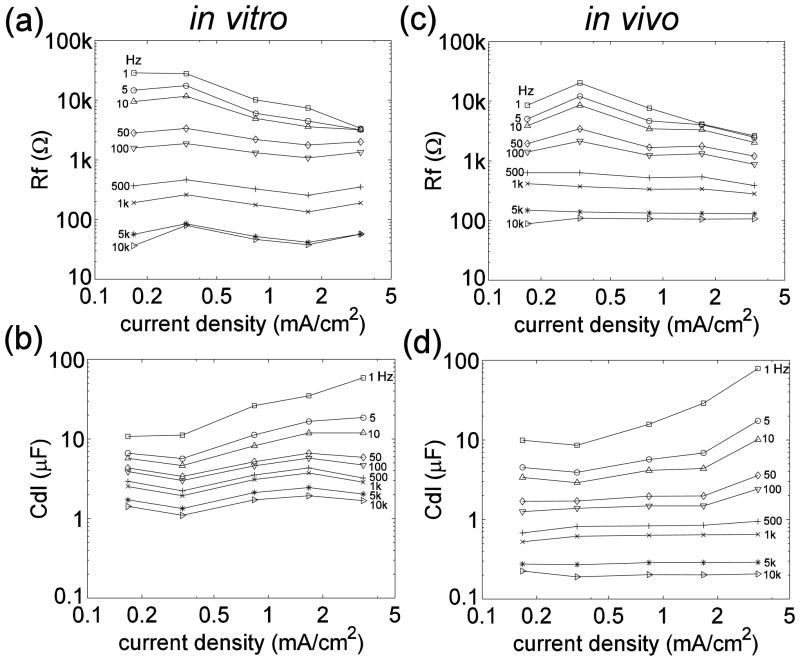
Rf and Cdl were dependent on the current density, as well as the frequency (Dymond 1976, Geddes 1997, Onaral and Schwan 1982, Ragheb and Geddes 1990). To illustrate this dependency, Rf and Cdl were plotted versus average current density (r.m.s. current divided by electrode surface area) at different frequencies (figure 5). In the low frequency range, Rf decreased and Cdl increased when the current density increased above a certain value. Previous studies identified the ‘current density linearity limit’ as the current density at which the values of R or C deviated by 10 percent from those observed at low current densities (Geddes 1997, Onaral and Schwan 1982, Ragheb and Geddes 1990). At low frequencies (< 100 Hz) Rf and Cdl also exhibited a current density linearity limit, which was approximately 0.334 mA/cm2, corresponding to a stimulus current of 0.02 mA, but this linearity limit was not evident at frequencies > 100 Hz.
Figure 5.
(a)(c) Faradaic resistance, Rf, as a function of current density at different frequencies in vitro (a) and in vivo (c). (b)(d) Double layer capacitance, Cdl, as a function of current density at different frequencies in vitro (b) and in vivo (d). Values are means across 12 trials (4 contacts×3 repetitions) in vitro and 36 trials (4 contacts×3 repetitions×3 cats) in vivo.
3.2. Voltage transients in response to biphasic current pulses
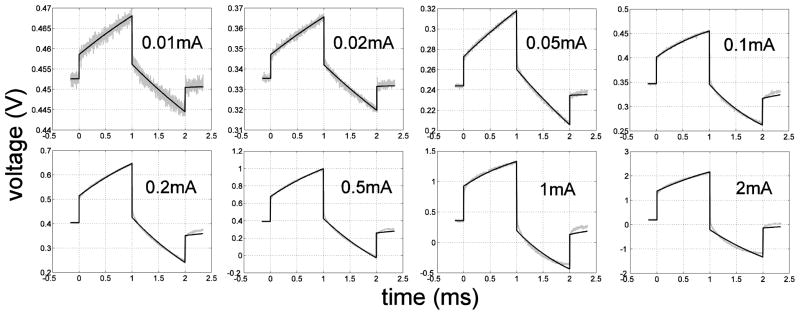
Examples of the voltage responses to symmetrical biphasic square current pulses with different amplitudes and the corresponding least-square regression fits to the data are shown in figure 6. The fits matched the measured data well at low current amplitudes, while stronger deviations between the fits and measurements appeared at higher current amplitudes. Increasing deviation at higher currents indicated that the electrode-electrolyte interface no longer operated in linear range at high currents, and therefore could not be fit as well with a linear circuit. Gas bubbles formed on the surface of the DBS electrode during the in vitro measurements at current amplitudes above 1 mA, indicating the occurrence of water hydrolysis.
Figure 6.
In vivo voltage responses (grey) to symmetrical biphasic square currents (1 ms per phase) at different amplitudes between 0.01 mA and 2 mA, and the least-square curve fits (black) to the voltage responses. The correlation coefficients (r2) are 0.990, 0.994, 0.996, 0.996, 0.996, 0.996, 0.994 and 0.994 respectively from 0.01 mA to 2 mA. Open circuit potential was 0.34 ± 0.14 V (n=36, 4 contacts×9 amplitudes) in vitro and 0.38 ± 0.23 V (n=96, 4 contacts×8 amplitudes×3 cats) in vivo.
The average values of Rs, Rf and Cdl estimated from the voltage transient data are shown in figure 7 as a function of current amplitude. The values of Rs were consistent across current amplitudes both in vitro (mean ± SD=133 ± 7 Ω, range=123–150 Ω, n=36) and in vivo (mean ± SD=533 ± 152 Ω, range=335–920 Ω, n=96) and were comparable to the Rs values calculated from the impedance spectra. The values of Rf and Cdl were constant at low currents but deviated from these values when the current amplitude increased. These changes, however, cannot be readily compared with the changes of Rf and Cdl with current calculated from impedance spectra (figure 5) because fitting the voltage transients with a linear model assumed that Rf and Cdl did not change during the time course of the current pulse. This is not a valid assumption because the data from the impedance spectra demonstrated that Rf and Cdl changed with frequency (figure 4).
Figure 7.
Values of the three elements of the equivalent electrical circuit estimated from the voltage responses to biphasic current pulses in vitro and in vivo. (a) Series resistance, Rs, as a function of current amplitude of the square pulses. (b) Faradaic resistance, Rf, as a function of current amplitude of the square pulses. (c) Double layer capacitance, Cdl, as a function of current amplitude of the square pulses.
4. Discussion
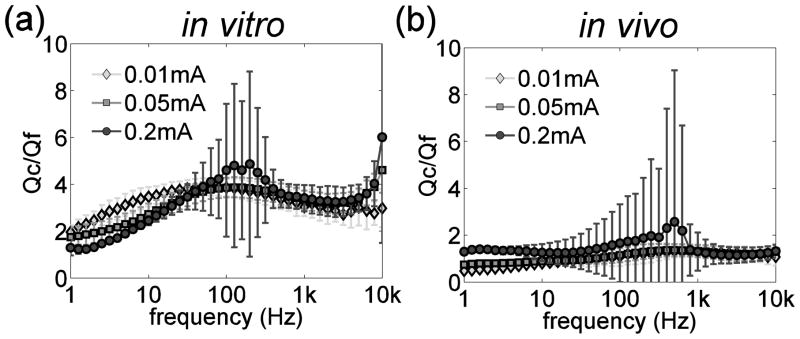
The goal of this study was to quantify the impedance of deep brain stimulation electrodes in vitro and in vivo. Characterizing the electrode impedance enables differentiation of the charge injection pathways through the electrode-electrolyte interface. Charge transfer at the electrode-electrolyte interface can be in the form of capacitive (non-Faradaic) charge transfer, Qc, or resistive (Faradaic) charge transfer, Qf. The ratio of the two forms of charge transfer Qc/Qf, is an index for evaluating the propensity for stimulation to cause electrode or tissue damage. The charge transfer ratio Qc/Qf (figure 8) was calculated from the data in figure 4 as:
Figure 8.
The ratio of capacitive charge transfer to Faradaic charge transfer as a function of frequency in vitro and in vivo.
If Rf and Cdl were independent of frequency, then Qc/Qf would increase in proportion to the frequency, and stimulation waveforms with strong high-frequency components (such as short pulse widths) could make the electrode highly polarizable by transferring charge mainly in capacitive form. Our results indicate that Rf and Cdl both decreased monotonically with increasing frequency (figure 4), and, as a result, the ratio of capacitive charge transfer to Faradaic charge transfer was relatively insensitive to the frequency (figure 8). Qc/Qf was ~2–3 times larger in vitro than in vivo, suggesting that the non-Faradaic (capacitive) charge capacity of DBS electrodes was overestimated by the in vitro measurements, presumably due to differences in chemical composition between the in vitro and in vivo environments (Onaral and Schwan 1982). Further, quantification of Rf and Cdl in vivo may have been influenced by the larger and more variable series resistance.
The interface impedance influences the distribution of current density on the electrode surface. The edge effect describes that the current density increases toward the perimeter of the electrode (Newman 1966), and is an important factor that affects the patterns of neural excitation (McIntyre and Grill 2001, Wei and Grill 2005) and tissue damage (McCreery et al 1990). Our results demonstrate that Rf decreased and Cdl increased with increasing current density (figure 5), and this resulted in a decrease of the magnitude of the interface impedance with increasing current density (figure 3(a), (d)). This suggests that the non-uniform distribution of current density will result in a non-uniform interface impedance with the interface impedance decreasing toward the perimeter of the electrode. Further, the decrease of Rf and the increase of Cdl with increasing current density occurred when the r.m.s. current was above 0.02 mA (section 3.1.2). Typical DBS parameters of 2 V, 90 μs pulse width, and 165 Hz (Kuncel and Grill 2004) yielded peak current of 1.76 mA and r.m.s. current of 0.23 mA measured with the 3-electrode technique in the brain, much higher than the identified current linearity limit of 0.02 mA, and indicating that the DBS electrode-tissue interface may operate in a nonlinear fashion during effective DBS therapy.
A number of mechanisms may underlie the dependence of interface resistance and capacitance on frequency and current density. The monotonic decrease of Faradaic resistance with increasing frequency may reflect that at high frequencies the voltage polarity across the electrode changes so rapidly that the electrochemical reactants for the reactions to be reversed are more readily available adjacent to the electrode surface (i.e., there is insufficient time for diffusion). The decrease of Faradiac resistance with increasing current density, seen when electrode entered the nonlinear region, is due to the initiation of new reaction mechanisms at the electrode surface, capable of accommodating the increased current beyond the limits of the available reacting species. The frequency dependence of double layer capacitance was suggested to be a result of the relaxation of absorbed water dipoles, which act as a dielectric in the double layer capacitance (Bockris and Conway 1958). The increase of double layer capacitance with increasing current density, seen when electrode entered the nonlinear region, is possibly due to the increased fraction of the electrode surface covered by adsorbed chemical species such as halide anions and polar molecules such as water, with a preferential orientation at the interface acting to separate charge (Conway 1965, Dymond 1976).
4.1. Equivalent electrical circuit models of the interface impedance
We modeled the interface impedance with the parallel combination of a resistor and capacitor, and this representation has also been used by other investigators (Gileadi et al 1975, Robinson 1968, Yoo and Park 2000). However, the interface impedance may also be modeled by the series combination of a resistor and capacitor (Onaral and Schwan 1982, Ragheb and Geddes 1990, Ragheb et al 1992, Schwan 1968), and the dependence of interface resistance and capacitance on frequency and current density are well documented using this series representation. Both the series resistance and capacitance decreased with increasing frequency for a platinum electrode in 0.9% saline over the frequency range of 0.001–1000 Hz (Onaral and Schwan 1982), and at 100 Hz the series resistance decreased and the series capacitance increased with increasing current density (Schwan 1968). Similarly, for a large number of metals the series resistance decreased and the series capacitance increased with increasing current density, but these changes were not pronounced at low current densities (Ragheb and Geddes 1990). Schwan first defined a ‘limit current of linearity’ as the current at which the values of series resistance and capacitance deviated by 10% from the values observed at low current density (Schwan 1968).
Our results, modeling the interface with the parallel combination of a resistor and a capacitor, revealed changes in the parallel resistance and capacitance with frequency and current density similar to those of the series resistance and capacitance. The changes of parallel components Rf and Cdl with frequency and current density have not been previous reported. Under Warburg’s assumption of constant phase angle, the parallel and series circuits are equivalent, and the conversion from one circuit to the other is a simple scale factor (see Appendix). Hence, the parallel components Rf and Cdl follow the same trends with the change of frequency and current density as the series components, with exceptions at very low frequencies where Warburg’s assumption breaks down (see Appendix).
4.2. Limitations of experiments
We measured the impedance of deep brain stimulation electrodes by applying sinusoidal currents in vitro in buffered saline solution and in vivo following acute implantation in the brain. Rf and Cdl were determined as a function of both current density and frequency by fitting an electrical circuit equivalent model to the impedance spectrograms. One limitation of this approach is that the current density was spatially averaged over the geometric area of the electrode when quantifying the changes of Rf and Cdl with current density. However, current density varies over the surface of an electrode, and to obtain a relationship between Rf and Cdl and the absolute current density requires an electrode with uniformly current density on the electrode surface (Ksienski 1992, Rubinstein et al 1987, Wiley and Webster 1982). Second, spatially-lumped circuit elements were used to describe spatially-distributed interface parameters. However, the lumped circuit model allowed parameterization of the interface impedance using a limited number of circuit elements that have clear physical representations. Third, this study quantified the electrode-tissue interface impedance of clinical DBS electrodes in vivo in the cat brain while the DBS electrodes were designed for human brains. The smaller size of the cat brain did not permit precise positioning of the electrode in a specific region of the brain. Further, the acute nature of the in vivo experiment did not allow investigation of the post-operative changes in impedance that may accompany the chronic foreign body reaction to the electrode (Grill and Mortimer 1994, Williams et al 2007).
4.3. Implications for modeling of deep brain stimulation electrodes
The quantitative description of DBS electrode-electrolyte interface impedance from experimental measurement has not been previously documented. Holsheimer et al. measured the impedance of DBS electrode in vitro in physiological saline with monophasic rectangular voltage pulses (Holsheimer et al 2000). The “impedance” they measured was the instantaneous impedance calculated by dividing the amplitude of the rectangular voltage by the instantaneous current. This does not allow characterization of the charge-transfer processes at the interface through the Faradaic resistance or the double layer capacitance. Using the data from Holsheimer et al., Butson and McIntyre assumed that the DBS electrode was ideally polarizable and included only a capacitance to represent the interface impedance (Butson and McIntyre 2005). A highly polarizable (real) electrode can accommodate a large amount of charge on the double layer prior to initiating Faradaic reactions, and thus is highly desirable for stimulation. However, it is necessary to determine whether such a model is representative of the DBS electrode under clinical stimulating conditions.
Considering the series resistance present in the 3-electrode measurement scheme, the equivalent circuit of an ideally polarizable electrode is a capacitor in series with the series resistance. At constant current, the potential across the ideally polarizable electrode changes linearly with time according to
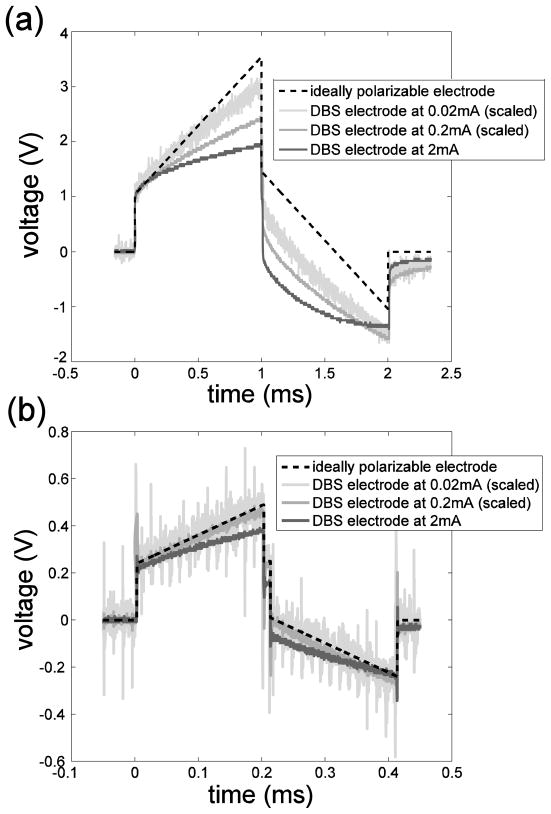
if C does not change over time. The voltage responses to 0.02 mA, 0.2 mA and 2 mA biphasic current pulses were scaled and plotted in figure 9, along with the voltage waveform for an ideally polarizable electrode in series with Rs. The capacitance of the ideally polarizable electrode was chosen to match the initial slope (at t=0+) of the voltage waveforms of the DBS electrode because current was purely capacitive upon pulsing and the instantaneous capacitance at t=0+ is proportional to the inverse of the initial slope. These values, 0.8 μF in vivo and 1.6 μF in vitro, are also similar to the values obtained by fitting the in vivo and in vitro measurements at low currents (figure 7(c)). The voltage response of the real electrode deviated from that of the ideally polarizable electrode and the deviation increased as the amplitude and duration of the current increased (figure 9), indicating that a larger fraction of charge was transferred through Faradaic reactions. Further, for the ideally polarizable electrode, the electrode potential returned to the open circuit potential after the charge-balanced biphasic pulse because the charge in the first phase was fully recovered during the second phase. For the real electrode, not all of the charge injected during the first (anodic) phase went into charging of the double layer, and only some fraction of the charge in the second (cathodic) phase was required to discharge the double layer. The “extra” cathodic charge resulted in a post-pulse electrode potential negative of the pre-pulse value (figure 9), and the opposite was observed for cathodic-first biphasic pulses. Thus, the DBS electrode is not ideally polarizable under clinical stimulating conditions.
Figure 9.
Voltage responses to biphasic current pulses at various amplitudes. (a) In vivo voltage responses to symmetrical biphasic square current with 1 ms pulse width at amplitudes of 0.02 mA, 0.2 mA and 2 mA (from Figure 6) and the voltage response of an ideally polarizable electrode (0.8 μF) in series with tissue resistance (520 Ω) to square current at 2 mA. (b) In vitro voltage responses to symmetrical biphasic square current with 200 μs pulse width at amplitudes of 0.02 mA, 0.2 mA and 2 mA and the voltage response of an ideally polarizable electrode (1.6 μF) in series with tissue resistance (120Ω ) to square current at 2 mA. The waveform in response to 0.02 mA current was scaled by a factor of 100 and the waveform in response to 0.2 mA current was scaled by a factor of 10 for them to be comparable to the waveform in response to 2 mA current.
Charge per phase and charge density per phase are cofactors in determining stimulation-induced tissue damage (McCreery et al 1990, McCreery et al 1988). The charge per phase limit 1.8 μC and geometrical charge density limit 30 μC/cm2 for DBS electrode (Kuncel and Grill 2004) were extracted from previous studies on charge, charge density and tissue damage (Agnew et al 1983, Brown et al 1977, McCreery et al 1990, McCreery et al 1988, Pudenz et al 1975, Yuen et al 1981). In our transient pulse study, the charge per phase ranged from 0.002 μC (for the 0.01 mA, 0.2 ms pulse) to 2 μC (for the 2 mA, 1 ms pulse), which covered the identified charge limit of 1.8 μC. The voltage transients suggest a pronounced deviation from a linear model at charge per phase over 1 μC and gas bubble formation was observed above 1 μC. This indicates that the charge per phase limit of 1.8 μC extracted from previous studies may not be conservative enough and irreversible Faradic reactions may be initiated below this limit. The appearance of the voltage transients suggests that the gas bubbling was a result of hydrogen evolution in the cathodic phase of the pulse, because the voltage deviated more prominently at high current amplitudes in the cathodic phase than in the anodic phase and the potential excursion exceeded the potential (−0.22 V vs. Ag-AgCl (Robblee and Rose 1990)) that initiates the reduction of water (Figure 6).
The results of this study provide parameters required to include accurate representations of the electrode-tissue interface in computational models of DBS. However, the nonlinear dependence of both Rf and Cdl on frequency and current density poses a challenge to incorporate readily the interface impedance into models. Because the current density distribution on the electrode is spatially non-uniform, with higher current density at the edges than in the center of the electrode (Newman 1966), Rf and Cdl will vary spatially along the electrode-tissue interface. Further, because the frequency content of the stimulation pulse changes over the time course of the pulse, Rf and Cdl also vary temporally during the stimulation. Therefore, the interface impedance is best described by a distributed rather than a lumped parameter network, with each parameter of the network having dynamics tailored to the stimulus waveform.
In summary, this study utilized electrochemical impedance spectroscopy and transient pulse responses to characterize deep brain stimulation electrodes in vitro in carbonate and phosphate buffered saline and in vivo following acute implantation in the brain. The electrode-tissue interface impedance operated in a nonlinear regime with clinically-relevant current amplitudes, and the nonlinearity complicates incorporation of the interface impedance into models of DBS. The assumption of the DBS electrode being ideally polarizable is not valid under clinical stimulating conditions, indicating the occurrence of Faradaic charge transfer through the electrode-tissue interface. It awaits further investigation to identify the electrochemical reactions contributing to the Faradaic charge transfer.
Acknowledgments
This work was supported by National Institutes of Health Grant R01 NS040894. The authors thank Ms. Gilda Mills for her excellent technical assistance in the animal experiments.
Appendix
The impedance of the parallel combination of Rf and Cdl is
For the series combination of a resistor Rw and capacitor Cw, the impedance is
Both models are intended to represent the same physical system and thus Zp (ω) = Zs (ω). This equality yields:
Warburg stated that at low current densities both Rw and Cw vary as the square root of frequency, (Onaral and Schwan 1982, Ragheb and Geddes 1990). The consequence of this relationship is that the phase angle, which equals to tan−1(ωRwCw) is constant at 45° at all frequencies. For the special case ωRwCw =1, the above relations become:
This indicates that parallel and series circuits become equivalent under Warburg’s assumption, and the conversion from one circuit to the other is a simple factor of 2. However, the series representation of interface does not allow the passage of direct current; and as ω approaches zero, the condition ωRwCw =1 breaks down. Thus, the parallel model is more appropriate at low frequencies than the series model.
References
- Agnew WF, Yuen TGH, McCreery DB. Morphologic changes after prolonged electrical stimulation of the cat’s cortex at defined charge densities. Exp Neurol. 1983;79:397–411. doi: 10.1016/0014-4886(83)90221-2. [DOI] [PubMed] [Google Scholar]
- Bockris JO, Conway BE. Determination of the faradaic impedance at solid electrodes and the electrodeposition of copper. J Chem Phys. 1958;28:707–16. [Google Scholar]
- Brown WJ, Babb TL, Soper HV, Lieb JP, Ottino CA, Crandall PH. Tissue reactions to long-term electrical stimulation of the cerebellum in monkeys. J Neurosurg. 1977;47:366–79. doi: 10.3171/jns.1977.47.3.0366. [DOI] [PubMed] [Google Scholar]
- Butson CR, McIntyre CC. Tissue and electrode capacitance reduce neural activation volumes during deep brain stimulation. Clin Neurophysiol. 2005;116:2490–500. doi: 10.1016/j.clinph.2005.06.023. [DOI] [PMC free article] [PubMed] [Google Scholar]
- Cogan SF, Guzelian AA, Agnew WF, Yuen TG, McCreery DB. Over-pulsing degrades activated iridium oxide films used for intracortical neural stimulation. J Neurosci Methods. 2004;137:141–50. doi: 10.1016/j.jneumeth.2004.02.019. [DOI] [PubMed] [Google Scholar]
- Conway BE. Theory and principles of electrode processes. New York: Ronald Press; 1965. [Google Scholar]
- Dymond AM. Characteristics of the metal-tissue interface of stimulation electrodes. IEEE Trans Biomed Eng. 1976;23:274–80. doi: 10.1109/tbme.1976.324585. [DOI] [PubMed] [Google Scholar]
- Geddes LA. Historical evolution of circuit models for the electrode-electrolyte interface. Ann Biomed Eng. 1997;25:1–14. doi: 10.1007/BF02738534. [DOI] [PubMed] [Google Scholar]
- Gileadi E, Kirowa-Eisner E, Penciner J. Interfacial electrochemistry: an experimental approach. Reading, MA: Addison-Wesley; 1975. [Google Scholar]
- Grill WM, Mortimer JT. Electrical properties of implant encapsulation tissue. Ann Biomed Eng. 1994;22:23–33. doi: 10.1007/BF02368219. [DOI] [PubMed] [Google Scholar]
- Holsheimer J, Dijkstra EA, Demeulemeester H, Nuttin B. Chronaxie calculated from current-duration and voltage-duration data. J Neurosci Methods. 2000;97:45–50. doi: 10.1016/s0165-0270(00)00163-1. [DOI] [PubMed] [Google Scholar]
- Ksienski DA. A minimum profile uniform current density electrode. IEEE Trans Biomed Eng. 1992;39:682–92. doi: 10.1109/10.142643. [DOI] [PubMed] [Google Scholar]
- Kuncel AM, Grill WM. Selection of stimulus parameters for deep brain stimulation. Clin Neurophysiol. 2004;115:2431–41. doi: 10.1016/j.clinph.2004.05.031. [DOI] [PubMed] [Google Scholar]
- McCreery DB, Agnew WF, Yuen TG, Bullara L. Charge density and charge per phase as cofactors in neural injury induced by electrical stimulation. IEEE Trans Biomed Eng. 1990;37:996–1001. doi: 10.1109/10.102812. [DOI] [PubMed] [Google Scholar]
- McCreery DB, Agnew WF, Yuen TG, Bullara LA. Comparison of neural damage induced by electrical stimulation with faradaic and capacitor electrodes. Ann Biomed Eng. 1988;16:463–81. doi: 10.1007/BF02368010. [DOI] [PubMed] [Google Scholar]
- McIntyre CC, Grill WM. Finite element analysis of the current-density and electric field generated by metal microelectrodes. Ann Biomed Eng. 2001;29:227–35. doi: 10.1114/1.1352640. [DOI] [PubMed] [Google Scholar]
- Newman J. Current distribution on a rotating disk below limiting current. J Electrochem Soc. 1966;113:1235–41. [Google Scholar]
- Onaral B, Schwan HP. Linear and nonlinear properties of platinum electrode polarisation. Part 1: frequency dependence at very low frequencies. Med Biol Eng Comput. 1982;20:299–306. doi: 10.1007/BF02442796. [DOI] [PubMed] [Google Scholar]
- Pudenz RH, Bullara LA, Dru D, Talalla A. Electrical stimulation of the brain. II. Effects on the blood-brain barrier. Surg Neurol. 1975;4:265–70. [PubMed] [Google Scholar]
- Ragheb T, Geddes LA. Electrical properties of metallic electrodes. Med Biol Eng Comput. 1990;28:182–6. doi: 10.1007/BF02441775. [DOI] [PubMed] [Google Scholar]
- Ragheb T, Riegle S, Geddes LA, Amin V. The impedance of a spherical monopolar electrode. Ann Biomed Eng. 1992;20:617–27. doi: 10.1007/BF02368609. [DOI] [PubMed] [Google Scholar]
- Randles JEB. Kinetics of rapid electrode reactions. Discuss Faraday Soc. 1947;1:11–9. [Google Scholar]
- Robblee LS, Rose TL. Electrochemical guidelines for selection of protocols and electrode materials for neural stimulation. In: Agnew WF, McCreery DB, editors. Neural Prostheses: Fundamental Studies. Englewood Cliffs, NJ: Prentice Hall; 1990. [Google Scholar]
- Robinson DA. The electrical properties of metal microelectrodes. P IEEE. 1968;56:1065–71. [Google Scholar]
- Rubinstein JT, Spelman FA, Soma M, Suesserman MF. Current density profiles of surface mounted and recessed electrodes for neural prostheses. IEEE Trans Biomed Eng. 1987;34:864–75. doi: 10.1109/tbme.1987.326007. [DOI] [PubMed] [Google Scholar]
- Schwan HP. Electrode polarization impedance and measurements in biological materials. Ann N Y Acad Sci. 1968;148:191–209. doi: 10.1111/j.1749-6632.1968.tb20349.x. [DOI] [PubMed] [Google Scholar]
- Wei XF, Grill WM. Current density distributions, field distributions and impedance analysis of segmented deep brain stimulation electrodes. J Neural Eng. 2005;2:139–47. doi: 10.1088/1741-2560/2/4/010. [DOI] [PubMed] [Google Scholar]
- Wiley JD, Webster JG. Analysis and control of the current distribution under circular dispersive electrodes. IEEE Trans Biomed Eng. 1982;29:381–5. doi: 10.1109/TBME.1982.324910. [DOI] [PubMed] [Google Scholar]
- Williams JC, Hippensteel JA, Dilgen J, Shain W, Kipke DR. Complex impedance spectroscopy for monitoring tissue responses to inserted neural implants. J Neural Eng. 2007;4:410–23. doi: 10.1088/1741-2560/4/4/007. [DOI] [PubMed] [Google Scholar]
- Yoo JS, Park SM. An electrochemical impedance measurement technique employing Fourier transform. Anal Chem. 2000;72:2035–41. doi: 10.1021/ac9907540. [DOI] [PubMed] [Google Scholar]
- Yuen TG, Agnew WF, Bullara LA, Jacques S, McCreery DB. Histological evaluation of neural damage from electrical stimulation: considerations for the selection of parameters for clinical application. Neurosurgery. 1981;9:292–9. [PubMed] [Google Scholar]


