

Abstract
The activity of neurons in the anterolateral cell group of the bed nucleus of the stria terminalis (BNSTALG) plays a critical role in anxiety- and stress-related behaviors. Histochemical studies have suggested that multiple distinct neuronal phenotypes exist in the BNSTALG. Consistent with this observation, the physiological properties of BNSTALG neurons are also heterogeneous, and three distinct cell types can be defined (Type I–III) based primarily on their expression of four key membrane currents, namely Ih, IA, IT, and IK(IR). Significantly, all four channels are multimeric proteins and can comprise of more than one pore-forming α subunit. Hence, differential expression of α subunits may further diversify the neuronal population. However, nothing is known about the relative expression of these ion channel α subunits in BNSTALG neurons.
We have addressed this lacuna by combining whole cell patch clamp recording together with single cell reverse transcriptase polymerase chain reaction (scRT-PCR) to assess the mRNA transcript expression for each of the subunits for the four key ion channels in Type I-III neurons of the BNSTALG. Here, cytosolic mRNA from single neurons was probed for the expression of transcripts for each of the α subunits of Ih (HCN1- HCN4), IT (Cav3.1- Cav3.3), IA (Kv1.4, Kv3.4, Kv4.1- Kv 4.3) and IK(IR) (Kir2.1-Kir2.4).
An unbiased hierarchical cluster analysis followed by discriminant function analysis revealed that a positive correlation exists between the physiological and genetic phenotype of BNSTALG neurons. Thus, the analysis segregated BNSTALG neurons into 3 distinct groups, based on their α subunit mRNA expression profile, which positively correlated with our existing electrophysiological classification (Type I–III). Furthermore, analysis of mRNA transcript expression in Type I –Type III neurons suggested that, whereas Type I and III neurons appear to represent genetically homologous cell populations, Type II neurons may be further subdivided into three genetically distinct subgroups. These data not only validate our original classification scheme, but further refine the classification at the molecular level, and thus identifies novel targets for potential disruption and/or pharmacotherapeutic intervention in stress-related anxiety-like behaviors.
Keywords: Bed nucleus of the stria terminalis, ion channels, α subunits, patch clamp recording, single cell reverse transcriptase polymerase chain reaction
Introduction
Activation of the bed nucleus of the stria terminalis (BNST) has been argued to mediate stress responses (Fendt et al., 2003; Waddell et al., 2006) and anxiety-like behaviors to diffuse and/or unpredictable threats (Walker et al., 2003; Hammack et al., 2004), as well as stress-induced drug recidivism (Erb and Stewart, 1999; Shalev et al., 2001). Consistent with a role for the BNST in anxiety-like behavior, electrical stimulation of the anterolateral region produces many of the endocrine, cardiovascular and respiratory responses that are normally elicited by anxiogenic stimuli (Casada and Dafny, 1991). In addition, excitotoxic lesions of the BNST blocked the enhanced startle response elicited after central administration of the stress hormone, corticotropin-releasing factor (CRF) (Lee and Davis, 1997). Moreover, stressors and anxiogenic pharmacological agents, such as yohimbine, m-chlorophenylpiperazine, and caffeine increase the expression of transcription factors, such as the immediate early gene, c-fos, in the anterolateral BNST (Singewald et al., 2003; Day et al., 2004), further suggesting that increased activity of the BNST is associated with an increased state of anxiety.
The BNST is comprised of multiple subdivisions, each of which may contribute to different aspects of its function (Dong and Swanson, 2004). The anterolateral cell group of the BNST (BNSTALG) is a heterogenous structure composed of the juxtacapsular, oval, rhomboid, and fusiform nuclei (Ju and Swanson, 1989). Based on its cytoarchitecture, chemoarchitecture, and projection patterns, the BNSTALG also possesses distinct neuronal subpopulations, however 70–90% can be categorized as medium sized spiny GABAergic neurons (McDonald, 1983; Sun and Cassell, 1993). Despite this apparent homology, neurons of this region exhibit heterogenous physiological responses to several neurotransmitters, including opiates (Casada and Dafny, 1993; Dalsass and Siegel, 1990), norepinephrine (Casada and Dafany, 1993), acetylcholine (Casada and Dafany, 1993), oxytocin (Ingram et al., 1990), and serotonin (Levita et al., 2004; Guo et al., 2009).
Serotonergic modulation of neuronal activity in the BNST determines the developmental risk for stress-related psychopathology (Oler et al., 2009; Hariri and Holmes, 2006). Consistent with these observations, we have shown that chronic stress alters serotonin receptor mRNA expression in the BNST to favor excitation rather than inhibition (Hammack et al., 2009). However, in other brain regions, chronic stress has also been shown to regulate the expression of calcium-, potassium-, and calcium-dependent potassium channels (van Germert, et al., 2009; Chatterjee et al., 2009; Hjaersen et al., 2008; Xie et al., 1999). If we are to fully understand how chronic stress may regulate neuronal activity in regions such as the BNSTALG, we must first determine the ion channel expression profile of neurons within this region.
To date, we have identified three physiologically distinct cell types (Type I–III) in the BNSTALG based on their pattern of action potential firing and their differential expression of four subthreshold intrinsic membrane currents: 1) the hyperpolarization-activated nonspecific cation current (Ih), 2) the low-threshold calcium current (IT), 3) the transient voltage-dependent potassium current (IA), and 4) the inward rectifying current IK(IR) (Hammack et al., 2007).
Type I and Type II neurons possess a prominent Ih current, whereas Type III neurons show little discernable Ih current (Hammack et al., 2007). The Ih channel is encoded by four channel subunits HCN1, HCN2, HCN3, and HCN4 (Ludwig et al., 1998; Santoro and Tibbs, 1999; Gauss and Seifert, 2000; Monteggia et al., 2000; Kaupp and Seifert, 2001). Conversely, Type II neurons are the only subtype that express a prominent IT current, which is encoded by three genes: Cav3.1, Cav3.2, and Cav3.3 (Perez-Reyes, 2003). All BNST neurons appear to express some IA current, mediated by voltage-dependent potassium (Kv) channels consisting of α and β subunits (Song, 2002), which are in turn encoded by several subfamilies of genes. Multiple Kv channel subunits can mediate IA including Kv1.4, Kv3.4, and the Kv4 family (Kv4.1, Kv4.2 and Kv4.3) (Serodio et al., 1996; Coetzee et al., 1999). Similarly, the inward rectifying current IK(IR) is also encoded by multiple genes of the Kir2 subfamily Kir2.1, Kir2.2, Kir2.3 and Kir2.4 (Pruss et al., 2005). What is not known is if, and/or how, differential expression of these gene products may contribute to the physiological diversity of Type I – III BNSTALG neurons. Moreover, chronic stress may differentially regulate the expression of individual members of a single ion channel family. Hence, understanding the genetic phenotype of Type I – III neurons is a critical first step in understanding phow stress may selectively alter neuronal activity in the BNST and, hence, contribute to stress-induced psychopathology.
In the present study, we combined whole-cell patch clamp recordings with single-cell reverse transcription polymerase chain reaction (scRT-PCR) to identify the mRNA expression patterns of these four key ion channel subunits in physiologically defined BNSTALG neurons.
Methods
Animals
All experiments were conducted on male Sprague-Dawley rats (Charles River, NC) at 28 to 42 days of age. All rats were housed five per cage and had unrestricted access to food and water. Care was taken to minimize the number of animals used; all procedures were done in accordance with policy guidelines set by the National Institutes of Health and were approved by the Emory University Institutional Animal Care and Use Committee (IACUC).
Electrophysiological Recordings
Preparation of BNST slices
BNST slices were obtained as previously described (Hammack et al., 2007; Guo and Rainnie, 2010). Briefly, rats were decapitated under deep isoflurane anesthesia (Abbott Laboratories, North Chicago, IL) and the brains rapidly removed and placed in ice-cold “cutting solution”, kynurenic acid– based artificial cerebrospinal fluid (ACSF), which contained (in mM): NaCl (130), KCl (3.5), KH2PO4 (1.1), MgCl2 (6.0), CaCl2 (1.0), NaHCO3 (30), glucose (10), and kynurenic acid (2). The glutamatergic antagonist kynurenic acid was included in the “cutting solution” to suppress any unwanted effects of glutamate release that may occur during tissue slicing. Divalent cation levels were also adjusted to reduce the probability of neurotransmitter release. A block of tissue containing the BNST was then mounted on the stage of a Leica VTS-1000 vibrating microtome (Leica Microsystems, Bannockburn, IL), and 350 μm coronal slices were cut. Slices were transferred to a holding chamber containing “cutting solution” at room temperature and gassed with a 95% O2–5% CO2 mixture for 1 h before being placed in oxygenated control ACSF containing (in mM): NaCl (130), KCl (3.5), KH2PO4 (1.1), MgCl2 (1.3), CaCl2 (2.5), NaHCO3 (30), and glucose (10). Experiments started a minimum of 0.5 h after the transfer of slices into the control ACSF to washout the action of kynurenic acid.
Visual identification of BNSTALG neurons
Slices were placed in a Warner Series 20 recording chamber (Warner Instruments, Hamden, CT) mounted on the fixed stage of a Leica DM-LFS microscope (Leica Microsystems). Slices were fully submerged and continuously perfused at a rate of 1–2 ml/min with heated (32°C) and oxygenated ACSF. BNSTALG neurons were visualized using infrared (IR) illumination and a 40X water-immersion objective (Leica Microsystems). Images were captured using an IR-sensitive charge-coupled device (CCD) digital camera (Orca ER, Hamamatsu, Tokyo, Japan), coupled to a Phoenix video frame grabber (Active Silicon, North Chelmsford, MA), and displayed on a computer monitor using Simple PCI 6.11 software (Compix, Sewickley, PA).
Recording procedures
For whole cell patch-clamp recording, autoclaved thin-walled borosilicate glass-patch electrodes (WPI, Sarasota, FL) were pulled on a Flaming/Brown micropipette puller (Model P-97, Sutter Instrument, Novato, CA). Patch electrodes had resistances ranging from 4 to 6 MΩ, when filled with a standard RNase free patch solution that contained (in mM): K-gluconate (138), KCl (2), MgCl2 (3) and HEPES (10). The patch-recording solution was adjusted to a pH of 7.3 with KOH and had a final osmolarity of 280 mOsm. Whole cell patch-clamp recordings were obtained using a MultiClamp 700B amplifier (Molecular Devices, Sunnyvale, CA), with a Digidata 1320A A–D interface, and pClamp 10 software (Molecular Devices). For all experiments, whole cell patch-clamp configuration was established only when the seal resistance was >1.5 GΩ. Neurons were excluded from analysis if they showed a resting membrane potential (Vm) more positive than −55 mV and/or had an action potential that did not overshoot +10 mV. Current-clamp signals were filtered at 5 kHz and digitized at 10–20 KHz. Series resistance was bridge balanced and monitored over the course of each experiment and was considered acceptable with change less than 15%. All electrophysiology data were analyzed with a custom made MATLAB 2009a script (Mathwork, Natick, MA).
Electrophysiological parameter definitions
Fast after-hyperpolarization (fAHP, in mV): the difference between the action potential threshold and the most negative membrane potential attained after the action potential, measured in response to the smallest depolarizing current step (Δ10 ms) evoking an action potential.
Input resistance (Rin, in MΩ): the difference between baseline (−60 mV) and the peak voltage response divided by the injected current (20–50 pA).
Membrane time constant (Tau, in ms): determined from the mono exponential curve best fitting the voltage deflection evoked in response to a 20–50 pA hyperpolarizing current step depending on the input resistance.
Resting membrane potential (RMP, in mV): the steady state membrane potential reached several minutes after breaking the seal, with no DC current applied.
First inter-spike-interval (ISI1, in ms): the time interval between the threshold of the first action potential and the threshold of the second action potential in response to a 750 ms depolarizing current injection.
Last inter-spike-interval (ISILast, in ms): the time interval between the threshold of the penultimate action potential and the threshold of the last action potential in response to a 750 ms depolarizing current injection.
Spike adaptation ratio (dimensionless): the ratio of ISI1 to ISILast.
Ih ratio: the difference between the steady state membrane potential at the end of a 750 ms hyperpolarizing current step and the most negative membrane potential at the beginning of the step, divided by the most negative membrane potential.
IK(IR) ratio: The difference between the peak membrane potential at the beginning of the two smallest hyperpolarizing steps divided by the difference between the peak membrane potential at the beginning of the two largest hyperpolarizing steps, such that a cell with no observable inward rectification has a rectification ratio equal to 1.
Spike Threshold (in mV): the point at which the action potential was initiated. The point at which the membrane potential showed a greater than 10 fold change in the rate of rise (mV/ms) in response to the smallest depolarizing current step (10 ms) evoking an action potential.
Spike Amplitude (in mV): the difference between the threshold and the voltage at the peak of the action potential.
Spike half-width (in ms): measured at half height between threshold and peak action potential.
10–90% rise time (in ms): time to reach 90% of the peak amplitude of the action potential from 10% of the peak amplitude during the rising phase of the action potential.
90-10% decay time (in ms): time to reach 10% of the peak amplitude of the action potential from 90% of the peak amplitude during the falling phase of the action potential.
Histochemical Visualization of Recording Sites
To determine the location of recorded neurons in the BNSTALG, biocytin (0.3%) was included in the patch recording solution and neurons were visualized using post hoc procedures as previously described (Levita et al., 2004). In brief, after recording, slices were placed in 4% paraformaldehyde overnight. The slices were then washed with 0.05 M phosphate buffer/0.15 M NaCl solution (PBS, 3×10 min), and re-sectioned to 70 μM using an OTS 4000 vibratome (FHC Inc, Bowdoinham, ME). Tissue sections were then placed in 0.6% H2O2 and 0.5% Triton X-100 in PBS for 1 h to quench endogenous peroxidase activity, washed in PBS (3×10 min) before being incubated in an avidin–biotin peroxidase complex for 2 h (ABC Vectorstain Elite kit; Vector Laboratories, Inc., Burlingame, CA). Slices were then washed in PBS (3×10 min), and visualized using 3,3-diaminobenzidine (DAB; Sigma-Aldrich, St. louis, MO) as the chromogen (DAB 0.7 mg/ml) and H2O2 0.2 mg/ml in 0.06 M Tris buffer. The sections were placed in DAB until adequate staining had developed, and the reaction was stopped by transferring the sections to PBS. After two more washes in PBS the sections were mounted onto gelatinized slides, air dried, then dehydrated in an ascending series of alcohols, cleared in histoclear (2×3 min), and cover-slipped with Permount mounting medium (Fisher Scientific, New Jersey).
RNA Isolation and Reverse Transcription
RNA Isolation
Total RNA was isolated from BNST tissue by homogenizing each sample in Trizol (Invitrogen, Carlsbad, CA). The isolated RNA was then reverse transcribed using a cocktail containing 5 μl of 10XRT buffer, 10mM dNTP mix, 10X random hexanucleotide and Multiscribe RT 5U/ul and RNAase free water. The mixture was incubated in a thermal cycler at 25°C for 10 min and then at 37°C for 120 min, the resulting cDNA samples were stored at −20°C. All reagents were obtained from Applied Biosystems (Foster City, CA).
Qualitative PCR
The cDNA was amplified using 10X PCR buffer (Qiagen, Germantown, MD), 3mM MgCl2 (Qiagen), 10mM dNTPs, 2.5U of Taq DNA Polymerase (Qiagen) and 100nM primers. PCR primers used for each of the ion channels were developed from GenBank sequences with commercially available Oligo software (IDT Tools, Coralville, IA, USA). The housekeeping gene 18S rRNA was used in all experiments as a positive control. All of the oligonucleotide primers used in this study are given in Table 1. Standard PCR was performed on a PTC-200 Peltier thermal cycler (MJ Research) using the following program: 94°C for 40 sec, 56°C for 40 sec and 72°C for 1 min for 40 cycles. PCR products were visualized by staining with ethidium bromide and separated by electrophoresis in a 1% agarose gel. Each experiment was repeated six times with different rat samples and each sample was assayed in triplicate to reduce inter-sample variation.
Table 1.
PCR Primer used in this study
| Genes | Accession No. | PCR Product Size (bp) | Genes | Accession No. | PCR Product Size (bp) |
|---|---|---|---|---|---|
| 18S rRNA | X01117 | 563 | Kv3.4 | X62841 | 676 |
| HCN1 | AF247450 | 405 | Kv4.1 | M64226 | 467 |
| HCN2 | AF247451 | 211 | Kv4.2 | S64320 | 265 |
| HCN3 | AF247452 | 335 | Kv4.3 | U42975 | 296/386 |
| HCN4 | AF247453 | 462 | Kir2.1 | X73052 | 413 |
| Cav3.1 | AF027984 | 407 | Kir2.2 | NM010603 | 358 |
| Cav3.2 | AF290213 | 256 | Kir2.3 | NM008427 | 204 |
| Cav3.3 | AF086827 | 556 | Kir2.4 | NM45963 | 234 |
| Kv1.4 | X16002 | 434 | GAD67 | M76177 | 426 |
Single-Cell RT-PCR
At the end of each recording session, the cell cytoplasm was aspirated into the patch recording pipette containing ~5 μl of RNase-free patch solution under visual control, by applying gentle negative pressure. The contents of the patch pipette were then expelled into a microcentrifuge tube containing 5 μl of the reverse transcription cocktail by applying positive pressure. The mRNA was reverse transcribed using 50U of Multiscribe RT and was performed in a final volume of 10 μl as described above. The cDNA was stored at −20°C before further processing. Subsequently, 3 μl of each RT product was amplified in triplicate in 0.2 ml thin walled PCR tubes. Here, 19 μl of PCR mixture I [1X Buffer, dNTP mix, 1 μg/μl primer V3 (dT)24] and 0.05 U/μl Taq DNA Polymerase (Qiagen) was added to each tube for the first round of PCR. Cycling conditions for the first round of PCR were: 95°C for 3 min, 50°C for 2 min and 72°C for 3 min. The tubes were immediately put on ice for 1 min, and 19 μl of PCR mixture II was added with a composition the same as that of PCR mixture I but with primer V1 (dT)24 replacing primer V3(dT)24 (Kurimoto et al., 2006). A 20-cycle PCR amplification was then performed with the following cycling conditions: 95°C for 30 sec, 67°C for 1 min and 72°C for 3 min with a 6 sec extension per cycle. The total amount of cDNA amplified per sample was 123 μl. Amplified cDNA sample was quantified using a Nanodrop 1000 Spectrophotometer (Thermo Scientific, Wilmington, DE), and the concentration per sample ranged from 500–1000ng/μl, and had OD values ranging from 1.9–2.0. The amplified cDNA from each cell was analyzed for the expression of 18S rRNA as a positive control marker. The resultant cDNA was subjected to another amplification step using 2 μl of cDNA from each cell as a template and 100nM of each of the primers for GAD67, Ih, IT, IA and IK(IR) channel subunits. The PCR master mix for the final PCR consisted of 10X PCR Buffer, 3mM MgCl2, 10mM dNTPs, 2.5U of Taq DNA Polymerase in a final volume of 20 μl. PCR was performed using a 10 min hot start at 95°C followed by a 40 cycle program (94°C for 40 sec, 56°C for 40 sec and 72°C for 1min). PCR products were visualized by staining with ethidium bromide and separated by electrophoresis in a 1% agarose gel.
Controls for the RT-PCR
PCR conditions were optimized using total RNA isolated from rat BNSTALG so that a PCR product could be detected from (250pg–1 ng) of total RNA without contamination caused by non-specific amplification. For each PCR amplification, sterile water was used instead of cDNA as a control for contaminating artifacts. A control with no RT was also used in each amplification. Both the controls gave negative results throughout the study. All primers were intron-spanning to exclude amplification of genomic DNA. This possibility was further omitted by the fact that the cell nucleus was never harvested while isolating mRNA from single cell.
Quantitative PCR
Real-time PCR reactions were performed using an Applied Biosystems 7500 Fast-Real Time PCR system (Applied Biosystems, Foster City, CA). Here, 1 μl samples of unamplified cDNA obtained from the single (Type I, II and III BNST neurons) were combined with Taqman probes specific for 18S rRNA (assay ID, Hs99999901_s1), Cav3.3 (Rn01505210_g1) and Kv4.3 (Rn00709608_m1) and 1x Taqman universal PCR Master Mix (Applied Biosystems). The reaction for each cell sample was performed in triplicate, and using the 50 cycle thermal cycling program: cycle 1–20 min at 95°C; cycles 2 through 50– 95°C for 3 sec, followed by 60°C for 30 min.
Statistical analysis
Statistical analyses were carried out using SPSS 16.0 (SPSS, Chicago, IL). One way analysis of variance (ANOVA) was used to determine the differences of physiological properties among three cell types. An unsupervised, hierarchical cluster analysis using Ward’s method (Ward, 1963) and squared Euclidian distance was performed to classify cell types of BNSTALG neurons. This method has been used successfully by previous studies to classify CCK cells in basolateral nucleus of amygdala (Jasnow et al., 2009), somatostatin cells of the sensorimotor cortex, and projection neurons and interneurons of the lateral amygdala (Halabisky et al., 2006; Sosulina et al., 2006). Briefly, this clustering method begins by separating each individual neuron into a cluster by itself. At each stage of the analysis, the neurons that are most similar, as measured by our electrophysiological parameters and ion channel mRNA expression profile, are grouped together to form another larger cluster. This process continues until all of the neurons are joined into a single cluster. Ward’s method minimizes the error sum of squares of any pair of clusters formed at a given step; this maximizes between-group differences and minimizes within-group differences. Before clustering, each electrophysiological property was log transformed and converted into standardized z-scores. This achieves a normal distribution and prevents variables with larger ranges from having a greater influence on the cluster solution than variables with small ranges. After the hierarchical cluster analysis was performed, the appropriate number of clusters was determined by examining within-group and between-group squared Euclidian distances. A good cluster solution should have large between-cluster differences and small within-cluster differences. A one-way analysis of variance (ANOVA) was used to detect statistically significant differences in electrophysiological parameters among the reported clusters. For all analyses, statistical significance was ascribed at p < 0.05. The parameters used in the cluster analysis were chosen based on intrinsic membrane currents, which are important in identifying the three types of neurons within the BNSTALG. Membrane potential, Ih, ISI1, IK(IR), spike threshold and half width, together with the expression of the ion channel subunits HCN1-HCN4, Cav3.1-Cav3.3, Kv1.4, Kv3.4, Kv4.1-Kv4.3, and Kir2.1-Kir2.4 were used for the cluster analysis. Further analysis was conducted using a Discriminant Function Analysis (DFA) in order to determine the electrophysiological properties and genetic phenotype most strongly contributing to group membership. In addition, DFA builds a predictive model for group membership. Briefly, this analysis attempts to find linear combinations of the variables that best separate the groups of cells by maximizing the between-group variance. Finally, a leave-one-out cross-validation procedure was then used to validate the discriminant functions.
Results
Our previous study defined three electrophysiologically distinct subtypes of BNSTALG neuron based on their expression of the membrane currents Ih, IT, IA, IK(IR) (Hammack et al., 2007). However, the ion channels that mediate these currents can be formed by permutations of several different α subunits, and little is known about the relative expression of these ion channel subunits in BNSTALG neurons. To address this critical knowledge gap, we harvested the cytoplasmic mRNA from physiologically identified BNSTALG neurons and examined their expression of Ih, IT, IA, IK(IR) channel subunits using single cell RT-PCR. For unsupervised cluster analysis and discriminant function analysis we used the following physiological parameters: membrane potential, Ih, ISI1, IK(IR), spike threshold, half-width; as well as the mRNA expression profile of the Ih, IT, IA, and I(KIR) channel α subunits.
Three electrophysiologically distinct neuronal populations in the BNSTALG
A total of 51 BNST neurons were included in this study, all of which were located in the boundaries of the BNSTALG. For methodological reasons it is not possible to extract cytosolic RNA and also fill cells with biocytin. Hence, a schematic diagram of the position of a representative population of BNSTALG neurons with similar biophysical properties is shown in Figure 1. As illustrated, the majority of neurons recorded were located within the boundaries of the oval nucleus (BNSTov) of the BNST, however, several cells were recorded that were located in the juxtacapsular (BNSTju) and anterolateral nuclei (BNSTal). For each of the 51 neurons recorded in this study, we conducted a series of standardized current-clamp protocols to determine their characteristic voltage response to transient depolarizing and hyperpolarizing current injections (Hammack et al., 2007). Based on their electrophysiological characteristics, Type I neurons accounted for 11%, Type II for 66%, and Type III neurons for 21% of the sample population. As shown in Table 2, the intrinsic membrane currents, Ih, IT and IK(IR), played a significant role in determining the subtypes of BNSTALG neurons. Consistent with our previous study, Type I and II neurons had a significantly larger Ih current than Type III neurons, whereas Type III neurons displayed the largest I(KIR) current. The IT current was approximated by the duration of ISI1, which was significantly shorter in Type II and Type III than in Type I neurons. However, each of these macroscopic currents is mediated by ion channels that are multimeric structures comprised of one or more functional subunits. Consequently, we next screened each of these BNSTALG neurons for their expression of the specific ion channel α subunits.
Figure 1.

Schematic diagram showing the location of a representative sample of biocytin-labeled neurons visualized with histochemistry in the BNSTALG. AC= anterior commissure. BNSTov= oval nucleus of the BNST. BNSTju=Juxtacapsular nucleus of the BNST. BNSTal= anterolateral nucleus of the BNST.
Table 2.
Electrophysiological properties of Type I, Type II and Type III neurons of the BNSTALG
| Type I (n=6) | Type II (n=34) | Type III (n=11) | |
|---|---|---|---|
| Percentage (%) | 11 | 66 | 21 |
| RMP (mV) | −61.0±1.753 | −57.8±0.733 | −67.3±1.291,2 |
| Rin (MΩ) | 266.7±52.2 | 297.1±21.9 | 195.8±38.6 |
| Tau (ms) | 25.4±2.97 | 22.7±1.24 | 19.7±2.19 |
| Ih | 0.042±0.0072,3 | 0.071±0.0031,3 | 0.010±0.0051,2 |
| IK(IR) | 1.82±0.283 | 2.21±0.123 | 3.75±0.211,2 |
| Spike | |||
| Threshold (mV) | −42.8±1.303 | −43.4±0.543 | −38.3±0.961,2 |
| Amplitude (mV) | 74.8±2.88 | 73.2±1.213 | 78.4±2.122 |
| Rise time (ms) | 0.40±0.04 | 0.49± 0.01 | 0.43± 0.03 |
| Decay time (ms) | 1.01± 0.15 | 1.28± 0.06 | 1.17± 0.11 |
| Half-width (ms) | 1.01±0.10 | 1.21±0.04 | 1.06± 0.08 |
| ISI1 (ms) | 106.6±7.822,3 | 18.4±3.281 | 22.8±5.771 |
| ISILast(ms) | 127.9± 16.183 | 106.2±6.793 | 41.9±11.951,2 |
| ISI1/ISILast | 0.82±0.082,3 | 0.19±0.031,3 | 0.55±0.061,2 |
| fAHP Diff | −7.64±1.01 | −5.26±0.61 | −5.48±0.81 |
Values are expressed as mean±SEM. Superscript following the SEM indicates cell type differences based on analysis of variance (ANOVA, p<0.05)
Type I,
Type II and
Type III.
Ion channel subunit mRNA expression in whole tissue and single BNSTALG neurons
Isolated BNSTALG tissue expressed mRNA transcripts for all of the ion channel subunits HCN1-4, Cav3.1-3, Kv1.4, Kv3.4, Kv4.1-3, and Kir2.1-4, and their expression pattern was qualitatively similar across all animals. Significantly, our RT-PCR protocol was sensitive enough to detect two splice variants of the Kv4.3 subunit in our tissue sample. As shown in Figure 2, the location of the bands for each of the 17 genes corresponds to the expected PCR fragment size based on the oligonucleotide primers used for this study (see Table 1). Although the whole tissue RT-PCR study revealed the extent of specific ion channel subunit expression in the BNSTALG, it did not allow us to determine whether the electrophysiological properties of individual BNST neurons were associated with specific ion channel subunit expression. Therefore, we combined RT-PCR with whole cell patch clamp recordings to identify channel subunit expression in single BNSTALG neurons.
Figure 2.
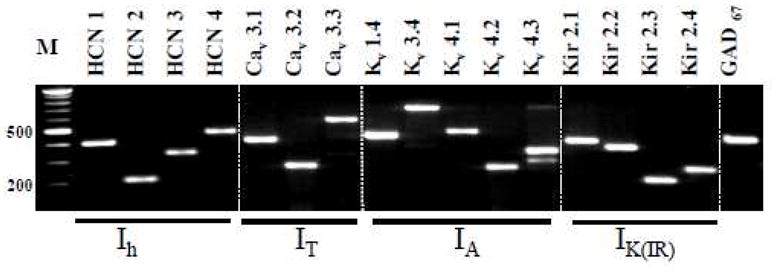
Gel picture showing the mRNA expression of Ih, IT, IA, IK(IR) channel subunits and GAD67, in the BNSTALG. Total RNA was isolated and cDNA was amplified by PCR with primers specific for each of the channel subunits. The amplified products were electrophoresed in 1% agarose gel. M denotes a molecular weight marker.
Consistent with previous in situ hybridization studies (Cullinan et al., 1993) mRNA transcripts for the γ-aminobutyric acid (GABA) synthesizing enzyme, GABA-aminodecarboxylase 67 (GAD67) was detected in all neurons tested, suggesting that Type I – III neurons are primarily GABAergic. Moreover, an initial examination of the ion channel subunit expression in individual neurons revealed that unlike whole tissue, mRNA transcripts for the Kv3.3, Kv4.1, Cav3.2 and Kir2.4 subunits were never detected in BNSTALG neurons, suggesting that these transcripts may be preferentially expressed in the non-neuronal cell population.
We next screened each of the physiologically identified BNSTALG neurons for the 16 channel subunits that together determine the expression of Ih, IT, IA and I(KIR). Transcripts, for all of the remaining subunits of Ih, IT, IA, IK(IR) channels were found to be differentially distributed across Type I–III neurons (Figure 3). Thus, an initial analysis of gene expression in individual neurons, using HCN channel subunit expression as a seed value, revealed that BNSTALG neurons could be differentiated into three main subgroups, which showed a close correlation with the previously defined Type I–III physiological subtypes. The results of this analysis are summarized in Table 3. For example, one subgroup of neurons (n=5) were characterized by their expression of transcripts for HCN2 and HCN4 only, together with Kv4.2 and Kv4.3, and Kir2.1, but none of the other ion channel subunits. Significantly, this subgroup corresponded to 5/6 of the Type I neurons recorded in this study. Similarly, another subgroup of neurons (n=9) was characterized by their expression of transcripts for only the HCN4 subunit, together with Cav3.3, Kv4.2, and Kir2.1, 2.2 and 2.3 subunits, and these neurons corresponded to 9/11 of the Type III neurons recorded. Finally, three additional subgroups were identified in which all of the neurons expressed transcripts for HCN1 (n=34), but which were then subdivided based on their expression of at least one other HCN subunit. All of these neurons corresponded to Type II neurons.
Figure 3.
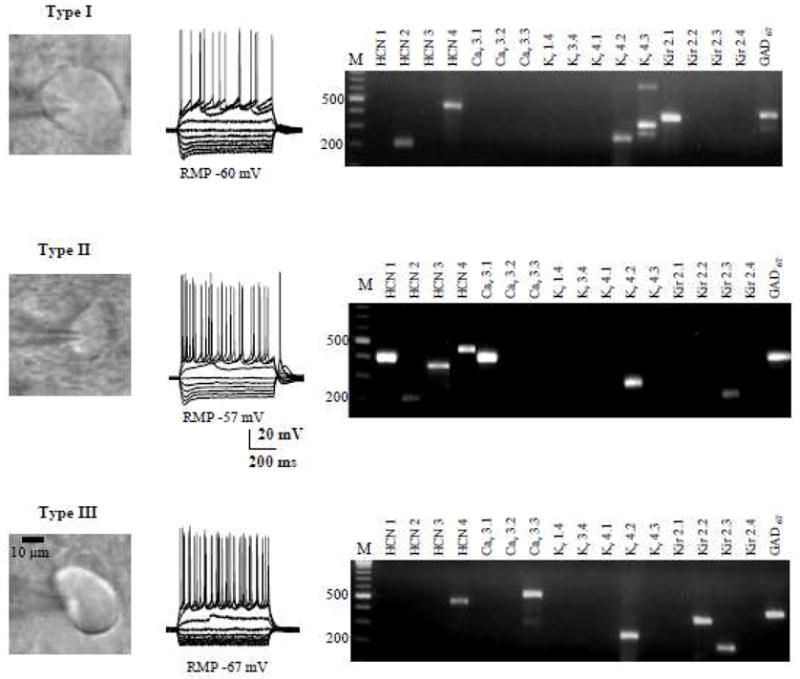
Representative figure showing the shapes, typical responses to hyperpolarizing and depolarizing current injections, and ion channel subunits mRNA expression of Type I–III BNSTALG neurons.
Table 3.
Differential distribution of ion channel subunits in BNSTALG neurons.
| Cell Type | HCN | Cav | Kv | Kir | # | ||||||||||||
|---|---|---|---|---|---|---|---|---|---|---|---|---|---|---|---|---|---|
| 1 | 2 | 3 | 4 | 3.1 | 3.2 | 3.3 | 1.4 | 3.4 | 4.1 | 4.2 | 4.3 | 2.1 | 2.2 | 2.3 | 2.4 | ||
| I | 0 | + | 0 | + | 0 | 0 | 0 | 0 | 0 | 0 | + | + | + | 0 | 0 | 0 | 5/6 |
| II | + | + | + | + | + | 0 | 0 | 0 | 0 | 0 | + | 0 | + | 0 | + | 0 | 15/34 |
| + | + | + | 0 | + | 0 | 0 | 0 | 0 | 0 | + | 0 | 0 | 0 | +/− | 0 | 8/34 | |
| + | + | 0 | 0 | + | 0 | + | 0 | 0 | 0 | 0 | + | 0 | 0 | + | 0 | 11/34 | |
| III | 0 | 0 | 0 | + | 0 | 0 | + | 0 | 0 | 0 | + | 0 | +/− | + | + | 0 | 9/11 |
Cells were first filtered according to their expression pattern for the HCN subunits. Subsequent filtering was determined by ≥ 80% expression (+), ~ 50% expression (+/−), and < 10% expression (0). Numbers in the far right column represent the number of cells for each subgroup that expressed all of the HCN channels indicated and ≥ 80% expression for two or more of the remaining α subunits.
Type I – III neurons also showed distinct distribution patterns for the IT channel subunits. Hence, Cav3.3 mRNA was expressed in 100% of Type III neurons, and 47% of Type II neurons, whereas only 17% of Type I neurons expressed this subunit. Transcripts for Cav3.1 were expressed in 91% of Type II neurons, but were not expressed in either Type I or III neurons. Conversely, expression of the IA channel subunits was similar across all three subtypes, with the following exceptions: transcripts for Kv1.4 were expressed only in Type II neurons (6%), whereas Kv3.4 transcripts were expressed in Type I (17%) and Type III neurons (9%), but not in Type II neurons. As shown in Table 4, transcripts for both Kv4.2 and Kv4.3 were found at high levels in all three subtypes of BNSTALG neuron. Finally, transcripts for all three IK(IR) channel subunits (Kir2.1-Kir2.3) were found in every BNSTALG neuron tested irrespective of subtype, however, the individual subunits were not uniformly expressed. Hence, Kir2.1 expression was highest (83%) in Type I neurons compared to other two subtypes (29% in Type II, and 45% in Type III). Conversely, the expression of Kir2.2 and Kir2.3 was highest in Type III neurons (64 % and 72%) compared to Type II (20 %, and 62%) and Type I neurons (0%, and 17%), respectively.
Table 4.
Percentage of mRNA expression of ion channel subunits in BNSTALG neurons
| Membrane currents | Encoding genes for channel subunits | Percentage of expression | ||
|---|---|---|---|---|
| Type I | Type II | Type III | ||
| Ih | HCN1 | 0 | 91 | 0 |
| HCN2 | 83 | 97 | 9 | |
| HCN3 | 0 | 44 | 0 | |
| HCN4 | 83 | 68 | 100 | |
| IT | Cav3.1 | 0 | 91 | 0 |
| Cav3.2 | 0 | 0 | 0 | |
| Cav3.3 | 17 | 47 | 100 | |
| IA | Kv1.4 | 0 | 6 | 0 |
| Kv3.4 | 17 | 0 | 9 | |
| Kv4.1 | 0 | 0 | 0 | |
| Kv4.2 | 100 | 62 | 91 | |
| Kv4.3 | 100 | 32 | 9 | |
| IK(IR) | Kir2.1 | 83 | 29 | 45 |
| Kir2.2 | 0 | 20 | 64 | |
| Kir2.3 | 17 | 62 | 72 | |
| Kir2.4 | 0 | 0 | 0 | |
To ensure that the relative subunit expression profiles outlined above were due to genuine differences in transcript expression and not due to limits in our PCR detection sensitivity, we ran a quantitative RT-PCR comparison for two genes; Cav3.3 and Kv4.3, which showed opposite expression patterns in Type I–III neurons (see Table 4). As illustrated in Figure 4, a plot of relative fluorescence intensity as a function of PCR cycle number showed that the threshold Ct value for the Cav3.3 transcript in Type I – III BNSTALG neurons was significantly different (Type III Ct = 33±0.15; Type II Ct = 36±0.23; and Type I Ct = 39±0.35). The expression pattern is consistent with the mRNA expression pattern observed for Cav3.3 gene transcripts using our qualitative PCR detection method, where Cav3.3 mRNA was expressed in 11/11 Type III neurons, 11/34 Type II neurons, and only in 1/6 Type I neurons. Similarly, for Kv4.3, the Ct values are significant (P<0.0001) for (Type I Ct=34±0.27; Type II Ct=36±0.12; Type III Ct=39±0.21). The percentage of expression pattern is also consistent and shown in the Table 4.
Figure 4.

Real-time RT-PCR measures Cav3.3 and Kv4.3 subunits in BNSTALG neurons (Type I-III). Mean Ct values for Cav3.3 subunit in BNSTALG neurons are Type I (39±0.35), Type II (36±0.23) and Type III (33±0.15). The Ct values are significant among each other at *P<0.0001. Similarly, for Kv4.3, the Ct values are significant (*P<0.0001) for Type I (34±0.27), Type II (36±0.12) and Type III (39±0.21). The Ct values of reference gene 18S rRNA among three neurons are (Type I= 24.8±0.21; Type II= 24.6±0.29 and Type III=24.2±0.19)
Classification of BNSTALG neurons using cluster analysis of ion channel subunit expression and physiological properties
To determine if the genetic subgroups identified above truly correlate with our previous physiological classification of BNSTALG neurons, we ran an unbiased hierarchical cluster analysis, which incorporated all 16 genetic variables and 6 physiological variables for each neuron; using analytical techniques we have previously reported to determine group membership. This analysis yields the dendogram illustrated in Figure 5, and segregated the sample population into three distinct clusters, which is consistent with our previous observation. We next designated each neuron Type I – III based solely on their physiological properties as previously defined. Significantly, out of a total of 51 neurons, the largest dendrogram cluster (n=34) was comprised almost exclusively of Type II neurons. The remaining neurons also fell into two distinct clusters; one of which was exclusively comprised of Type I neurons (n=4), and the second which was comprised exclusively of Type III neurons (n=10). The unbiased cluster analysis did identify 2 Type I neurons and 1 Type III neuron that were clustered together with the Type II neurons. Nevertheless, this cluster analysis not only validated our original classification of BNSTALG neurons into three distinct subtypes, but also showed a unique view into the genetic determinants of their physiological phenotype. Moreover, a subsequent discriminant function analysis (DFA) showed that the separation of BNSTALG neurons into three distinct groups (Types I–III, Figure 6) was based on two discriminant functions. Both discriminant functions 1 and 2 significantly contributed to group membership (Wilks’ Lambda, p < 0.001, Eigenvalues = 33.7, 8.2, corresponding to 80.4% and 19.6% of the variance, respectively). The contribution of each variable to each discriminant function can be seen in the structure matrix of Table 5. Variables that are correlated with a particular discriminant function segregate cells most strongly along this function’s axis relative to other functions. The first discriminant function distinguished cells based on expression of Cav3.1, HCN1, Kv3.4, Kir2.2, HCN3 and spike threshold. The second function distinguished cells based on HCN2, Kv4.3, Cav3.3, Kv1.4, Kir2.1, Kv4.2, HCN4, Kir2.3, Ih IISI1, IK(IR), action potential half width and membrane potential. The discriminant scores for each cell were determined for discriminant functions 1 and 2, and demonstrate that there is good separation of all three groups of BNSTALG neurons in both discriminant functions (Figure 6).
Figure 5.

Hierarchical cluster analysis through dendogram. Individual neuron is represented by the intersection of branches on x-axis. Squared Euclidian distance between the group centroids is depicted by y-axis. Three groups were determined by analysis of within and between group distances. Type I, II and Type III BNSTALG neurons are clustered into three groups.
Figure 6.
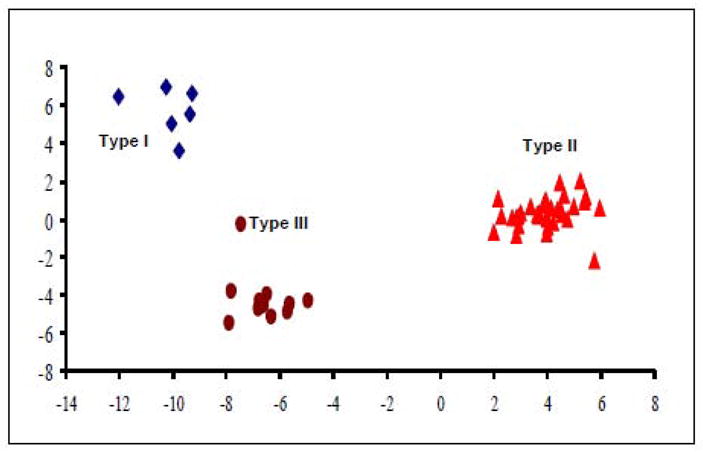
Separation of BNSTALG neurons along canonical discriminant function 1 and 2. There is a good distribution of the cells into three distinct groups along both discriminant functions.
Table 5.
Structure Matrix coefficients
| Variables | Discriminant Function 1 | Discriminant Function 2 |
|---|---|---|
| Cav3.1 | 0.397* | 0.139 |
| HCN1 | 0.208* | −0.037 |
| Kv3.4 | 0.197* | −0.073 |
| Kir2.2 | −0.162* | −0.089 |
| Spike Threshold | 0.122* | 0.017 |
| HCN3 | 0.110* | 0.038 |
| HCN2 | 0.233 | 0.436* |
| ISI1 | −0.236 | 0.414* |
| Ih | 0.295 | 0.332* |
| IK(IR) | −0.065 | −0.243* |
| Kv4.3 | −0.048 | 0.231* |
| Half width | 0.026 | 0.228* |
| Cav3.3 | −0.033 | −0.226* |
| RMP | 0.157 | 0.223* |
| Kv1.4 | 0.179 | 0.195* |
| Kir2.1 | 0.097 | −0.182* |
| Kv4.2 | −0.067 | −0.126* |
| HCN4 | −0.061 | −0.067* |
| Kir2.3 | −0.051 | 0.066* |
Pooled within-groups correlations between discriminating variables and standardized canonical discriminant functions. An asterisk (*) indicates the largest correlation between each variable and any discriminant function. The variable contributes most to the segregation of cells along that functions’ axis, relative to other discriminant functions.
Discussion
Here, we extend our previous report, which first characterized BNSTALG neurons into three electrophysiologically distinct subtypes (Type I, Type II, and Type III), to show that each subtype also expresses a characteristic profile of transcripts for ion channel subunit mRNA that can be used to further differentiate the neuronal subpopulations. Using unbiased cluster- and discriminant functional analysis we show that BNSTALG neurons display genetically distinct phenotypes that can explain subtle differences in physiologic function in the three subpopulations. For example, physiologically identified Type III neurons differ from Type I and Type II neurons by their expression of a prominent IK(IR) current, minimal Ih current, and an apparent absence of IT current. Consistent with this observation the present study has revealed that Type III neurons express all three Kir2.1-2.3 subunits, only the slow activating HCN4 subunit, and the Cav3.3 but not the Cav3.2 subunit. Significantly, the results of the current study not only validated our previous physiological classification of neurons in the BNSTALG, but also suggested that three genetically distinct subtypes of Type II neurons may exist in the BNSTALG, which could not be easily differentiated in our physiological recordings. These studies represent the first of their kind to examine the genetic fingerprint of BNSTALG neurons. Our long-term goal is to use a genome-wide analysis to identify additional cell-specific gene expression profiles that may be modified by behavioral stress paradigms, or that could offer novel avenues for the pharmacologic manipulation of distinct subpopulations of BNST neurons.
Ih
In our electrophysiological recordings, we have shown that the Ih current in BNSTALG neurons is bimodal; whereby some BNST neurons show a prominent, fast activating Ih, while others show a small, slow activating Ih (Hammack et al., 2007, Figure 3). Here, we showed that Type I and II neurons have a prominent, fast onset depolarizing sag in their voltage response to hyperpolarizing current injection, presumably mediated by a fast activating Ih current. In contrast, Type III neurons showed only a small, slow onset, depolarizing sag, presumably mediated by the activation of a slow Ih current (see Hammack et al., 2007 Figure 9). We hypothesized that the potentially different Ih kinetics among the cell types may be due to differing compositions of Ih channel subunits. The Ih channel subunits are encoded by four genes, HCN1- HCN4, and each subunit differs in its activation and inactivation kinetics (Robinson and Siegelbaum, 2003). Hence, HCN1 channels display the fastest activation kinetics, HCN2 have intermediate kinetics, HCN3 activates more slowly, and HCN4 shows the slowest kinetics (Santoro et al., 2000; Altomare et al., 2003; Mistrik et al., 2005). Previous in situ studies had shown that the BNST has high levels of expression for HCN1 mRNA, moderate levels for HCN3, and low levels of HCN2 and HCN4 mRNA expression (Monteggia et al., 2000). However, the distribution of HCN genes at the cellular level was not known. Here, we show that all four HCN genes are expressed by BNST neurons, however, consistent with our physiological observations transcripts for the channel subunit isoforms are differentially distributed across subtypes. Hence, Type I neurons that show an intermediate level of depolarizing sag express only HCN2 (83%) and HCN4 (83%). Type II BNST neurons, which show the pronounced depolarizing sag express high levels and combinations of all four HCN genes (HCN1-91%, HCN2-97%, HCN3-44% and HCN4-68%), and Type III neurons that lack a prominent depolarizing sag express only HCN4 mRNA. A similar consistency between HCN gene expression and Ih kinetics has been reported elsewhere in the brain. For example, hippocampal CA1 neurons strongly express HCN1 and exhibit a rapidly activating Ih current. In contrast, thalamocortical relay neurons express HCN2 and HCN4 and like Type I neurons exhibit a more slowly activating Ih current (Robinson and Siegelbaum, 2003).
IT
The IT current can be carried by channels encoded by the α1 subunits of Cav3.1, Cav3.2 and Cav3.3 genes (Perez-Reyes 2003). IT regulates action potential generation, as well as coordinating pacemaker and burst firing behavior (Huguenard and McCormick, 1992; Perez-Reyes, 1999). A prominent IT current has been reported in neurons from multiple brain regions including the BNST (Rainnie, 1999), basal forebrain (Hoehn et al., 1993), temporal cortex (Sayer et al., 1993), piriform cortex (Magistretti and de Curtis, 1998), hippocampus (Zhang et al., 1993), amygdala (Kaneda and Akaike, 1989), reticular thalamus (Huguenard and Prince, 1992), hypothalamus (Akaike et al., 1989) and cerebellum (Kaneda et al., 1990). Previous in situ studies had shown that Cav3.1 mRNA was highly expressed in the BNST, whereas Cav3.2 and Cav3.3 showed only moderate to low levels of expression (Talley et al., 1999). However, these studies did not determine the relative distribution of the IT channel subunits across different subdivisions of the BNST, nor could they determine the relative level of neuronal expression versus non-neuronal expression. In this study, we made the first foray into addressing this knowledge gap by characterizing the distribution of IT channel subunits in the BNSTALG and then examining cell specific expression patterns. Previous studies from our lab revealed that Type II neurons have a robust IT current, whereas Type I and III neurons appear to lack IT. We also reported that the IT current in Type II neurons was completely blocked by 500 μM nickel, attenuated by 10 μM mibefridil, and had a time constant of decay of approximately 20 mS (Hammack et al., 2007). Consistent with these observations, in the present study we show that Type II cells predominantly express mRNA transcripts for Cav3.1 (91%), which has a time constant of decay of ~11ms, and an IC50 for nickel of 250 μM (Klockner et al., 1999). Surprisingly, several Type III neurons were shown to express Cav3.3. It is not immediately apparent why no IT current is observed in Type III neurons, however post-translational modification may prevent the functional expression of mature peptide in these neurons.
IA
All three subtypes of BNSTALG neuron possess an IA current, suggesting that a common gene profile may be found in BNST neurons. Several genes encoding KV channel subunits give rise to IA currents, and these include Kv1.4, Kv3.4, Kv4.1, 4.2, and 4.3. However, in situ hybridization studies have reported low Kv1.4 expression in the lateral BNST (Lujan et al., 2003), and no Kv3.4 mRNA (Weiser et al., 1994). These observations were somewhat surprising since Kv1.4 and Kv3.4 subunits have been reported to be preferentially localized in axons where they are thought to regulate transmitter release (Vacher et al., 2008). Interestingly, the current study revealed that both Type I and Type III neurons express Kv3.4 mRNA transcripts, whereas Type II neurons appear to express Kv1.4 transcripts. Hence, release of neurotransmitter from Type II neurons may be differentially modulated compared to Type I and III neurons. Not only is the inactivation voltage of Kv1.4 channels (Vh= −62mV) more negative than that of Kv3.4 channel (Vh= −53mV), these channels also show a greater sensitivity to blockade by 4-aminopyridine (4-AP; ~10μM –vs- 300 μM). Moreover, the activity of Kv1.4 channels is thought to be tightly regulated by the activity of CaMKII and calcineurin. Significantly, calcineurin mRNA transcripts are almost exclusively found in Type II BNST neurons (Hazra and Rainnie, unpublished observation).
Kv4.1 - Kv4.3 transcripts are also reported to be differential distribution of throughout the brain (Serodio and Rudy, 1998). These authors reported that Kv4.1 expression in the CNS was very low compared with that of Kv4.2 and Kv4.3. The latter two transcripts were also shown to be differentially distributed, such that Kv4.2 was highly expressed in the caudate-putamen, hippocampus, reticular pontine nucleus, and several nuclei in the medulla, whereas Kv4.3 was expressed in the substantia nigra pars compacta, superior colliculus, Raphé nuclei and the amygdala. In the present study, we have shown that all four transcripts of Kv4 family mRNA are expressed in the BNSTALG, however, our scRT-PCR experiments suggest that Kv4.1 transcripts may be preferentially expressed in glia or schwann cells. Interestingly, Kv4.2 and Kv4.3 transcripts were expressed in most BNSTALG neurons.
Significantly, Kv4 proteins are believed to be somatodendritic IA channels, where they are reported to play an important role in regulating dendritic excitability, back propagation of action potentials, integration of excitatory postsynaptic potentials (Hoffman et al., 1997; Ramakers and Storm, 2002), repetitive firing properties (Connor and Stevens, 1971) and action potential duration (for review see (Birnbaum et al., 2004). Our preliminary electron microscopic studies have shown that Kv4.2 is also localized in somatodendritic compartment of BNSTALG neurons (Rainnie et al., unpublished observation). Consistent with these observations, we reported that the IA current of BNSTALG neurons has a dual exponential decay, with fast- and slow time constants (tau) of 17ms and 183 ms, respectively. Moreover, the IA current was relatively insensitive to exogenous 4-aminopyridine (4-AP) application, with a significant block only occurring at concentrations > 5mM 4-AP (Hammack et al., 2007). It is notable, therefore, that a characteristic feature of the Kv4 family of IA channels is their relative insensitivity to exogenous 4-AP (~ 5 – 9 mM) (Pak et al., 1991; Tseng et al., 1996) compared to Kv1.4 which is sensitive to low micromolar (~ 10 μM) concentrations (Stuhmer et al., 1989). In addition, Kv4.2 and 4.3 are reported to have multiple time constants of inactivation ranging from 15 ms to 370 ms depending on their assembly with chaperone proteins (Birnbaum et al., 2004). Together these data strongly suggest that the Kv4 family of IA channel subunits is the principal mediators of the somatic IA current in BNSTALG neurons.
IK(IR)
IK(IR) play a pivotal role in the maintenance of the resting membrane potential as well as in the regulation of action potential duration (for a review, see (Nichols and Lopatin, 1997). To date, of the seven subfamilies of Kir channel that have been identified (Kir1- Kir7) based on their rectification properties and their regulation by intracellular messengers (Stanfield et al., 1994; Hibino et al., 2010) only Kir 2.0 channels are constitutively active with apparent time-dependent gating and strong inward rectification (Ishihara and Hiraoka, 1994; Stanfield et al., 1994). Moreover, the four isoforms of the Kir2 family of channels (Kir2.1 – Kir 2.4) are differentially distributed throughout the brain (Pruss et al., 2005). Hence, Kir2.1 is primarily expressed in the olfactory bulb, superior colliculus, neocortex, hippocampus, caudate putamen, and amygdala; Kir2.2 is extensively expressed in thalamic nuclei, brainstem, hypothamalus, basal ganglia and hippocampus; Kir2.3 is expressed in the olfactory bulb, basal ganglia, cortex and cerebellar purkinje cells; and Kir2.4 is almost exclusively expressed in brainstem motorneurons. In situ hybridization studies have also shown a differential expression of Kir2 channel mRNAs in the BNST (Pruss et al., 2005). Here, the expression of Kir2.1 mRNA was reported to be weak, whereas Kir2.2 and Kir2.3 mRNA are strongly expressed, and there is no detectable expression of Kir2.4 mRNA. In the present study, we show that all BNSTALG neurons express at least one member of the Kir2 family of subunits, but only Type III neurons show robust mRNA expression for three channels; Kir2.3 (72%), Kir2.2 (64%) and Kir 2.1 (45%). Kir 2 channels are highly sensitive to blockade by extracellular barium (Day et al., 2005), and we have shown that barium induces a membrane depolarization and an increase in input resistance in BNSTALG neurons (Hammack et al., 2007), suggesting that one or more Kir2 family of channels are functionally expressed in BNSTALG neurons, and in particular Type III neurons. A similar barium-sensitive rectifying current has been reported in mouse frontal projection neurons that also express Kir2.3, Kir2.2 and Kir2.1 mRNA (Day et al., 2005).
Significance of diverse ion channel expression and modulation by neurotransmitters
Previous studies have shown that the activity of BNST neurons could be modulated by local release of neurotransmitters that are critically involved in stress, anxiety, and drug addiction, including norepinephrine (NE), dopamine (DA) and serotonin (5-HT) (Egli et al., 2005; Francesconi et al., 2009; Levita et al., 2004; Hammack et al., 2009). Hence, in the ventral BNST, increased NE release is thought to contribute to anxiety states elicited during protracted drug withdrawal (Aston-Jones and Harris, 2004). Our own studies have shown that local 5-HT release can bi-directionally regulate the excitability of BNSTALG neurons, such that 5-HT1A receptor activation functionally inhibits BNST neurons, whereas activation of 5-HT2A/2C/7 receptors increases the excitability of these same neurons (Guo et al., 2009). Significantly, microinjection of 5-HT1A receptor agonists into the BNST elicits an anxiolytic response in freely moving rats (Levita et al., 2004) and we have shown that this response can be attenuated by stress, which also increases the expression of 5-HT7 receptor mRNA (Hammack et al., 2009).
Elsewhere in the brain these same neurotransmitter systems have been reported to directly modulate the activity of Ih, IT, IA and IK(IR) channels, and we predict that neurotransmitter-induced modulation of ion channel activity will also occur in the BNST. For example, in rat dorsal root ganglion neurons activation of 5-HT7 receptors mediates an increase in Ih (Cardenas et al., 1999). Similarly, 5-HT7 receptor activation in neurons of the glomerulus enhances calcium influx through IT channels (Lenglet et al., 2002). Conversely, 5-HT2A receptor activation results in suppression of rhythmic firing activity in olivary neurons via the inhibition of IT (Placantonakis et al., 2000). It is possible that the opposing actions of 5-HT receptor activation on IT function result from coupling to distinct IT channel subunits. Previously, we reported that Type I and II neurons express 5-HT7 receptors, but not Type III neurons (Hammack et al., 2009). As shown in Table 3, all BNST neurons express the Cav3.3 IT channel subunit but only Type II neurons co-express the Cav3.1 IT channel subunit. If 5-HT7 receptors were to exclusively couple to the Cav3.1 IT channel subunit this would confer a mechanism by which 5-HT7 receptor activation in the BNST could selectively modulate the activity of Type II neurons. Moreover, by using a molecular dissection approach we have identified several cell-specific expression patterns for the ion channel subunits, which can now be targeted for genetic manipulation by viral vectors expressing either dominant negative subunit constructs or siRNA (Jasnow et al., 2009). Moreover, we are using this same approach to map neuropeptide expression in BNSTALG neurons, and we will look for any cross-correlation between neuropeptide expression and ion channel subunit expression patterns.
Mapping neuropeptide expression to genetic phenotype may be particularly informative with respect to Type II neurons. We have shown that three subpopulations of Type II neurons can be differentiated based on their transcriptome profiles. As illustrated in Figure 1, we primarily sampled neurons from the BNSTov, an area that expresses a diverse array of neuropeptides including corticotropin releasing factor (CRF), somatostatin, enkephalin, and neuropeptide Y (NPY; Walter et al., 1991; Swanson et al., 1989). Intriguingly, neuropeptides such as CRF and NPY are reported to have opposing actions on synaptic transmission (Kash & Winder, 2006), and anxiety-like behavior in response to stress (Nijsen et al., 2001; Ciccocioppo et al., 2003). We are currently investigating the possibility that the three transcriptome profiles may represent discrete markers for distinct subpopulations of peptidergic neurons in the BNSTALG.
Recently we have developed a transgenic mouse line in which the expression of a green fluorescent protein (GFP) is driven by the promoter for corticotrophin releasing factor (Martin et al., 2010). These mice express GFP exclusively in the CRF-containing neurons of the BNSTALG and central nucleus of the amygdala (CeA), as well as in the paraventricular nucleus of the hypothalamus (PVN). The CRF-GFP neurons of the BNSTALG share many electrophysiological characteristics with Type III neurons of the rat BNST and we have studies in progress to compare and contrast the molecular phenotypes of these two cell populations. Finally, the identification of distinctive electrophysiological and molecular features for Type I-III BNSTALG neurons will help to uncover their respective role(s) in the complex physiological and pathophysiological process in which they are involved, including anxiety and post-traumatic stress disorder.
Acknowledgments
This work was supported by National Institute of Mental Health (MH072908) to DGR, and Center for Behavioral Neuroscience STC Center: NSF Agmt #IBN-9876754, National Primate Research Center base grant #RR-00165, Animal Resource Program at NIH.
Footnotes
Publisher's Disclaimer: This is a PDF file of an unedited manuscript that has been accepted for publication. As a service to our customers we are providing this early version of the manuscript. The manuscript will undergo copyediting, typesetting, and review of the resulting proof before it is published in its final citable form. Please note that during the production process errors may be discovered which could affect the content, and all legal disclaimers that apply to the journal pertain.
References
- Akaike N, Kostyuk PG, Osipchuk YV. Dihydropyridine-sensitive low-threshold calcium channels in isolated rat hypothalamic neurones. J Physiol. 1989;412:181–195. doi: 10.1113/jphysiol.1989.sp017610. [DOI] [PMC free article] [PubMed] [Google Scholar]
- Altomare C, Terragni B, Brioschi C, Milanesi R, Pagliuca C, Viscomi C, Moroni A, Baruscotti M, DiFrancesco D. Heteromeric HCN1-HCN4 channels: a comparison with native pacemaker channels from the rabbit sinoatrial node. J Physiol. 2003;549(Pt 2):347–359. doi: 10.1113/jphysiol.2002.027698. [DOI] [PMC free article] [PubMed] [Google Scholar]
- Aston-Jones G, Harris GC. Brain substrates for increased drug seeking during protracted withdrawal. Neuropharmacology. 2004;47(Suppl 1):167–179. doi: 10.1016/j.neuropharm.2004.06.020. [DOI] [PubMed] [Google Scholar]
- Birnbaum SG, Varga AW, Yuan LL, Anderson AE, Sweatt JD, Schrader LA. Structure and function of Kv4-family transient potassium channels. Physiol Rev. 2004;84(3):803–833. doi: 10.1152/physrev.00039.2003. [DOI] [PubMed] [Google Scholar]
- Cardenas CG, Mar LP, Vysokanov AV, Arnold PB, Cardenas LM, Surmeier DJ, Scroggs RS. Serotonergic modulation of hyperpolarization-activated current in acutely isolated rat dorsal root ganglion neurons. J Physiol. 1999;518 ( Pt 2):507–523. doi: 10.1111/j.1469-7793.1999.0507p.x. [DOI] [PMC free article] [PubMed] [Google Scholar]
- Casada JH, Dafny N. Restraint and stimulation of bed nucleus of the stria terminalis produce similar stress-like behaviors. Brain Res Bull. 1991;27(2):207–212. doi: 10.1016/0361-9230(91)90069-v. [DOI] [PubMed] [Google Scholar]
- Casada JH, Dafny N. Responses of neurons in bed nucleus of the stria terminalis to microiontophoretically applied morphine, norepinephrine and acetylcholine. Neuropharmacology. 1993;32(3):279–284. doi: 10.1016/0028-3908(93)90112-g. [DOI] [PubMed] [Google Scholar]
- Chatterjee O, Taylor LA, Ahmed S, Nagaraj S, Hall JJ, Finckbeiner SM, Chan PS, Suda N, King JT, Zeeman ML, McCoob DP. Social stress alters expression of large conductance calcium- activated potassium channel subunits in mouse adrenal medulla and pituitary galnds. J Neuroendocrinol. 2009;21(3):167–176. doi: 10.1111/j.1365-2826.2009.01823.x. [DOI] [PubMed] [Google Scholar]
- Ciccocioppo R, Fedeli A, Economidou D, Policani F, Weiss F, Massi M. The bed nucleus is a neuroanatomical substrate for the anorectic effect of corticotropin releasing factor and for its reversal by nociceptin/ orphanin FQ. J Neurosci. 2003;23(28):9445–9451. doi: 10.1523/JNEUROSCI.23-28-09445.2003. [DOI] [PMC free article] [PubMed] [Google Scholar]
- Coetzee WA, Amarillo Y, Chiu J, Chow A, Lau D, McCormack T, Moreno H, Nadal MS, Ozaita A, Pountney D, et al. Molecular diversity of K+ channels. Ann N Y Acad Sci. 1999;868:233–285. doi: 10.1111/j.1749-6632.1999.tb11293.x. [DOI] [PubMed] [Google Scholar]
- Connor JA, Stevens CF. Prediction of repetitive firing behaviour from voltage clamp data on an isolated neurone soma. J Physiol. 1971;213(1):31–53. doi: 10.1113/jphysiol.1971.sp009366. [DOI] [PMC free article] [PubMed] [Google Scholar]
- Cullinan WE, Herman JP, Watson SJ. Ventral subicular interaction with the hypothalamic paraventricular nucleus: evidence for a relay in the bed nucleus of the stria terminalis. J Comp Neurol. 1993;332(1):1–20. doi: 10.1002/cne.903320102. [DOI] [PubMed] [Google Scholar]
- Dalsass M, Siegel A. Opioid peptide regulation of neurons in the bed nucleus of the stria terminalis: a microiontophoretic study. Brain Res. 1990;531(1–2):346–349. doi: 10.1016/0006-8993(90)90799-h. [DOI] [PubMed] [Google Scholar]
- Day HE, Masini CV, Campeau S. The pattern of brain c-fos mRNA induced by a component of fox odor, 2,5-dihydro-2,4,5-trimethylthiazoline (TMT), in rats, suggests both systemic and processive stress characteristics. Brain Res. 2004;1025(1–2):139–151. doi: 10.1016/j.brainres.2004.07.079. [DOI] [PubMed] [Google Scholar]
- Day M, Carr DB, Ulrich S, Ilijic E, Tkatch T, Surmeier DJ. Dendritic excitability of mouse frontal cortex pyramidal neurons is shaped by the interaction among HCN, Kir2, and Kleak channels. J Neurosci. 2005;25(38):8776–8787. doi: 10.1523/JNEUROSCI.2650-05.2005. [DOI] [PMC free article] [PubMed] [Google Scholar]
- Dong HW, Swanson LW. Projections from bed nuclei of the stria terminalis, posterior division: implications for cerebral hemisphere regulation of defensive and reproductive behaviors. J Comp Neurol. 2004;471(4):396–433. doi: 10.1002/cne.20002. [DOI] [PubMed] [Google Scholar]
- Egli RE, Kash TL, Choo K, Savchenko V, Matthews RT, Blakely RD, Winder DG. Norepinephrine modulates glutamatergic transmission in the bed nucleus of the stria terminalis. Neuropsychopharmacology. 2005;30(4):657–668. doi: 10.1038/sj.npp.1300639. [DOI] [PubMed] [Google Scholar]
- Erb S, Stewart J. A role for the bed nucleus of the stria terminalis, but not the amygdala, in the effects of corticotropin-releasing factor on stress-induced reinstatement of cocaine seeking. Journal of Neuroscience. 1999;19(20):RC35. doi: 10.1523/JNEUROSCI.19-20-j0006.1999. [DOI] [PMC free article] [PubMed] [Google Scholar]
- Fendt M, Endres T, Apfelbach R. Temporary inactivation of the bed nucleus of the stria terminalis but not of the amygdala blocks freezing induced by trimethylthiazoline, a component of fox feces. J Neurosci. 2003;23(1):23–28. doi: 10.1523/JNEUROSCI.23-01-00023.2003. [DOI] [PMC free article] [PubMed] [Google Scholar]
- Franscrsconi W, Berton F, Repunte-Canonigo V, Hagihara K, Thurborn D, Lekic D, Specio SE, Greenwell TN, Chen SA, Rice KC, Richardson HN, O'Dell LE, Zorrilla EP, Morales M, Koob GF, Sanna PP. Protracted withdrawl from alcohol and drugs of abuse impairs long- term potentiation of intrinsic excitability in the juxtacapsular bed nucleus of the stria terminalis. J Neurosci. 2009;29(17):5389–5401. doi: 10.1523/JNEUROSCI.5129-08.2009. [DOI] [PMC free article] [PubMed] [Google Scholar]
- Gauss R, Seifert R. Pacemaker oscillations in heart and brain: a key role for hyperpolarization- activated cation channels. Chronobiol Int. 2000;17(4):453–469. doi: 10.1081/cbi-100101057. [DOI] [PubMed] [Google Scholar]
- Guo JD, Rainnie DG. Presynaptic 5-HT1B receptors-mediated serotonergic inhibition of glutamate transmission in the bed nucleus of stria terminalis. Neuroscience. 2010;165(4):1390–401. doi: 10.1016/j.neuroscience.2009.11.071. [DOI] [PMC free article] [PubMed] [Google Scholar]
- Guo JD, Hammack SE, Hazra R, Levita L, Rainnie DG. Bi-directional modulation of bed nucleus of stria terminalis neurons by 5-HT: molecular expression and functional properties of excitatory 5-HT receptor subtypes. Neuroscience. 2009;164(4):1776–1793. doi: 10.1016/j.neuroscience.2009.09.028. [DOI] [PMC free article] [PubMed] [Google Scholar]
- Halabisky B, Shen F, Huguenard JR, Prince DA. Electrophysiological classification of somatostatin-positive interneurons in mouse sensorimotor cortex. J Neurophysiol. 2006;96(2):834–845. doi: 10.1152/jn.01079.2005. [DOI] [PubMed] [Google Scholar]
- Hammack SE, Guo J, Hazra R, Dabrowska J, Myers KM, Rainnie DG. The response of neurons in the bed nucleus of the stria terminalis to serotonin: Implications for anxiety. Progress in Neuro-Psychopharmacology and Biological Psychiatry. 2009;33 (8):1309–1320. doi: 10.1016/j.pnpbp.2009.05.013. [DOI] [PMC free article] [PubMed] [Google Scholar]
- Hammack SE, Mania I, Rainnie DG. Differential expression of intrinsic membrane currents in defined cell types of the anterolateral bed nucleus of the stria terminalis. J Neurophysiol. 2007;98(2):638–656. doi: 10.1152/jn.00382.2007. [DOI] [PubMed] [Google Scholar]
- Hammack SE, Richey KJ, Watkins LR, Maier SF. Chemical lesion of the bed nucleus of the stria terminalis blocks the behavioral consequences of uncontrollable stress. Behavioral Neuroscience. 2004;118(2):443–448. doi: 10.1037/0735-7044.118.2.443. [DOI] [PubMed] [Google Scholar]
- Hariri AR, Holmes A. Genetics of emotional regulation: the role of the serotonin transporter in neural function. Trends Cogn Sci. 2006;10(4):182–191. doi: 10.1016/j.tics.2006.02.011. [DOI] [PubMed] [Google Scholar]
- Hibino H, Inanobe A, Furutani K, Murakami S, Findlay I, Kurachi Y. Inwardly rectifying potassium channels: their structure, function, and physiological roles. Physiol Rev. 2010;90(1):291–366. doi: 10.1152/physrev.00021.2009. [DOI] [PubMed] [Google Scholar]
- Hjaeresen ML, Hagemen I, Wortwein G, Plenge P, Jorgensen MB. Chronic electroconvulsive stimulation but not chronic restraint stress modulates mRNA expression of voltage dependent potassium channels Kv7.2 and Kv11.1 in the rat piriform cortex. Brain Res. 2008;1217:79–184. doi: 10.1016/j.brainres.2007.09.071. [DOI] [PubMed] [Google Scholar]
- Hoehn K, Watson TW, MacVicar BA. Multiple types of calcium channels in acutely isolated rat neostriatal neurons. J Neurosci. 1993;13(3):1244–1257. doi: 10.1523/JNEUROSCI.13-03-01244.1993. [DOI] [PMC free article] [PubMed] [Google Scholar]
- Hoffman DA, Magee JC, Colbert CM, Johnston D. K+ channel regulation of signal propagation in dendrites of hippocampal pyramidal neurons. Nature. 1997;387(6636):869–875. doi: 10.1038/43119. [DOI] [PubMed] [Google Scholar]
- Huguenard JR, McCormick DA. Simulation of the currents involved in rhythmic oscillations in thalamic relay neurons. J Neurophysiol. 1992;68(4):1373–1383. doi: 10.1152/jn.1992.68.4.1373. [DOI] [PubMed] [Google Scholar]
- Huguenard JR, Prince DA. A novel T-type current underlies prolonged Ca(2+)-dependent burst firing in GABAergic neurons of rat thalamic reticular nucleus. J Neurosci. 1992;12(10):3804–3817. doi: 10.1523/JNEUROSCI.12-10-03804.1992. [DOI] [PMC free article] [PubMed] [Google Scholar]
- Ingram CD, Cutler KL, Wakerley JB. Oxytocin excites neurones in the bed nucleus of the stria terminalis of the lactating rat in vitro. Brain Res. 1990;527(1):167–170. doi: 10.1016/0006-8993(90)91078-u. [DOI] [PubMed] [Google Scholar]
- Ishihara K, Hiraoka M. Gating mechanism of the cloned inward rectifier potassium channel from mouse heart. J Membr Biol. 1994;142(1):55–64. doi: 10.1007/BF00233383. [DOI] [PubMed] [Google Scholar]
- Jasnow AM, Ressler KJ, Hammack SE, Chhatwal JP, Rainnie DG. Distinct subtypes of cholecystokinin (CCK)-containing interneurons of the basolateral amygdala identified using a CCK promoter-specific lentivirus. J Neurophysiol. 2009;101(3):1494–1506. doi: 10.1152/jn.91149.2008. [DOI] [PMC free article] [PubMed] [Google Scholar]
- Ju G, Swanson LW. Studies on the cellular architecture of the bed nuclei of the stria terminalis in the rat: I. Cytoarchitecture. J Comp Neurol. 1989;280(4):587–602. doi: 10.1002/cne.902800409. [DOI] [PubMed] [Google Scholar]
- Kaneda M, Akaike N. The low-threshold Ca current in isolated amygdaloid neurons in the rat. Brain Res. 1989;497(1):187–190. doi: 10.1016/0006-8993(89)90987-6. [DOI] [PubMed] [Google Scholar]
- Kaneda M, Wakamori M, Ito C, Akaike N. Low-threshold calcium current in isolated Purkinje cell bodies of rat cerebellum. J Neurophysiol. 1990;63(5):1046–1051. doi: 10.1152/jn.1990.63.5.1046. [DOI] [PubMed] [Google Scholar]
- Kash TL, Winder DG. Neuropeptide Y and corticotropin-releasing factor bi- directionally modulate inhibitory synaptic transmission in the bed nucleus of the stria terminalis. Neuropharmacology. 2006;51(5):1013–1022. doi: 10.1016/j.neuropharm.2006.06.011. [DOI] [PubMed] [Google Scholar]
- Kaupp UB, Seifert R. Molecular diversity of pacemaker ion channels. Annu Rev Physiol. 2001;63:235–257. doi: 10.1146/annurev.physiol.63.1.235. [DOI] [PubMed] [Google Scholar]
- Klockner U, Lee JH, Cribbs LL, Daud A, Hescheler J, Pereverzev A, Perez-Reyes E, Schneider T. Comparison of the Ca2 + currents induced by expression of three cloned alpha1 subunits, alpha1G, alpha1H and alpha1I, of low-voltage-activated T-type Ca2 + channels. Eur J Neurosci. 1999;11(12):4171–4178. doi: 10.1046/j.1460-9568.1999.00849.x. [DOI] [PubMed] [Google Scholar]
- Kurimoto K, Yabuta Y, Ohinata Y, Ono Y, Uno KD, Yamada RG, Ueda HR, Saitou M. An improved single-cell cDNA amplification method for efficient high-density oligonucleotide microarray analysis. Nucleic Acids Res. 2006;34(5):e42. doi: 10.1093/nar/gkl050. [DOI] [PMC free article] [PubMed] [Google Scholar]
- Lee YL, Davis M. Role of the hippocampus, the bed nucleus of the stria terminalis, and the amygdala in the excitatory effect of corticotropin-releasing hormone on the acoustic startle reflex. Journal of Neuroscience. 1997;17(16):6434–6446. doi: 10.1523/JNEUROSCI.17-16-06434.1997. [DOI] [PMC free article] [PubMed] [Google Scholar]
- Lenglet S, Louiset E, Delarue C, Vaudry H, Contesse V. Activation of 5-HT(7) receptor in rat glomerulosa cells is associated with an increase in adenylyl cyclase activity and calcium influx through T-type calcium channels. Endocrinology. 2002;143(5):1748–1760. doi: 10.1210/endo.143.5.8817. [DOI] [PubMed] [Google Scholar]
- Levita L, Hammack SE, Mania I, Li XY, Davis M, Rainnie DG. 5-hydroxytryptamine1A- like receptor activation in the bed nucleus of the stria terminalis: electrophysiological and behavioral studies. Neuroscience. 2004;128(3):583–596. doi: 10.1016/j.neuroscience.2004.06.037. [DOI] [PubMed] [Google Scholar]
- Ludwig A, Zong X, Jeglitsch M, Hofmann F, Biel M. A family of hyperpolarization-activated mammalian cation channels. Nature. 1998;393(6685):587–591. doi: 10.1038/31255. [DOI] [PubMed] [Google Scholar]
- Lujan R, de Cabo de la Vega C, Dominguez del Toro E, Ballesta JJ, Criado M, Juiz JM. Immunohistochemical localization of the voltage-gated potassium channel subunit Kv1.4 in the central nervous system of the adult rat. J Chem Neuroanat. 2003;26(3):209–224. doi: 10.1016/j.jchemneu.2003.07.006. [DOI] [PubMed] [Google Scholar]
- Magistretti J, de Curtis M. Low-voltage activated T-type calcium currents are differently expressed in superficial and deep layers of guinea pig piriform cortex. J Neurophysiol. 1998;79(2):808–816. doi: 10.1152/jn.1998.79.2.808. [DOI] [PubMed] [Google Scholar]
- Martin EI, Ressler KJ, Jasnow AM, Dabrowska J, Hazra R, Rainnie DG, Nemeroff CB, Owens MJ. A Novel Transgenic Mouse for Gene-Targeting Within Cells That Express Corticotropin- Releasing Factor. Biol Psychiatry. 2010;67 (12):1212–1216. doi: 10.1016/j.biopsych.2010.01.026. [DOI] [PMC free article] [PubMed] [Google Scholar]
- McDonald AJ. Neurons of the bed nucleus of the stria terminalis: a golgi study in the rat. Brain Res Bull. 1983;10(1):111–120. doi: 10.1016/0361-9230(83)90082-5. [DOI] [PubMed] [Google Scholar]
- Mistrik P, Mader R, Michalakis S, Weidinger M, Pfeifer A, Biel M. The murine HCN3 gene encodes a hyperpolarization-activated cation channel with slow kinetics and unique response to cyclic nucleotides. J Biol Chem. 2005;280(29):27056–27061. doi: 10.1074/jbc.M502696200. [DOI] [PubMed] [Google Scholar]
- Monteggia LM, Eisch AJ, Tang MD, Kaczmarek LK, Nestler EJ. Cloning and localization of the hyperpolarization-activated cyclic nucleotide-gated channel family in rat brain. Brain Res Mol Brain Res. 2000;81(1–2):129–139. doi: 10.1016/s0169-328x(00)00155-8. [DOI] [PubMed] [Google Scholar]
- Nichols CG, Lopatin AN. Inward rectifier potassium channels. Annu Rev Physiol. 1997;59:171–191. doi: 10.1146/annurev.physiol.59.1.171. [DOI] [PubMed] [Google Scholar]
- Nijsen MJ, Croiset G, Diamant M, De Weid D, Wiegant VM. CRH signalling in the bed nucleus of the stria terminalis is involved in stress-induced cardiac vagal activation in conscious rats. Neuropsychopharmacology. 2001;24(1):1–10. doi: 10.1016/S0893-133X(00)00167-6. [DOI] [PubMed] [Google Scholar]
- Oler JA, Fox AS, Shelton SE, Christian BT, Murali D, Oakes TR, Davidson RJ, Kalin NH. Serotonin transporter availability in the amygdala and the bed nucleus of the stria terminalis predicts anxious temperament and brain glucose metabolic activity. Journal of Neuroscience. 2009;29(32):9961–9966. doi: 10.1523/JNEUROSCI.0795-09.2009. [DOI] [PMC free article] [PubMed] [Google Scholar]
- Pak MD, Baker K, Covarrubias M, Butler A, Ratcliffe A, Salkoff L. mShal, a subfamily of A- type K+ channel cloned from mammalian brain. Proc Natl Acad Sci U S A. 1991;88(10):4386–4390. doi: 10.1073/pnas.88.10.4386. [DOI] [PMC free article] [PubMed] [Google Scholar]
- Perez-Reyes E. Three for T: molecular analysis of the low voltage-activated calcium channel family. Cell Mol Life Sci. 1999;56(7–8):660–669. doi: 10.1007/s000180050460. [DOI] [PMC free article] [PubMed] [Google Scholar]
- Perez-Reyes E. Molecular physiology of low-voltage-activated t-type calcium channels. Physiol Rev. 2003;83(1):117–161. doi: 10.1152/physrev.00018.2002. [DOI] [PubMed] [Google Scholar]
- Placantonakis DG, Schwarz C, Welsh JP. Serotonin suppresses subthreshold and suprathreshold oscillatory activity of rat inferior olivary neurones in vitro. J Physiol. 2000;524(Pt 3):833–851. doi: 10.1111/j.1469-7793.2000.00833.x. [DOI] [PMC free article] [PubMed] [Google Scholar]
- Pruss H, Derst C, Lommel R, Veh RW. Differential distribution of individual subunits of strongly inwardly rectifying potassium channels (Kir2 family) in rat brain. Brain Res Mol Brain Res. 2005;139(1):63–79. doi: 10.1016/j.molbrainres.2005.05.006. [DOI] [PubMed] [Google Scholar]
- Rainnie DG. Neurons of the bed nucleus of the stria terminalis (BNST). Electrophysiological properties and their response to serotonin. Ann N Y Acad Sci. 1999;877:695–699. doi: 10.1111/j.1749-6632.1999.tb09304.x. [DOI] [PubMed] [Google Scholar]
- Ramakers GM, Storm JF. A postsynaptic transient K(+) current modulated by arachidonic acid regulates synaptic integration and threshold for LTP induction in hippocampal pyramidal cells. Proc Natl Acad Sci U S A. 2002;99(15):10144–10149. doi: 10.1073/pnas.152620399. [DOI] [PMC free article] [PubMed] [Google Scholar]
- Robinson RB, Siegelbaum SA. Hyperpolarization-activated cation currents: from molecules to physiological function. Annu Rev Physiol. 2003;65:453–480. doi: 10.1146/annurev.physiol.65.092101.142734. [DOI] [PubMed] [Google Scholar]
- Santoro B, Chen S, Luthi A, Pavlidis P, Shumyatsky GP, Tibbs GR, Siegelbaum SA. Molecular and functional heterogeneity of hyperpolarization-activated pacemaker channels in the mouse CNS. J Neurosci. 2000;20(14):5264–5275. doi: 10.1523/JNEUROSCI.20-14-05264.2000. [DOI] [PMC free article] [PubMed] [Google Scholar]
- Santoro B, Tibbs GR. The HCN gene family: molecular basis of the hyperpolarization-activated pacemaker channels. Ann N Y Acad Sci. 1999;868:741–764. doi: 10.1111/j.1749-6632.1999.tb11353.x. [DOI] [PubMed] [Google Scholar]
- Sayer RJ, Brown AM, Schwindt PC, Crill WE. Calcium currents in acutely isolated human neocortical neurons. J Neurophysiol. 1993;69(5):1596–1606. doi: 10.1152/jn.1993.69.5.1596. [DOI] [PubMed] [Google Scholar]
- Serodio P, Rudy B. Differential expression of Kv4 K+ channel subunits mediating subthreshold transient K+ (A-type) currents in rat brain. J Neurophysiol. 1998;79(2):1081–1091. doi: 10.1152/jn.1998.79.2.1081. [DOI] [PubMed] [Google Scholar]
- Serodio P, Vega-Saenz de Miera E, Rudy B. Cloning of a novel component of A-type K+ channels operating at subthreshold potentials with unique expression in heart and brain. J Neurophysiol. 1996;75(5):2174–2179. doi: 10.1152/jn.1996.75.5.2174. [DOI] [PubMed] [Google Scholar]
- Shalev U, Morales M, Hope B, Yap J. Time-dependent changes in extinction behavior and stress- induced reinstatement of drug seeking following withdrawl from heroin in rats. Psychopharmacology. 2001;156(1):98–107. doi: 10.1007/s002130100748. [DOI] [PubMed] [Google Scholar]
- Singewald N, Salchner P, Sharp T. Induction of c-Fos expression in specific areas of the fear circuitry in rat forebrain by anxiogenic drugs. Biological Psychiatry. 2003;53(4):275–283. doi: 10.1016/s0006-3223(02)01574-3. [DOI] [PubMed] [Google Scholar]
- Song WJ. Genes responsible for native depolarization-activated K+ currents in neurons. Neurosci Res. 2002;42(1):7–14. doi: 10.1016/s0168-0102(01)00305-4. [DOI] [PubMed] [Google Scholar]
- Sosulina L, Meis S, Seifert G, Steinhauser C, Pape HC. Classification of projection neurons and interneurons in the rat lateral amygdala based upon cluster analysis. Mol Cell Neurosci. 2006;33(1):57–67. doi: 10.1016/j.mcn.2006.06.005. [DOI] [PubMed] [Google Scholar]
- Stanfield PR, Davies NW, Shelton PA, Khan IA, Brammar WJ, Standen NB, Conley EC. The intrinsic gating of inward rectifier K+ channels expressed from the murine IRK1 gene depends on voltage, K+ and Mg2+ J Physiol. 1994;475(1):1–7. doi: 10.1113/jphysiol.1994.sp020044. [DOI] [PMC free article] [PubMed] [Google Scholar]
- Stuhmer W, Ruppersberg JP, Schroter KH, Sakmann B, Stocker M, Giese KP, Perschke A, Baumann A, Pongs O. Molecular basis of functional diversity of voltage-gated potassium channels in mammalian brain. EMBO J. 1989;8(11):3235–3244. doi: 10.1002/j.1460-2075.1989.tb08483.x. [DOI] [PMC free article] [PubMed] [Google Scholar]
- Sun N, Cassell MD. Intrinsic GABAergic neurons in the rat central extended amygdala. J Comp Neurol. 1993;330(3):381–404. doi: 10.1002/cne.903300308. [DOI] [PubMed] [Google Scholar]
- Swanson LW, Simmons DM. Differential steriod hormone and neural influences on peptide mRNA levels in CRH cells of the paraventricular nucleus: a hybridization histochemical study in the rat. J Comp Neurol. 1989;285(4):413–435. doi: 10.1002/cne.902850402. [DOI] [PubMed] [Google Scholar]
- Talley EM, Cribbs LL, Lee JH, Daud A, Perez-Reyes E, Bayliss DA. Differential distribution of three members of a gene family encoding low voltage-activated (T-type) calcium channels. J Neurosci. 1999;19(6):1895–1911. doi: 10.1523/JNEUROSCI.19-06-01895.1999. [DOI] [PMC free article] [PubMed] [Google Scholar]
- Tseng GN, Jiang M, Yao JA. Reverse use dependence of Kv4.2 blockade by 4-aminopyridine. J Pharmacol Exp Ther. 1996;279(2):865–876. [PubMed] [Google Scholar]
- Vacher H, Mohapatra DP, Trimmer JS. Localization and targeting of voltage-dependent ion channels in mammalian central neurons. Physiol Rev. 2008;88(4):1407–1447. doi: 10.1152/physrev.00002.2008. [DOI] [PMC free article] [PubMed] [Google Scholar]
- van Germert NG, Carvalho DM, Karst H, van der Laan S, Zhang M, Meijer OC, Hell JW, Joels M. Dissociation between rat hippocampal CA1 and dentate gyrus cells in their response to corticosterone: effects on calcium channel protein and current. Endocrinology. 2009;150(10):4615–4624. doi: 10.1210/en.2009-0525. [DOI] [PMC free article] [PubMed] [Google Scholar]
- Waddell J, Morris RW, Bouton ME. Effects of bed nucleus of the stria terminalis lesions on conditioned anxiety: aversive conditioning with long-duration conditional stimuli and reinstatement of extinguished fear. Behavioral Neuroscience. 2006;120(2):324–336. doi: 10.1037/0735-7044.120.2.324. [DOI] [PubMed] [Google Scholar]
- Walker DL, Toufexis DJ, Davis M. Role of the bed nucleus of the stria terminalis versus the amygdala in fear, stress, and anxiety. Eur J Pharmacol. 2003;463(1–3):199–216. doi: 10.1016/s0014-2999(03)01282-2. [DOI] [PubMed] [Google Scholar]
- Walter A, Mai JK, Lanta L, Gorcs T. Differential distribution of immunohistochemical markers in the bed nucleus of the stria terminalis in the human brain. J Chem Neuroanat. 1991;4(4):281–298. doi: 10.1016/0891-0618(91)90019-9. [DOI] [PubMed] [Google Scholar]
- Ward JH., Jr Hierarchical grouping to optomize an objective function. Journal of the American Statistical Association. 1963;58:236–244. [Google Scholar]
- Weiser M, Vega-Saenz de Miera E, Kentros C, Moreno H, Franzen L, Hillman D, Baker H, Rudy B. Differential expression of Shaw-related K+ channels in the rat central nervous system. J Neurosci. 1994;14(3 Pt 1):949–972. doi: 10.1523/JNEUROSCI.14-03-00949.1994. [DOI] [PMC free article] [PubMed] [Google Scholar]
- Xie J, Nagle GT, Ritchie AK, Collins TJ, Childs GV. Cold stress and corticotropin- releasing hormone induced changes in messanger ribonucleic acid for the alpha (1)-subunit of the L-type Ca(2+) channel in the rat anterior pituitary and enriched populations of corticotropes. Neuroendocrinology. 1999;70(1):10–9. doi: 10.1159/000054455. [DOI] [PubMed] [Google Scholar]
- Zhang L, Valiante TA, Carlen PL. Contribution of the low-threshold T-type calcium current in generating the post-spike depolarizing afterpotential in dentate granule neurons of immature rats. J Neurophysiol. 1993;70(1):223–231. doi: 10.1152/jn.1993.70.1.223. [DOI] [PubMed] [Google Scholar]