

Abstract
MRI is a sensitive method for detecting subtle anatomic abnormalities in the neonatal brain. To optimize the usefulness for neonatal and pediatric care, systematic research, based on quantitative image analysis and functional correlation, is required. Normalization-based image analysis is one of the most effective methods for image quantification and statistical comparison. However, the application of this methodology to neonatal brain MRI scans is rare. Some of the difficulties are the rapid changes in T1 and T2 contrasts and the lack of contrast between brain structures, which prohibits accurate cross-subject image registration. Diffusion tensor imaging (DTI), which provides rich and quantitative anatomical contrast in neonate brains, is an ideal technology for normalization–based neonatal brain analysis. In this paper, we report the development of neonatal brain atlases with detailed anatomic information derived from DTI and co-registered anatomical MRI. Combined with a diffeomorphic transformation, we were able to normalize neonatal brain images to the atlas space and three-dimensionally parcellate images into 122 regions. The accuracy of the normalization was comparable to the reliability of human raters. This method was then applied to babies of 37 to 53 post-conceptional weeks to characterize developmental changes of the white matter, which indicated a posterior-to-anterior and a central-to-peripheral direction of maturation. We expect that future applications of this atlas will include investigations of the effect of prenatal events and the effects of preterm birth or low birth weights, as well as clinical applications, such as determining imaging biomarkers for various neurological disorders.
Keywords: human, neonate, atlas, magnetic resonance imaging, diffusion tensor imaging
Introduction
Recent advances in obstetrics and neonatology have led to a marked improvement in survival of babies with perinatal insults. However, the neurological and psychological morbidities associated with these problems still remain (D'Angio et al., 2002; Marlow, 2004; Vohr et al., 2000; Wilson-Costello et al., 2005). These resultant challenges are not restricted to obvious disabilities, such as cerebral palsy, epilepsy, and mental retardation, but also include impaired academic achievement and behavioral disorders that manifest after these children reach school-age (Hack and Fanaroff, 1999; Hack et al., 2000; Perlman, 2001). Despite the importance of treatment, there are currently a limited number of interventional options to reduce or prevent the neurologic morbidity suffered by babies with prenatal problems (Als et al., 2004; Blauw-Hospers and Hadders-Algra, 2005). One of the reasons such treatments have not been developed is that the diagnosis depends on the neurological evaluation, which can detect only substantial brain damage, while many neuro-cognitive symptoms are not easily detectable during the first year of life. To develop new treatments, methods are needed that can detect and quantify even subtle abnormalities of the neonatal brain.
Imaging modalities have played an important role in detecting damage to the neonatal brain. MRI, in particular, has advantages in showing subtle abnormalities, such as small hemorrhagic lesions, ischemic lesions, and signal abnormalities that cannot be appreciated by other modalities like CT or ultrasound. Previous studies have reported that there is a substantial correlation between several types of abnormalities and their prognosis (De Vries et al., 1999; Hayakawa et al., 1996; Inder et al., 2005; Roelants-van Rijn et al., 2001; Shah et al., 2006; Woodward et al., 2006). However, there are several reasons why MRI has not been routinely used to evaluate the neonatal brain. First, MR contrast in the neonate brain varies considerably with age, and it is difficult to understand what constitutes a normal appearance and what degree of variability constitutes a pathological condition. Second, the location and the extent of abnormalities may vary considerably. To make MRI truly applicable to evaluate abnormalities in the neonatal brain, a quantitative characterization of the entire normal brain anatomy is an essential first step. For MRI analysis of the adult brain, normalization-based quantitative analysis methods are widely used, which is an effective way to quantitatively characterize the brain anatomy. For pediatric brain analysis, attempts have been made to create age-specific brain templates (Fonov et al., 2010; Wilke et al., 2008; Wilke et al., 2003; Yoon et al., 2009). However, for the neonate population, there are only a small number of studies using image normalization (Kazemi et al., 2008; Kazemi et al., 2007; Shi et al., 2009). One of the major issues has been the lack of a reliable method for delineating neonatal brain structures, which is required for accurate normalization of one brain to another. This difficulty is due to a reduction in gray matter/white matter contrast in both T1- and T2-weighted images compared to the adult brain. There have been attempts to increase the accuracy of tissue segmentation, using a region-wise comparison approach and a multi-modal image set registration, which successfully increased the accuracy of the tissue classification (Shi et al., 2010). This method could increase the normalization accuracy, based on the T1- and T2-weighted images (Lorenzen et al., 2006; Shi et al., 2009). Accurate registration of intra-white matter structures is, on the other hand, still challenging due to the lack of contrasts.
Diffusion Tensor Imaging (DTI)–derived contrasts (diffusion anisotropy and fiber orientation) can provide rich anatomical information about the pre-myelinated neonatal brain (Huang et al., 2006); in fact, most of the white matter structures seen in the adult brain with DTI have already been established in the neonatal brain and can be visualized by DTI (Zhang et al., 2007). Therefore, DTI contrast has the potential to guide normalization of the neonatal brain more accurately than conventional relaxation-based MRI. In addition, DTI can provide quantitative measures related to water diffusivity, which is believed to reflect certain maturation processes, such as axonal growth and myelination (Beaulieu, 2002; Dubois et al., 2008; Mori and Zhang, 2006; Mukherjee et al., 2002; Ramenghi et al., 2009). These quantitative measures could be statistically analyzed in a tract-specific manner using normalization-based DTI analyses, even for the pre-myelinated neonatal brain (Anjari et al., 2007; Goodlett et al., 2009).
In this study, we created an MRI atlas for neonate brain analysis. This includes a group-averaged atlas and a single-subject-based atlas that includes T1- and T2-weighted contrasts and DTI-derived contrasts. One hundred and twenty-two brain structures were parcellated in the atlas. In the past, we have developed a multi-contrast (T1-, T2-weighted, and DTI) adult brain atlas (JHU -MNI atlas) and a normalization-based quantification analysis method for quantitative MRI analysis (Oishi et al., 2009; Oishi et al., 2008). Here, we extended this method to enable analysis of neonatal brains by combining the neonatal brain atlas and multi-contrast diffeomorphic warping. The method was applied to the DTIs from normal-term infants to measure the accuracy of atlas-based segmentation. In addition, the age dependency of DTI parameters was characterized using 33 neonatal images from infants who ranged in age from 37 to 53 post-conceptional weeks. Finally, the normal average values and standard deviations of diffusion parameters of 24 brain structures were characterized from normal-term neonates from 37 to 43 post-conceptional weeks to create a term-equivalent database of DTI parameters.
Methods
Creation of multi-contrast MRI atlases
We created group-averaged atlases and a single-subject atlas. The purpose of a group-averaged atlas is to determine the average shape and size of the neonate brain. This atlas can be used as a template for the brain normalization using linear transformations or nonlinear transformations with image “smoothing.” However, as a result of averaging, the sharpness of the image contrast can be lost. Therefore, a single-subject atlas with the size adjusted to that of the group-averaged atlas was created as well, providing a template for highly elastic nonlinear transformations, which require sharp image features (Oishi et al., 2009).
Subjects
The data used to create the atlas were based on a de-identified database of normal neonate brain MRI scans. The subjects recruited to create the database were born at the Johns Hopkins Hospital, which is a regional referral, subspecialty care center. The database contains 25 brain images from 0- to 4-day-old (38 to 41 post-conceptional weeks) healthy, full-term neonates, including 15 boys and 10 girls. For the database creation, permission was obtained from the Johns Hopkins Medicine Institutional Review Board and written, informed consent was provided by the infants’ parents.
MRI scans
The scans were performed without sedation with infants asleep. To ensure that neonates were sleeping during the scan, neonates were well fed before the scan and were well wrapped in a blanket with the ears covered with an ear muff. The subjects were then placed in cushions that occupied the space between the subject and the RF coil. Images were acquired using a 3.0 T Philips scanner equipped with gradients of up to 8.0 G/cm per direction. The RF was transmitted by a body coil and the receive coil was an 8-element SENSE coil, in which two of the coils were combined to be connected to a 6-channel receiver. After T1-weighted scout imaging, Diffusion Tensor imaging (DTI), Double-echo fast spin-echo (DE-FSE), and Magnetization-Prepared Rapid Gradient Echo (MPRAGE) sequences were used to obtain images.
A single-shot EPI with SENSE acquisition was used for DTI (Bammer et al., 2001; Jaermann et al., 2004; Pruessmann et al., 1999). The imaging matrix was 80 × 80 with a field-of-view of 150 × 150 mm, which gave a nominal 1.88 mm isotropic in-plane resolution. These were zero-filled to 256 × 256 mm. The slice orientation was axial with a 1.9 mm thickness parallel to the anterior–posterior commissure (AC - PC) line. Forty to fifty slices covered the entire hemisphere and the brainstem. Echo time was 71 ms and repetition time was more than 3s. A SENSE reduction factor of 3 was used. Diffusion-weighting was applied along 30 independent axes (Jones et al., 1999) with b = 700 s/mm2, in addition to 5 minimally diffusion -weighted images. The scanning time for one complete DTI dataset was approximately 5 min. Co-registered DE-FSE images were also acquired with a first echo time of 27.7 ms, a second echo time of 120 ms, and a repetition time of 4.5 sec. The imaging matrix was 80 × 70 with a field of view of 150 × 150 mm, zero-filled to 256 × 256, and an axial slice thickness of 1.9 mm. For MPRAGE, we used an echo time of 4.6 ms and a repetition time of 9.9 ms with an imaging matrix of 160 × 160 × 80 - 100 and a field of view of 150 × 150 × 72 – 90 mm, zero-filled to 256 × 256 × 80 - 100 matrix acquired parallel to the AC - PC line
DIT data processing
The raw diffusion-weighted images (DWIs) were first co-registered to one of the minimally diffusion-weighted images and corrected for participant motion and the linear portion of eddy current distortions using a 12-parameter affine transformation of Automated Image Registration (AIR) (Woods et al., 1998). The six elements of the diffusion tensor were calculated for each pixel with multivariate linear fitting using DtiStudio (H. Jiang and S. Mori, Johns Hopkins University, Kennedy Krieger Institute, lbam.med.jhmi.edu or www.MriStudio.org) (Jiang et al., 2006; Mori et al., 2008; Pierpaoli et al., 2001). After diagonalization, three eigenvalues and eigenvectors were obtained. For the anisotropy map, fractional anisotropy (FA) was used (Pierpaoli and Basser, 1996). The eigenvector (v1) associated with the largest eigenvalue was used as an indicator of fiber orientation. For the mean diffusivity (MD) map, the average of three eigenvalues of the tensor was used. A 24-bit, color-coded orientation map was created by assigning red, green, and blue channels to the x (right-left), y (anterior-posterior), and z (superior-inferior) components of the v1, where intensity was proportional to FA (Makris et al., 1997; Pajevic and Pierpaoli, 1999). DTIs were then re-sliced to 0.6 mm isotropic resolution (180 × 220 × 180 matrix). B0-susceptibility distortion was corrected using a previously published method (Huang et al., 2008). Briefly, the least diffusion-weighted image (b0) of the DTI was warped to the T2-weighted contrast of the DE-FSE image (echo time: 120 ms) that was resliced to 0.6 mm isotropic resolution (180 × 220 × 180 matrix), using a large deformation diffeomorphic metric mapping (LDDMM) (Beg et al., 2005; Miller et al., 2006), and the warping was applied to the tensor field. The tensor transformation was based on a method proposed by (Xu et al., 2003). MPRAGE was also resliced to the same image matrix and was linearly co-registered to the DE-FSE using a six-parameter rigid transformation of AIR. These procedures resulted in a co-registered set of MPRAGE, DE-FSE, and B0–distortion-corrected DTI, with a 0.6 mm isotropic resolution. All images were reviewed for artifacts, and twenty DTIs, twenty T2-weighted images, and fourteen T1-weighted images were selected out of 25 images as high quality images suitable for creating an atlas with the following procedure.
Atlas creation
The procedure followed six steps (Fig. 1) similar to the concept for creating the adult group-averaged atlas (ICBM-152) (Mazziotta et al., 2001; Mazziotta et al., 1995) and the single-subject atlas (colin27)(Aubert -Broche et al., 2006; Collins et al., 1998; Holmes et al., 1998), all of which are commonly used in the neuroimaging community. The key is to align the anterior commissure-posterior commissure (AC–PC) line using a linear transformation. However, for the neonate brain, a single-subject atlas, like the Talairach atlas for adult brains, which can be used as a reference for the AC–PC line has not been established yet. Therefore, the common AC–PC line was set according to the shape and size of the averaged brain. First, the orientation of the midline and the AC–PC line of each T2 weighted image were aligned along the Y-axis of the image by rigid rotation using two-point landmarks. Then, all images from the 20 subjects were aligned at the AC. The shift and rotation matrices used for the co-registration were also applied to the MPRAGE and the DTI. Second, an average image of the co-registered T2-weighted images was created. This averaged image worked as a tentative template for the next step (1st template). Third, each co -registered T2-weighted image was normalized to the 1st template using an affine transformation of AIR to create the average image (2nd template). Fourth, each co -registered T2-weighted image was normalized to the 2nd template using an affine transformation to create the average image. The purpose of this step was to obtain a sharper edge of the averaged image than that of the 2nd template. The linear transformation matrices derived from this step were also applied to the co-registered MPRAGE and DTI to create an averaged MPRAGE and DTI. The set of averaged T2-weighted images, MPRAGE, and DTI were named the JHU-neonate-linear, since these images were created by averaging linearly normalized images. Fifth, a single-subject image with the brain shape best fitted to that of the JHU- neonate-linear was selected from the 20 images, and linearly normalized to the T2-weighted image of the JHU-neonate-linear. The resultant transformation matrix was applied to the co-registered MPRAGE and DTI to create a single-subject atlas with a brain size and shape almost identical to that of the JHU-neonate-linear. These images were named the JHU-neonate-SS. Finally, co-registered DTI images were nonlinearly normalized to the single-subject atlas using dual-channel LDDMM (Ceritoglu et al., 2009), with MD and FA maps to drive the transformation. The resultant nonlinear transformation matrices were also applied to the co-registered MPRAGE and T2-weighted image to create a set of averaged MPRAGE, T2-weighted image, and DTI. This set was named the JHU-neonate-nonlinear, since these images were created by averaging nonlinearly normalized images. All normalization was performed using DiffeoMap (www.mristudio.org, Johns Hopkins University).
Figure 1.

Diagram showing the steps required to create group-averaged neonate atlases (JHU- neonate-linear and JHU-neonate-nonlinear) and a single-subject atlas (JHU-neonate-SS).
Parcellation of the MRI atlas
The deep white matter structures identified in our previous studies of adult brains (Mori et al., 2008; Mori et al., 2005; Oishi et al., 2009)were readily identified in the neonate brains using DTI contrasts. We manually parcellated these structures on the JHU-neonate-SS using a color-coded orientation map as a guide (Appendix fig.1). The parcellation followed the definition of our previous adult atlas as much as possible. As previously reported (Zhang et al., 2007), the superior longitudinal fasciculus of neonates was not necessarily clear for its entire length and had a fragmented appearance. Therefore, the approximate location was estimated by extrapolating the location from the adult atlas, and connecting the fragmented sections. After the core white matter regions were defined, we identified the cortical surface and the subcortical gray matter using the MPRAGE and T2-weighted images. Between the brain surface and the deep white matter, we located the cerebral cortex and the superficial white matter adjacent to the cortex. We parcellated this area according to the gyral pattern. The nomenclature followed our previous adult MRI atlas (Oishi et al., 2009), based on Talairach’s atlas (Talairach and Tournoux, 1988). For these manual parcellation procedures, ROIEditor (www.Mristudio.org) was used with inspection of all three slice orientations. A total of 122 structures were parcellated, as shown in the Appendix.
Appendix figure.
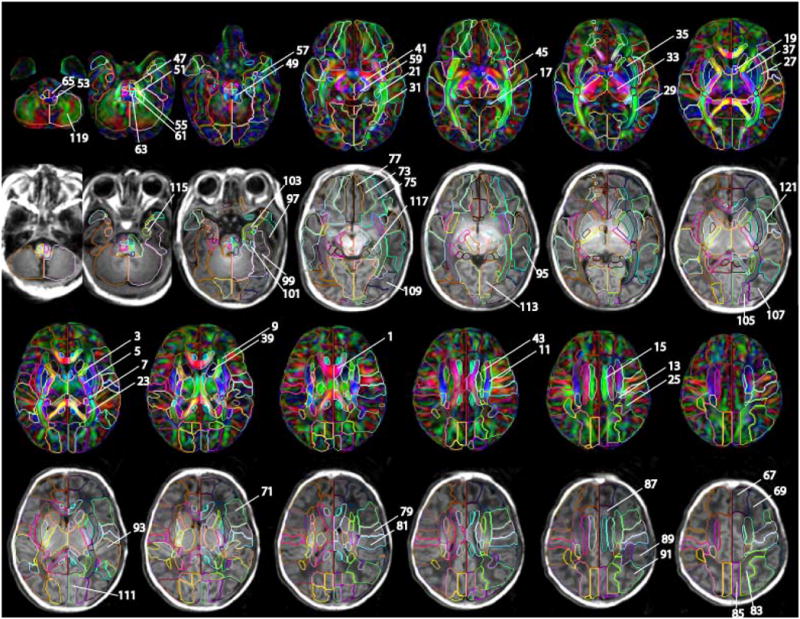
The detail of the parcellation map on the JHU-neonate-SS atlas. Numbers indicated in the figure are identical to the structure number listed in the appendix table. For the manual parcellation, we used the following criteria. The first criterion was the clear boundary defined by fiber orientation difference, which is obvious even in the color-coded orientation map of the group averaged atlas (JHU-neonate-nonlinear). This procedure allowed us to parcellate deep gray and white matter structures. The exceptions were between anterior/superior and superior/posterior subdivision of the corona radiata, and between posterior thalamic radiation and sagittal stratum, which were arbitrary defined. The second criterion was a pattern of gyrus/sulcus formation, which is obvious in T1-weighted atlas of JHU-neonate-SS. Lastly, we extend the sulcus to the deep white matter structures as smooth as possible. Many boundaries in this paper were consistent with our three previous papers to establish the adult atlases (Mori et al., 2008; Oishi et al., 2009; Oishi et al., 2008)
Appendix.
Parcellated structures and abbreviations
| abbreviation | structure | left/right | volume (mm3) | |
|---|---|---|---|---|
| 1 | CC | corpus callosum | left | 3677 |
| 2 | CC | corpus callosum | right | 4194 |
| 3 | ALIC | anterior limb of internal capsule | left | 883 |
| 4 | ALIC | anterior limb of internal capsule | right | 889 |
| 5 | PLIC | posterior limb of internal capsule | left | 1181 |
| 6 | PLIC | posterior limb of internal capsule | right | 1146 |
| 7 | RLIC | retrolenticular part of internal capsule | left | 345 |
| 8 | RLIC | retrolenticular part of internal capsule | right | 337 |
| 9 | ACR | anterior corona radiata | left | 1031 |
| 10 | ACR | anterior corona radiata | right | 913 |
| 11 | SCR | superior corona radiata | left | 1692 |
| 12 | SCR | superior corona radiata | right | 1946 |
| 13 | PCR | posterior corona radiata | left | 545 |
| 14 | PCR | posterior corona radiata | right | 606 |
| 15 | CGC | cingulum cingular part | left | 1009 |
| 16 | CGC | cingulum cingular part | right | 1064 |
| 17 | CGH | cingulum hippocampal part | left | 632 |
| 18 | CGH | cingulum hippocampal part | right | 559 |
| 19 | Fx | fornix | left | 865 |
| 20 | Fx | fornix | right | 1139 |
| 21 | ST | stria terminalis | left | 785 |
| 22 | ST | stria terminalis | right | 754 |
| 23 | TAP | tapetum | left | 688 |
| 24 | TAP | tapetum | right | 670 |
| 25 | SLF | superior longitudinal fasciculus | left | 667 |
| 26 | SLF | superior longitudinal fasciculus | right | 738 |
| 27 | EC | external capsule | left | 1818 |
| 28 | EC | external capsule | right | 1696 |
| 29 | PTR | posterior thalamic radiation | left | 1695 |
| 30 | PTR | posterior thalamic radiation | right | 1687 |
| 31 | SS | sagittal stratum | left | 1048 |
| 32 | SS | sagittal stratum | right | 997 |
| 33 | Thal | thalamus | left | 3824 |
| 34 | Thal | thalamus | right | 4209 |
| 35 | Put | putamen | left | 1301 |
| 36 | Put | putamen | right | 1153 |
| 37 | GP | globus pallidus | left | 473 |
| 38 | GP | globus pallidus | right | 418 |
| 39 | Cau | caudate nucleus | left | 1181 |
| 40 | Cau | caudate nucleus | right | 1254 |
| 41 | CP | cerebral peduncle | left | 500 |
| 42 | CP | cerebral peduncle | right | 497 |
| 43 | SFO | superior fronto-occipital fasciculus | left | 217 |
| 44 | SFO | superior fronto-occipital fasciculus | right | 234 |
| 45 | IFO | inferior fronto-occipital fasciculus | left | 437 |
| 46 | IFO | inferior fronto-occipital fasciculus | right | 438 |
| 47 | CST | corticospinal tract | left | 157 |
| 48 | CST | corticospinal tract | right | 191 |
| 49 | SCP | superior cerebellar peduncle | left | 303 |
| 50 | SCP | superior cerebellar peduncle | right | 415 |
| 51 | MCP | middle cerebellar peduncle | left | 696 |
| 52 | MCP | middle cerebellar peduncle | right | 747 |
| 53 | ICP | inferior cerebellar peduncle | left | 171 |
| 54 | ICP | inferior cerebellar peduncle | right | 175 |
| 55 | PCT | pontine crossing tract | left | 149 |
| 56 | PCT | pontine crossing tract | right | 210 |
| 57 | UNC | uncinate fasciculus | left | 163 |
| 58 | UNC | uncinate fasciculus | right | 203 |
| 59 | midbrain | midbrain | left | 781 |
| 60 | midbrain | midbrain | right | 983 |
| 61 | pons | pons | left | 143 |
| 62 | pons | pons | right | 192 |
| 63 | ML | medial lemniscus | left | 112 |
| 64 | ML | medial lemniscus | right | 163 |
| 65 | Medulla | medulla oblongata | left | 211 |
| 66 | Medulla | medulla oblongata | right | 256 |
| 67 | SFG | superior frontal gyrus | left | 12457 |
| 68 | SFG | superior frontal gyrus | right | 13720 |
| 69 | MFG | middle frontal gyrus | left | 10497 |
| 70 | MFG | middle frontal gyrus | right | 11650 |
| 71 | IFG | inferior frontal gyrus | left | 6151 |
| 72 | IFG | inferior frontal gyrus | right | 5565 |
| 73 | MFOG | medial fronto-orbaital gyrus | left | 2706 |
| 74 | MFOG | medial fronto-orbaital gyrus | right | 1956 |
| 75 | LFOG | lateral fronto-orbital gyrus | left | 2912 |
| 76 | LFOG | lateral fronto-orbital gyrus | right | 2878 |
| 77 | RG | gyrus rectus | left | 2247 |
| 78 | RG | gyrus rectus | right | 2857 |
| 79 | PrCG | precentral gyrus | left | 7618 |
| 80 | PrCG | precentral gyrus | right | 5993 |
| 81 | PoCG | postcentral gyrus | left | 6930 |
| 82 | PoCG | postcentral gyrus | right | 5443 |
| 83 | SPL | superior parietal lobule | left | 7535 |
| 84 | SPL | superior parietal lobule | right | 7957 |
| 85 | PrCu | precuneus | left | 3289 |
| 86 | PrCu | precuneus | right | 3925 |
| 87 | CingG | cingular gyrus | left | 7963 |
| 88 | CingG | cingular gyrus | right | 9947 |
| 89 | SMG | supramarginal gyrus | left | 4200 |
| 90 | SMG | supramarginal gyrus | right | 4093 |
| 91 | AG | angular gyrus | left | 7268 |
| 92 | AG | angular gyrus | right | 6439 |
| 93 | STG | superior temporal gyrus | left | 7056 |
| 94 | STG | superior temporal gyrus | right | 7140 |
| 95 | MTG | middle temporal gyrus | left | 6565 |
| 96 | MTG | middle temporal gyrus | right | 5693 |
| 97 | ITG | inferior temporal gyrus | left | 4188 |
| 98 | ITG | inferior temporal gyrus | right | 4326 |
| 99 | Fu | fusiform gyrus | left | 5078 |
| 100 | Fu | fusiform gyrus | right | 5412 |
| 101 | PHG | parahippocampal gyrus | left | 531 |
| 102 | PHG | parahippocampal gyrus | right | 590 |
| 103 | ENT | entrhinal cortex | left | 887 |
| 104 | ENT | entrhinal cortex | right | 903 |
| 105 | SOG | superior occipital gyrus | left | 2293 |
| 106 | SOG | superior occipital gyrus | right | 2139 |
| 107 | MOG | middle occipital gyrus | left | 6702 |
| 108 | MOG | middle occipital gyrus | right | 6935 |
| 109 | IOG | inferior occipital gyrus | left | 3135 |
| 110 | IOG | inferior occipital gyrus | right | 2854 |
| 111 | Cu | cuneus | left | 3173 |
| 112 | Cu | cuneus | right | 2787 |
| 113 | LG | lyngual gyrus | left | 5004 |
| 114 | LG | lyngual gyrus | right | 5526 |
| 115 | Amyg | amygdala | left | 286 |
| 116 | Amyg | amygdala | right | 310 |
| 117 | Hippo | hippocampus | left | 936 |
| 118 | Hippo | hippocampus | right | 826 |
| 119 | Cerebrellum | cerebellar hemisphere | left | 11967 |
| 120 | Cerebrellum | cerebellar hemisphere | right | 12707 |
| 121 | Ins | insular cortex | left | 1662 |
| 122 | Ins | insular cortex | right | 1671 |
Application to DTI of normal-term infants
We applied the JHU-neonate-SS atlas and LDDMM to DTI datasets from healthy neonates to measure the size and DTI parameters of each segmented brain structure. The segmentation accuracy was also measured by comparing the automated results with manual segmentation for selected brain structures. We used a de-identified database of normal infant brain MRI scans who were born at the Queen’s Medical Center, Honolulu, Hawaii. The database contains 33 brain images from 22 healthy full-term babies (ranging from 37 to 53 post-conceptional weeks), including 9 boys and 13 girls. For the brain imaging, permission was obtained from the Co-operative Institutional Review Board of the Queen’s Medical Center and the University of Hawaii, and written informed consent was provided by the infants’ parents or legal guardians.
MRI scans and image processing
A setup that was similar to the scans performed to create the JHU-neonate templates was used to scan these infants without sedation. Infant motion was minimized by wrapping the infants in a vacuum immobilization mat (Noras MRI Products, Hoechberg, Germany) with earmuffs. Images were acquired using a 3.0 T Siemens TIM Trio scanner (Siemens Medical Solutions, Erlangen, Germany) equipped with a twelve-channel, phased-array RF coil for parallel imaging. A single-shot EPI with SENSE acquisition was used for DTI. The imaging matrix was 160 × 160 with a field-of-view of 160 × 160 mm, which resulted in a 1.0 mm isotropic in-plane resolution. The slice orientation was axial with 2.0 mm thickness. Forty to fifty slices covered the entire cerebral hemisphere. Echo time was 106 ms and repetition time was 7 to 9 sec, depending on the specific absorption rate limitations. Diffusion-weighting was applied along 12 independent axes with b = 1000 s/mm2, in addition to a minimally diffusion-weighted image. The DTI processing followed exactly the method we used to create the JHU-neonate templates. The procedures resulted in DTI maps with a 0.6 mm isotropic resolution and a 180 × 220 × 180 matrix.
Normalization of the images
Data from each subject was first co-registered to the JHU-neonate-SS space and then linearly normalized to the JHU-neonate-SS using 12-parameter affine transformation. The resultant matrix was applied to the tensor field to create an affine-normalized tensor field as described in (Xu et al., 2003). FA and MD were calculated from the normalized tensor field and then nonlinearly normalized to the FA and MD map of the JHU-neonate-SS using LDDMM. The resultant matrix was applied to the affine-normalized tensor field to create an LDDMM-normalized tensor field. During this procedure, reverse-transformation, which can transform the JHU-neonate-SS atlas to each co-registered image, was also created. DiffeoMap was used to run LDDMM, as described elsewhere (Oishi et al., 2009).
Measurement of registration quality
To measure the accuracy of the white matter registration, we selected five images from neonates of 40 post-conceptional weeks and four images from infants of 49 - 52 post-conceptional weeks. Two types of accuracy measurements, Dice’s coefficient (Dice) and L1 error, were used. We first delineated ten brain structures on the normalized images manually (manual delineation), which worked as a benchmark for the registration accuracy measurement. Then, we overlaid the parcellation map onto the JHU-neonate-SS atlas to delineate the brain structures automatically (automated delineation), and see how accurately the overlap reflected the manual delineation.
Manual delineation
Ten brain structures were delineated manually on five pre-determined 2D slices of the normalized images. The criteria for structural delineation closely followed the method of parcellation in the JHU-neonate-SS atlas. Table 1 shows the list of these WM structures. The delineated set of structures was named the “standard ROI set.” To investigate inter-rater variability, two raters (K.O. and A.F., neurologist and neuroradiologist) performed the manual delineation.
Table 1.
List of seven brain structures and slice locations for manual delineation
| Axial # | structures |
|---|---|
| z = 91 | posterior limb of the internal capsule, the putamen, and the external capsule |
| z = 80 | anterior limb of the internal capsule, thalamus |
| z = 111 | cingulum |
| Sagittal # | |
| x = 90 | corpus callosum |
Automated delineation
The “standard ROI set” was readily identified by superimposing the parcellation map of the JHU-neonate-SS atlas onto the normalized images.
Accuracy measurements
The various structures defined by automated and manual delineation were saved as binary maps, in which the structure of interest was defined as “1” and the rest of the pixels were “0.” By superimposing the binary maps from the automated and manual methods, each pixel could be categorized into one of three classes: (1) pixels that were outside the structures (“0”) in either method (nn); (2) pixels that were defined as the structure of interest (“1”) in only one of the two methods (pn, np); and (3) pixels that contained the structure in both methods (pp). After this categorization, reliability analyses were performed using the Dice metric, which evaluates overlap of the two areas defined as 2pp/(pn + 2pp + np), and the L1 error, which evaluates misclassification error defined as (1-pp/(pp+pn+np))/2 (Ratnanather et al., 2004). The Dice and L1 error metrics within the manual trials by two different raters provided the level of precision for manual delineation, which was treated as the gold standard. Then, the Dice and L1 error metrics comparing the automated and manual delineation were calculated for each ROI.
DTI measurement of the segmented brain structures
To test the feasibility of the atlas-based analysis to detect the diffusion properties of the infant brain using the JHU-neonate-SS and LDDMM, we measured FA and MD of 20 white matter structures and four deep gray structures of the 33 DTIs normalized to the JHU-neonate-SS. By using ROIEditor, the parcellation map was overlaid on the normalized FA and MD maps to calculate the mean and standard deviation for each structure. The cortical areas, brain stem, and the cerebellar areas were omitted because only DTI was available, and about half the images did not cover the entire brainstem or cerebellum.
Power analysis to detect FA and MD alterations
A power analysis was performed to test the ability to detect subtle abnormalities, such as a 10% alteration of FA and MD for each brain structure using the JHU-neonate-SS atlas and LDDMM. Past literature indicates that the DTI parameters for several white matter bundles change drastically during the month after birth (Dubois et al., 2008). Therefore, for the cross-sectional group analysis, we needed to select subjects from a narrow age range. Since we assumed that the JHU-neonate atlas would be used to normalize term-equivalent neonatal brains, we selected ten full-term neonates, scanned at 38–43 post-conceptional weeks, for the analysis. We investigated the required number of subjects to detect a 10% alteration in MD and FA of the target group, compared to the control group, with p < 0.05, using a t-test. The software G*power (Faul et al., 2007) was used for the analysis.
Results
Multi-contrast neonatal brain atlas
Fig. 2 shows the images from the JHU-neonate-linear, the JHU-neonate-nonlinear, and the JHU-neonate-SS. The gray matter/white matter contrasts of the T1- and T2-weighted images were opposite to those of adults, and had poor contrast inside the white matter area. Conversely, DTI provided superior contrast to reveal the white matter anatomy. The core white matter structures, in particular, such as the internal capsule, were easily identified even in the group-averaged images. The rightmost column shows the parcellation map overlaid on the JHU-neonate-SS. This parcellation map works as a set of pre-defined ROIs for automated brain parcellation after the normalization.
Figure 2.

Multi-contrast atlases created in this study. The upper row shows a T1-weighted atlas, the middle row shows a T2-weighted atlas, and the lower row shows a DTI atlas (color-coded orientation map of the diffusion anisotropy were used as the representative image). The JHU-neonate-linear atlas (the leftmost column) represents the average size and shape of the twenty images used to create the template. The sharpness of the edge of each brain structure seen in the JHU-neonate-nonlinear atlas (the column next to the linear template) indicates that the LDDMM transformation was fairly accurate. The JHU-neonate-SS atlas (the rightmost two columns; right column with the parcellation map) was used as a template for the normalization using LDDMM.
Measurement of registration quality
Fig. 3 shows the original neonate images and the images normalized to the JHU-neonate-SS atlas, overlaid by the parcellation map that can qualitatively demonstrate the registration accuracy. Structures that are grossly mis-registered are indicated by yellow arrows. After affine transformation, overall brain shapes were well-normalized to the JHU-neonate-SS space. However, registration accuracy of the inner structures was low, as can be appreciated from the mismatch between the superimposed parcellation map and underlying white matter structures. These registration errors were much improved after LDDMM transformation.
Figure 3.

Examples of the normalization using 12-parameter affine transformation of AIR and multi-channel LDDMM. The original neonate images from 40 post-conceptional weeks (left two images) and 50 post-conceptional weeks (right two images) are shown in the upper row. Note that the size of the brain is larger at 50 post-conceptional weeks. The images were normalized to the JHU-neonate-SS space and overlaid by the parcellation map that can qualitatively demonstrate the registration accuracy. The mis-registrations seen in the ALIC, PLIC, RLIC, CC, EC, and PTR after affine normalization were corrected after LDDMM. See the appendix for abbreviations.
Fig. 4 shows the result of Dice and L1 error analyses. In most areas, the Dice scores between automated and manual delineation were over 0.8, which indicate almost perfect registration accuracy. Even in the thin, string-like structure of the cingulum, the Dice measure was more than 0.75, which indicates substantial registration accuracy. Misclassification measured by L1 error was comparable to that of the inter-rater comparison (Fig. 4B). There was no difference in the registration accuracy measured by Dice and L1 errorbetween brains from 40 post -conceptional weeks and 49–52 post-conceptional weeks. There was also no difference in the accuracy between manual–automated ROI registration and manual–manual ROI registration (inter-rater variability). Therefore, this method could successfully normalize the brain images ranging from 40 to 52 post-conceptional weeks, thus rivaling the reproducibility of the manual segmentation.
Figure 4.

The Dice (A) and L1 error (B) measures for each brain structure. The data are from averageof all ten infants (all: white bars), average of five 40 post-conceptional weeks (40 weeks: bars with dots), average of five 49 – 52 post-conceptional weeks(49 – 52 weeks: ho rizontal lines), and inter-rater comparison (Inter-rater: black bars). There was no difference in the Dice and L1 error measures between all and inter-rater, and between 40 weeks and 49 – 52 weeks of age.
Diffusion properties of the normal-term-birth neonate brain
Overall, we found a general trend toward decreasing MD and increasing FA with age, which is interpreted as the maturation of the brain structures. In addition, there is a structure-specific maturation pattern. The slope and the intercept (40 post -conceptional week estimated value) of MD and FA against the age were calculated by linear regression. Fig. 5 shows a chart with scatter plots that indicate the relation between the MD slope and the FA slope (Fig. 5A), the estimated MD at 40 post-conceptional weeks and the MD slope (Fig. 5B), and the estimated FA at 40 post -conceptional weeks and the FA slope of the 24 structures (Fig. 5C). In Fig. 5D, three representative areas with markedly different slopes and intercepts are shown, which should provide an idea about the relationships between data variability and effect size. Generally, the gray matter, limbic fibers (the fornix, the stria terminalis, and the cingulum), and some of the association fibers (the uncinate, the external capsule, and the inferior fronto-occipital fasciculus) show relatively slow decreases in MD and slow increases in FA with age. There was a tendency of inverse relationship between the slope and the 40-week intercept for MD(Fig. 5B) but not for FA (Fig. 5C). Within projection fibers, fibers that are located distant from the brainstem (the corona radiata, posterior thalamic radiation, and the sagittal striatum) show a higher MD at 40 weeks and a faster MD decrease with age than those that are located close to the brainstem (the posterior limb of the internal capsule, the retrolenticular part of the internal capsule, and the cerebral peduncle). Areas with rich crossing fibers (the corona radiata and the anterior limb of the internal capsule) show a lower FA at 40 weeks and a slower FA increase with age than those with less crossing fibers (the posterior limb of the internal capsule, the retrolenticular part of the internal capsule, the cerebral peduncle, the posterior thalamic radiation, and the sagittal striatum). Within association fibers, the superiorly located structures (the superior longitudinal fasciculus and the superior fronto-occipital fasciculus) show a higher MD at 40 weeks and a faster MD decrease with age than inferiorly located structures (the external capsule, the inferior fronto-occipital fasciculus, and the uncinate), even though the FA at 40 weeks and the FA slopes were similar.
Figure 5.

The relationship between (A) the age-dependent MD decreasing slope and the age-dependent FA increasing slope, (B) the estimated MD at 40 post-conceptional weeks and the age-dependent MD decreasing slope, and (C) the estimated FA at 40 post-conceptional weeks and age-dependent FA increasing slope. The white matter structures were categorized to the association fibers (black dots: SLF, SFO, ILF, IFO, and UNC), the commissural fibers (pink dots: CC and TAP), the limbic fibers (blue dots: CGC, CGH, Fx, and ST), and the projection fibers (green dots: ALIC, PLIC, RLIC, CP, PTR, SS, ACR, SCR, and PCR). (D): Linear regression analysesof MD and FA from three representative areas. Open squares indicate data from boys, and black circles indicate data from girls. The MD and FA of each structure show time-dependent changes with markedly different slopes and intercepts. See the appendix for abbreviations.
Required number of subjects to detect a 10% alteration in FA and MD
To detect a 10% alteration in FA and MD, most of the 24 structures required fewer than 20 subjects, which was sensitive enough for the subsequent cross-sectional group analysis (Table 2). However, we anticipate that this method will not be suitable to detect FA differences less than 10% in the basal ganglia, such as in the caudate, the putamen, and the globus pallidus, since the standard deviation of the FA was too high.
Table 2.
Average and standard deviation (SD) of each structure with a required total number of subjects (total of diseased subjects and control subjects) needed to detect a 10% difference. See appendix for the abbreviations.
| structures | average trace | SD of trace | sample size | average FA | SD of FA | sample size |
|---|---|---|---|---|---|---|
| ACR | 4.27 | 0.216 | 16 | 0.274 | 0.010 | 10 |
| ALIC | 3.53 | 0.164 | 14 | 0.304 | 0.009 | 8 |
| CC | 4.15 | 0.135 | 10 | 0.359 | 0.013 | 10 |
| CGC | 3.74 | 0.151 | 12 | 0.299 | 0.010 | 10 |
| CGH | 3.78 | 0.162 | 12 | 0.296 | 0.016 | 18 |
| CP | 3.58 | 0.140 | 12 | 0.342 | 0.016 | 14 |
| EC | 3.66 | 0.143 | 12 | 0.290 | 0.015 | 16 |
| Fx | 3.96 | 0.135 | 10 | 0.331 | 0.028 | 41 |
| IFO | 3.69 | 0.137 | 10 | 0.298 | 0.011 | 10 |
| PCR | 3.94 | 0.178 | 14 | 0.325 | 0.012 | 10 |
| PLIC | 3.17 | 0.149 | 14 | 0.410 | 0.020 | 16 |
| PTR | 4.15 | 0.190 | 14 | 0.307 | 0.013 | 12 |
| RLIC | 3.57 | 0.189 | 18 | 0.336 | 0.020 | 20 |
| SCR | 3.99 | 0.233 | 20 | 0.311 | 0.010 | 8 |
| SFO | 3.93 | 0.226 | 20 | 0.273 | 0.010 | 10 |
| SLF | 4.39 | 0.166 | 10 | 0.278 | 0.016 | 20 |
| SS | 4.19 | 0.191 | 14 | 0.294 | 0.016 | 18 |
| ST | 3.74 | 0.117 | 8 | 0.325 | 0.016 | 16 |
| TAP | 4.56 | 0.097 | 6 | 0.290 | 0.016 | 18 |
| UNC | 3.65 | 0.158 | 14 | 0.283 | 0.014 | 16 |
| Cau | 3.76 | 0.135 | 10 | 0.142 | 0.025 | 192 |
| GP | 3.32 | 0.140 | 12 | 0.181 | 0.038 | 238 |
| Put | 3.35 | 0.127 | 10 | 0.158 | 0.030 | 190 |
| Thal | 3.3 | 0.133 | 12 | 0.195 | 0.014 | 30 |
Discussion
Multi-contrast-based atlas for neonatal brain normalization studies
The atlases created in this paper contain three types of MR contrasts: T1-weighted; T2- weighted; and DTI. This enabled us to perform not only the DTI-based studies described in this paper, but also T1- or T2- weighted image-based normalization studies. There are studies about the effects of the atlas sharpness and the elasticity of the transformation (warp regularization), which suggest that better normalization accuracy can be achieved by the proper choice of atlas sharpness and warp regularization(Van Leemput, 2009; Yeo et al., 2008) . To respond to the various transformation methods with various warp regularizations used in the neuroimaging studies, we created two types of the group-averaged atlases and a single-subject atlas.
JHU-neonate-linear
This atlas was created by linearly averaging MRI data from 20 neonates (DTI and T2-weighted image) and 14 neonates (T1-weighted image). Since this linear transformation is not based on a single representative template, the shape and size represent average features of neonate brains. A group-averaged MRI template based on linear transformation has been widely used as a template for both linear and nonlinear normalizations (Mazziotta et al., 2001; Mazziotta et al., 1995).
JHU-neonate-nonlinear
Researchers have attempted to create templates based on nonlinear transformation because such templates provide a sharper contrast for each brain structure than that of linear transformation-based templates. This may possibly improve the registration accuracy, even though the choice depends on the study design. Therefore, we also created a nonlinear transformation-based template so that researchers can use the template of their choice. This could be a valuable template if nonlinear transformation with isotropic spatial smoothing is used. A traditional pair-wise approach was used to create the JHU-neonate nonlinear atlas. This method is intuitive, and is commonly used for atlas creation. On the other hand, the shortcoming of using a pair-wise approach is that, even after averaging of the normalized images, the averaged image is still inevitably biased by the selected single-subject image that was used as the template. To avoid this bias, group-wise registration methods have been developed (Bhatia et al., 2004). However, we still adopted a pair-wise approach, because we needed to use the resultant JHU-neonate nonlinear atlas to guide the manual parcellation of the deep white matter structures, as mentioned in the next paragraph. In addition, we intended to keep the consistency between group averaged atlas and the single subject atlas.
JHU-neonate-SS
When using highly nonlinear normalizations without isotropic spatial smoothing, our experience has shown that the blurred anatomical definitions in the group-averaged template could confuse the transformation process (Oishi et al., 2009). This prompted us to construct the single-subject MRI atlas. Compared to the group-averaged atlases, the advantage of the single-subject atlas is that it contains sharp definitions of anatomical structures. In particular, the structures near brain surface cannot be appreciated in group-averaged atlases since those structures are highly variable across individuals. However, this can also be a disadvantage of the single-subject atlas since it contains anatomical features that exist only in the arbitrarily selected subject. Therefore, to create the parcellation map of the white matter, we selected only the structures with less variability that could be appreciated even in the JHU-neonate-nonlinear atlas. One idea about creating an unbiased atlas with the image sharpness comparable to the single-subject atlas is to create a Bayesian template (Ma et al., 2008) from a large number of neonatal images, which will be the focus of our future study.
Accuracy of the registration
It was essential to determine the accuracy of the atlas-based anatomical segmentation. We used the parcellation map of the JHU-neonate-SS and compared the segmentation results to manual-based delineation. The average Dice measure was 0.82 +/− 0.061 (40 post-conceptional weeks) and 0.82 +/− 0.058 (49–52 post-conceptional weeks), while the average Dice of the manual method was 0.82 +/− 0.075. The average L1 error was 0.15 +/- 0.045 (40 post-conceptional weeks) and 0.15 +/− 0.041 (49–52 post-conceptional weeks), while the average L1 error of the manual method was 0.15 +/− 0.051. Thus, the accuracy of the atlas-based anatomical segmentation achieved the same accuracy as manual segmentation. However, this level of accuracy was achieved for normal subjects and may not hold for pathological brains. If mis-registration occurs due to severe brain abnormality, the automated segmentation may report erroneous results for FA and MD measurements. Therefore, it is essentialto carefully interpret the results.
DTI measurements of normal neonate brain
Analysis of neonate brains is expected to have a significant value for future assessment of various abnormalities at birth. If we can establish a quantitative tool to evaluate the anatomies of these abnormalities, and compare them with normal values, it is expected to complement the routine, qualitative evaluation of the images.
Based on the MRI atlas developed in this study, we characterized DTI parameter changes during the normal brain development process within three months after birth. Myelination processes have been studied in postmortem tissue (Yakovlev and Lecours, 1967) and, recently, with MRI (Berman et al., 2005; Cascio et al., 2007; Dubois et al., 2008; Dubois et al., 2006; Gao et al., 2009; Huppi et al., 1998; Lobel et al., 2009; Neil et al., 1998; Partridge et al., 2005; Paus et al., 2001; Provenzale et al., 2007). The result of this study is congruent with these studies that indicate a basic pattern to the maturation process, such as an FA increase and an MD decrease with age, and a posterior-to-anterior and a central-to-peripheral direction of maturation. We also found several patterns of the relationship among the MD and FA at 40 post-conceptional weeks, age-dependent FA increasing slope, and the age-dependent MD decreasing slope. Namely, we observed that in the more superior locations, the MD was higher and decreased faster with age in the corticofugal pathway (i.e., the superior corona radiata > the posterior limb of internal capsule > the cerebral peduncle), and in the more anterior regions, the MD was higher and decreased faster with age in the corona radiata (the anterior portion > the superior portion > the posterior portion). These tendencies seen in MD were not observed in the FA analysis, especially for the structures with rich crossing fibers, such as the corona radiata. Our analysis suggested that the time-dependent FA changes may provide more information about the development of the crossing fibers, compared with the time-dependent MD change. However, this is outside the scope of this paper and requires further longitudinal investigations.
When interpreting the regional FA values based on the proposed method, care must be taken because FA is the primary contrast that drives the registration of the parcellation map. For example, if a white matter region has abnormally low FA, it could lead to a reduction in the size of the segmentation, while the FA value remains unchanged. Any changes in segmented volumes and FA values must be carefully interpreted.
Potential for future research and clinical applications
The novel aspect of this study is that our measurement is based on 3D regions-of-interest placed by a fully automated method to evaluate the entire brain. This is important for clinical and research application studies since manual drawing of 3D regions-of-interest is prohibitively labor-intensive and subjectivity is difficult to avoid. In addition, our atlas covers as many as 22 brainstem and cerebellar structures, 38 cerebral white matter structures, 10 deep gray matter structures, and 52 cerebral cortical structures, for a total of 122 structures bilaterally. The proposed method is, thus, suitable for quantitative screening of abnormal brain regions.
From the normal-term neonate dataset, we estimated the statistical power required to detect abnormalities using the combination of the JHU-neonate-SS and LDDMM. The required number was adequate to detect a subtle alteration in MD and FA in most of the core white matter areas. This is important for research planning since we can reduce the number of scans required to test research hypotheses. However, note that FA is not suitable to detect alterations of the basal ganglia, because approximately 200 subjects would be required to detect a 10% alteration. Instead, we recommend using MD, which requires only 10–12 subjects to test hypotheses.
Future applications of this atlas include scientific investigations, such as determining the effects of prenatal events (ischemia, infections, or exposure to toxic substances) and the effects of preterm birth or low birth weight. This method enables us to perform whole-brain analysis, which is important to visualize structural specificity, but was lacking in previous studies. These basic studies will lead to more clinical investigations, such as seeking imaging biomarkers for various neurological disorders. Another future direction is to optimize the normalization approach. The tensor based or vector based normalization could potentially improve the registration accuracy.
In summary, we developed neonatal brain atlases for atlas -based, whole-brain analysis. Combined with a highly elastic nonlinear transformation, the entire brain was three-dimensionally parcellated into122 regions. This automated approach is fast and avoids the subjectivity associated with manually drawn ROIs. The accuracy level of our approach was measured using normal subjects and was comparable to the reliability level of human raters. This tool is expected to be applied for whole-brain screening to detect developmental abnormalities. The atlases developed in this study are now available for downloading from our website (http://lbam.med.jhmi.edu/ or www.mri.kennedykrieger.org). The software programs used in this study are also available (www.MriStudio.orgor www.mri.kennedykrieger.org).
Acknowledgments
The authors thank Dr. Jon Skranes of the Norwegian University of Science and Technology for helpful suggestions, and Ms. Mary McAllister for help with manuscript editing. This publication was made possible by grants from the National Institutes of Health [R21AG033774, AG20012, and P50AG05146 from the National Institute of Aging (NIA), U54NS NS56883 from the National Institute of Neurological Disorders and Strokes (NINDS), 2K24DA16170 from the National Institute on Drug Abuse (NIDA), and P41 RR015241 and G12-RR003061 from the National Center for Research Resources (NCRR)]. The contents of the paper are solely the responsibility of the authors and do not necessarily represent the official view of NIA, NCRR, or NIH. Dr. van Zijl is a paid lecturer for Philips Medical Systems and is the inventor of technology that is licensed to Philips. This arrangement has been approved by Johns Hopkins University in accordance with its conflict of interest policies.
Footnotes
Publisher's Disclaimer: This is a PDF file of an unedited manuscript that has been accepted for publication. As a service to our customers we are providing this early version of the manuscript. The manuscript will undergo copyediting, typesetting, and review of the resulting proof before it is published in its final citable form. Please note that during the production process errors may be discovered which could affect the content, and all legal disclaimers that apply to the journal pertain.
References
- Als H, Duffy FH, McAnulty GB, Rivkin MJ, Vajapeyam S, Mulkern RV, Warfield SK, Huppi PS, Butler SC, Conneman N, Fischer C, Eichenwald EC. Early experience alters brain function and structure. Pediatrics. 2004;113:846–857. doi: 10.1542/peds.113.4.846. [DOI] [PubMed] [Google Scholar]
- Anjari M, Srinivasan L, Allsop JM, Hajnal JV, Rutherford MA, Edwards AD, Counsell SJ. Diffusion tensor imaging with tract-based spatial statistics reveals local white matter abnormalities in preterm infants. Neuroimage. 2007;35:1021–1027. doi: 10.1016/j.neuroimage.2007.01.035. [DOI] [PubMed] [Google Scholar]
- Aubert-Broche B, Evans AC, Collins L. A new improved version of the realistic digital brain phantom. Neuroimage. 2006;32:138–145. doi: 10.1016/j.neuroimage.2006.03.052. [DOI] [PubMed] [Google Scholar]
- Bammer R, Keeling SL, Auer M, Pruessmann KP, Roeschmann P, Stollberger R, Hartung HP, Fazekas F. Diffusion tensor imaging using SENSE-single-shot EPI. International Society of Magnetic Resonance in Medicine; Glasgow: 2001. p. 160. [Google Scholar]
- Beaulieu C. The basis of anisotropic water diffusion in the nervous system - a technical review. NMR Biomed. 2002;15:435–455. doi: 10.1002/nbm.782. [DOI] [PubMed] [Google Scholar]
- Beg MF, Miller MI, Trouvé A, Younes L. Computing Large Deformation Metric Mappings via Geodesic Flows of Diffeomorphisms. International Journal of Computer Vision. 2005;61:18. [Google Scholar]
- Berman JI, Mukherjee P, Partridge SC, Miller SP, Ferriero DM, Barkovich AJ, Vigneron DB, Henry RG. Quantitative diffusion tensor MRI fiber tractography of sensorimotor white matter development in premature infants. Neuroimage. 2005;27:862–871. doi: 10.1016/j.neuroimage.2005.05.018. [DOI] [PubMed] [Google Scholar]
- Bhatia K, Hajnal J, Puri B, Edwards AD, Rueckert D. Consistent Groupwise Non-Rigid Registration for Atlas Construction. IEEE International Symposium on Biomedical Imaging; IEEE; 2004. [Google Scholar]
- Blauw-Hospers CH, Hadders-Algra M. A systematic review of the effects of early intervention on motor development. Dev Med Child Neurol. 2005;47:421–432. doi: 10.1017/s0012162205000824. [DOI] [PubMed] [Google Scholar]
- Cascio CJ, Gerig G, Piven J. Diffusion tensor imaging: Application to the study of the developing brain. J Am Acad Child Adolesc Psychiatry. 2007;46:213–223. doi: 10.1097/01.chi.0000246064.93200.e8. [DOI] [PubMed] [Google Scholar]
- Ceritoglu C, Oishi K, Li X, Chou MC, Younes L, Albert M, Lyketsos C, van Zijl PC, Miller MI, Mori S. Multi-contrast large deformation diffeomorphic metric mapping for diffusion tensor imaging. Neuroimage. 2009 doi: 10.1016/j.neuroimage.2009.04.057. [DOI] [PMC free article] [PubMed] [Google Scholar]
- Collins DL, Zijdenbos AP, Kollokian V, Sled JG, Kabani NJ, Holmes CJ, Evans AC. Design and construction of a realistic digital brain phantom. IEEE Trans Med Imaging. 1998;17:463–468. doi: 10.1109/42.712135. [DOI] [PubMed] [Google Scholar]
- D'Angio CT, Sinkin RA, Stevens TP, Landfish NK, Merzbach JL, Ryan RM, Phelps DL, Palumbo DR, Myers GJ. Longitudinal, 15 -year follow-up of children born at less than 29 weeks' gestation after introduction of surfactant therapy into a region: neurologic, cognitive, and educational outcomes. Pediatrics. 2002;110:1094–1102. doi: 10.1542/peds.110.6.1094. [DOI] [PubMed] [Google Scholar]
- De Vries LS, Groenendaal F, van Haastert IC, Eken P, Rademaker KJ, Meiners LC. Asymmetrical myelination of the posterior limb of the internal capsule in infants with periventricular haemorrhagic infarction: an early predictor of hemiplegia. Neuropediatrics. 1999;30:314–319. doi: 10.1055/s-2007-973511. [DOI] [PubMed] [Google Scholar]
- Dubois J, Dehaene-Lambertz G, Perrin M, Mangin JF, Cointepas Y, Duchesnay E, Le Bihan D, Hertz-Pannier L. Asynchrony of the early maturation of white matter bundles in healthy infants: quantitative landmarks revealed noninvasively by diffusion tensor imaging. Hum Brain Mapp. 2008;29:14–27. doi: 10.1002/hbm.20363. [DOI] [PMC free article] [PubMed] [Google Scholar]
- Dubois J, Hertz-Pannier L, Dehaene-Lambertz G, Cointepas Y, Le Bihan D. Assessment of the early organization and maturation of infants' cerebral white matter fiber bundles: a feasibility study using quantitative diffusion tensor imaging and tractography. Neuroimage. 2006;30:1121–1132. doi: 10.1016/j.neuroimage.2005.11.022. [DOI] [PubMed] [Google Scholar]
- Faul F, Erdfelder E, Lang AG, Buchner A. G*Power 3: a flexible statistical power analysis program for the social, behavioral, and biomedical sciences. Behav Res Methods. 2007;39:175–191. doi: 10.3758/bf03193146. [DOI] [PubMed] [Google Scholar]
- Fonov V, Evans AC, Botteron K, Almli CR, McKinstry RC, Collins DL. Unbiased average age-appropriate atlases for pediatric studies. Neuroimage. 2010 doi: 10.1016/j.neuroimage.2010.07.033. [DOI] [PMC free article] [PubMed] [Google Scholar]
- Gao W, Lin W, Chen Y, Gerig G, Smith JK, Jewells V, Gilmore JH. Temporal and spatial development of axonal maturation and myelination of white matter in the developing brain. AJNR Am J Neuroradiol. 2009;30:290–296. doi: 10.3174/ajnr.A1363. [DOI] [PMC free article] [PubMed] [Google Scholar]
- Goodlett CB, Fletcher PT, Gilmore JH, Gerig G. Group analysis of DTI fiber tract statistics with application to neurodevelopment. Neuroimage. 2009;45:S133–142. doi: 10.1016/j.neuroimage.2008.10.060. [DOI] [PMC free article] [PubMed] [Google Scholar]
- Hack M, Fanaroff AA. Outcomes of children of extremely low birthweight and gestational age in the 1990's. Early Hum Dev. 1999;53:193–218. doi: 10.1016/s0378-3782(98)00052-8. [DOI] [PubMed] [Google Scholar]
- Hack M, Wilson-Costello D, Friedman H, Taylor GH, Schluchter M, Fanaroff AA. Neurodevelopment and predictors of outcomes of children with birth weights of less than 1000 g: 1992–1995. Arch Pediatr Adolesc Med. 2000;154:725–731. doi: 10.1001/archpedi.154.7.725. [DOI] [PubMed] [Google Scholar]
- Hayakawa K, Kanda T, Hashimoto K, Okuno Y, Yamori Y, Yuge M, Ando R, Ozaki N, Tamamoto A. MR imaging of spastic diplegia. The importance of corpus callosum. Acta Radiol. 1996;37:830–836. doi: 10.1177/02841851960373P279. [DOI] [PubMed] [Google Scholar]
- Holmes CJ, Hoge R, Collins L, Woods R, Toga AW, Evans AC. Enhancement of MR images using registration for signal averaging. J Comput Assist Tomogr. 1998;22:324–333. doi: 10.1097/00004728-199803000-00032. [DOI] [PubMed] [Google Scholar]
- Huang H, Ceritoglu C, Li X, Qiu A, Miller MI, van Zijl PC, Mori S. Correction of B0 susceptibility induced distortion in diffusion-weighted images using large-deformation diffeomorphic metric mapping. Magn Reson Imaging. 2008 doi: 10.1016/j.mri.2008.03.005. [DOI] [PMC free article] [PubMed] [Google Scholar]
- Huang H, Zhang J, Wakana S, Zhang W, Ren T, Richards LJ, Yarowsky P, Donohue P, Graham E, van Zijl PC, Mori S. White and gray matter development in human fetal, newborn and pediatric brains. Neuroimage. 2006;33:27–38. doi: 10.1016/j.neuroimage.2006.06.009. [DOI] [PubMed] [Google Scholar]
- Huppi PS, Maier SE, Peled S, Zientara GP, Barnes PD, Jolesz FA, Volpe JJ. Microstructural development of human newborn cerebral white matter assessed in vivo by diffusion tensor magnetic resonance imaging. Pediatr Res. 1998;44:584–590. doi: 10.1203/00006450-199810000-00019. [DOI] [PubMed] [Google Scholar]
- Inder TE, Warfield SK, Wang H, Huppi PS, Volpe JJ. Abnormal cerebral structure is present at term in premature infants. Pediatrics. 2005;115:286–294. doi: 10.1542/peds.2004-0326. [DOI] [PubMed] [Google Scholar]
- Jaermann T, Crelier G, Pruessmann KP, Golay X, Netsch T, van Muiswinkel AM, Mori S, van Zijl PC, Valavanis A, Kollias S, Boesiger P. SENSE-DTI at 3 T. Magn Reson Med. 2004;51:230–236. doi: 10.1002/mrm.10707. [DOI] [PubMed] [Google Scholar]
- Jiang H, van Zijl PC, Kim J, Pearlson GD, Mori S. DtiStudio: resource program for diffusion tensor computation and fiber bundle tracking. Comput Methods Programs Biomed. 2006;81:106–116. doi: 10.1016/j.cmpb.2005.08.004. [DOI] [PubMed] [Google Scholar]
- Jones DK, Horsfield MA, Simmons A. Optimal strategies for measuring diffusion in anisotropic systems by magnetic resonance imaging. Magn Reson Med. 1999;42:515–525. [PubMed] [Google Scholar]
- Kazemi K, Ghadimi S, Abrishami-Moghaddam H, Grebe R, Gondry-Jouet C, Wallois F. Neonatal probabilistic models for brain, CSF and skull using T1-MRI data: preliminary results. Conf Proc IEEE Eng Med Biol Soc. 2008;2008:3892–3895. doi: 10.1109/IEMBS.2008.4650060. [DOI] [PubMed] [Google Scholar]
- Kazemi K, Moghaddam HA, Grebe R, Gondry-Jouet C, Wallois F. A neonatal atlas template for spatial normalization of whole-brain magnetic resonance images of newborns: preliminary results. Neuroimage. 2007;37:463–473. doi: 10.1016/j.neuroimage.2007.05.004. [DOI] [PubMed] [Google Scholar]
- Lobel U, Sedlacik J, Gullmar D, Kaiser WA, Reichenbach JR, Mentzel HJ. Diffusion tensor imaging: the normal evolution of ADC, RA, FA, and eigenvalues studied in multiple anatomical regions of the brain. Neuroradiology. 2009;51:253–263. doi: 10.1007/s00234-008-0488-1. [DOI] [PubMed] [Google Scholar]
- Lorenzen P, Prastawa M, Davis B, Gerig G, Bullitt E, Joshi S. Multi-modal image set registration and atlas formation. Med Image Anal. 2006;10:440–451. doi: 10.1016/j.media.2005.03.002. [DOI] [PMC free article] [PubMed] [Google Scholar]
- Ma J, Miller MI, Trouve A, Younes L. Bayesian template estimation in computational anatomy. Neuroimage. 2008;42:252–261. doi: 10.1016/j.neuroimage.2008.03.056. [DOI] [PMC free article] [PubMed] [Google Scholar]
- Makris N, Worth AJ, Sorensen AG, Papadimitriou GM, Wu O, Reese TG, Wedeen VJ, Davis TL, Stakes JW, Caviness VS, Kaplan E, Rosen BR, Pandya DN, Kennedy DN. Morphometry of in vivo human white matter association pathways with diffusion-weighted magnetic resonance imaging. Ann Neurol. 1997;42:951–962. doi: 10.1002/ana.410420617. [DOI] [PubMed] [Google Scholar]
- Marlow N. Neurocognitive outcome after very preterm birth. Arch Dis Child Fetal Neonatal Ed. 2004;89:F224–228. doi: 10.1136/adc.2002.019752. [DOI] [PMC free article] [PubMed] [Google Scholar]
- Mazziotta J, Toga A, Evans A, Fox P, Lancaster J, Zilles K, Woods R, Paus T, Simpson G, Pike B, Holmes C, Collins L, Thompson P, MacDonald D, Iacoboni M, Schormann T, Amunts K, Palomero-Gallagher N, Geyer S, Parsons L, Narr K, Kabani N, Le Goualher G, Boomsma D, Cannon T, Kawashima R, Mazoyer B. A probabilistic atlas and reference system for the human brain: International Consortium for Brain Mapping (ICBM) Philos Trans R Soc Lond B Biol Sci. 2001;356:1293–1322. doi: 10.1098/rstb.2001.0915. [DOI] [PMC free article] [PubMed] [Google Scholar]
- Mazziotta JC, Toga AW, Evans A, Fox P, Lancaster J. A probabilistic atlas of the human brain: theory and rationale for its development. The International Consortium for Brain Mapping (ICBM) Neuroimage. 1995;2:89–101. doi: 10.1006/nimg.1995.1012. [DOI] [PubMed] [Google Scholar]
- Miller MI, Trouvé A, Younes L. Geodesic shooting for computational anatomy. J Math Imaging Vis. 2006;24:209–222. doi: 10.1007/s10851-005-3624-0. [DOI] [PMC free article] [PubMed] [Google Scholar]
- Mori S, Oishi K, Jiang H, Jiang L, Li X, Akhter K, Hua K, Faria AV, Mahmood A, Woods R, Toga AW, Pike GB, Neto PR, Evans A, Zhang J, Huang H, Miller MI, van Zijl P, Mazziotta J. Stereotaxic white matter atlas based on diffusion tensor imaging in an ICBM template. Neuroimage. 2008;40:570–582. doi: 10.1016/j.neuroimage.2007.12.035. [DOI] [PMC free article] [PubMed] [Google Scholar]
- Mori S, Wakana S, Nagae-Poetscher LM, van Zijl PC. MRI atlas of human white matter. Elsevier; Amsterdam, The Netherlands: 2005. [Google Scholar]
- Mori S, Zhang J. Principles of diffusion tensor imaging and its applications to basic neuroscience research. Neuron. 2006;51:527–539. doi: 10.1016/j.neuron.2006.08.012. [DOI] [PubMed] [Google Scholar]
- Mukherjee P, Miller JH, Shimony JS, Philip JV, Nehra D, Snyder AZ, Conturo TE, Neil JJ, McKinstry RC. Diffusion-tensor MR imaging of gray and white matter development during normal human brain maturation. AJNR Am J Neuroradiol. 2002;23:1445–1456. [PMC free article] [PubMed] [Google Scholar]
- Neil JJ, Shiran SI, McKinstry RC, Schefft GL, Snyder AZ, Almli CR, Akbudak E, Aronovitz JA, Miller JP, Lee BC, Conturo TE. Normal brain in human newborns: apparent diffusion coefficient and diffusion anisotropy measured by using diffusion tensor MR imaging. Radiology. 1998;209:57–66. doi: 10.1148/radiology.209.1.9769812. [DOI] [PubMed] [Google Scholar]
- Oishi K, Faria A, Jiang H, Li X, Akhter K, Zhang J, Hsu JT, Miller MI, van Zijl PC, Albert M, Lyketsos CG, Woods R, Toga AW, Pike GB, Rosa-Neto P, Evans A, Mazziotta J, Mori S. Atlas-based whole brain white matter analysis using large deformation diffeomorphic metric mapping: application to normal elderly and Alzheimer's disease participantstlas. Neuroimage. 2009;46:486–499. doi: 10.1016/j.neuroimage.2009.01.002. [DOI] [PMC free article] [PubMed] [Google Scholar]
- Oishi K, Zilles K, Amunts K, Faria A, Jiang H, Li X, Akhter K, Hua K, Woods R, Toga AW, Pike GB, Rosa–Neto P, Evans A, Zhang J, Huang H, Miller MI, van Zijl PC, Mazziotta J, Mori S. Human brain white matter atlas: identification and assignment of common anatomical structures in superficial white matter. Neuroimage. 2008;43:447–457. doi: 10.1016/j.neuroimage.2008.07.009. [DOI] [PMC free article] [PubMed] [Google Scholar]
- Pajevic S, Pierpaoli C. Color schemes to represent the orientation of anisotropic tissues from diffusion tensor data: application to white matter fiber tract mapping in the human brain. Magn Reson Med. 1999;42:526–540. [PubMed] [Google Scholar]
- Partridge SC, Mukherjee P, Berman JI, Henry RG, Miller SP, Lu Y, Glenn OA, Ferriero DM, Barkovich AJ, Vigneron DB. Tractography-based quantitation of diffusion tensor imaging parameters in white matter tracts of preterm newborns. J Magn Reson Imaging. 2005;22:467–474. doi: 10.1002/jmri.20410. [DOI] [PubMed] [Google Scholar]
- Paus T, Collins DL, Evans AC, Leonard G, Pike B, Zijdenbos A. Maturation of white matter in the human brain: a review of magnetic resonance studies. Brain Res Bull. 2001;54:255–266. doi: 10.1016/s0361-9230(00)00434-2. [DOI] [PubMed] [Google Scholar]
- Perlman JM. Neurobehavioral deficits in premature graduates of intensive care--potential medical and neonatal environmental risk factors. Pediatrics. 2001;108:1339–1348. doi: 10.1542/peds.108.6.1339. [DOI] [PubMed] [Google Scholar]
- Pierpaoli C, Barnett A, Pajevic S, Chen R, Penix LR, Virta A, Basser P. Water diffusion changes in Wallerian degeneration and their dependence on white matter architecture. Neuroimage. 2001;13:1174–1185. doi: 10.1006/nimg.2001.0765. [DOI] [PubMed] [Google Scholar]
- Pierpaoli C, Basser PJ. Toward a quantitative assessment of diffusion anisotropy. Magn Reson Med. 1996;36:893 –906. doi: 10.1002/mrm.1910360612. [DOI] [PubMed] [Google Scholar]
- Provenzale JM, Liang L, DeLong D, White LE. Diffusion tensor imaging assessment of brain white matter maturation during the first postnatal year. AJR Am J Roentgenol. 2007;189:476–486. doi: 10.2214/AJR.07.2132. [DOI] [PubMed] [Google Scholar]
- Pruessmann KP, Weiger M, Scheidegger MB, Boesiger P. SENSE: sensitivity encoding for fast MRI. Magn Reson Med. 1999;42:952–962. [PubMed] [Google Scholar]
- Ramenghi LA, Rutherford M, Fumagalli M, Bassi L, Messner H, Counsell S, Mosca F. Neonatal neuroimaging: Going beyond the pictures. Early Hum Dev. 2009 doi: 10.1016/j.earlhumdev.2009.08.022. [DOI] [PubMed] [Google Scholar]
- Ratnanather JT, Wang L, Nebel MB, Hosakere M, Han X, Csernansky JG, Miller MI. Validation of semiautomated methods for quantifying cingulate cortical metrics in schizophrenia. Psychiatry Res. 2004;132:53–68. doi: 10.1016/j.pscychresns.2004.07.003. [DOI] [PubMed] [Google Scholar]
- Roelants-van Rijn AM, Groenendaal F, Beek FJ, Eken P, van Haastert IC, de Vries LS. Parenchymal brain injury in the preterm infant: comparison of cranial ultrasound, MRI and neurodevelopmental outcome. Neuropediatrics. 2001;32:80–89. doi: 10.1055/s-2001-13875. [DOI] [PubMed] [Google Scholar]
- Shah DK, Guinane C, August P, Austin NC, Woodward LJ, Thompson DK, Warfield SK, Clemett R, Inder TE. Reduced occipital regional volumes at term predict impaired visual function in early childhood in very low birth weight infants. Invest Ophthalmol Vis Sci. 2006;47:3366–3373. doi: 10.1167/iovs.05-0811. [DOI] [PubMed] [Google Scholar]
- Shi F, Fan Y, Tang S, Gilmore JH, Lin W, Shen D. Neonatal brain image segmentation in longitudinal MRI studies. Neuroimage. 2009 doi: 10.1016/j.neuroimage.2009.07.066. [DOI] [PMC free article] [PubMed] [Google Scholar]
- Shi F, Yap PT, Fan Y, Gilmore JH, Lin W, Shen D. Construction of multi-region-multi-reference atlases for neonatal brain MRI segmentation. Neuroimage. 2010 doi: 10.1016/j.neuroimage.2010.02.025. [DOI] [PMC free article] [PubMed] [Google Scholar]
- Talairach J, Tournoux P. Co-planar stereotaxic atlas of the human brain: 3-dimensional proportional system : an approach to cerebral imaging. Thieme; 1988. [Google Scholar]
- Van Leemput K. Encoding probabilistic brain atlases using Bayesian inference. IEEE Trans Med Imaging. 2009;28:822–837. doi: 10.1109/TMI.2008.2010434. [DOI] [PMC free article] [PubMed] [Google Scholar]
- Vohr BR, Wright LL, Dusick AM, Mele L, Verter J, Steichen JJ, Simon NP, Wilson DC, Broyles S, Bauer CR, Delaney-Black V, Yolton KA, Fleisher BE, Papile LA, Kaplan MD. Neurodevelopmental and functional outcomes of extremely low birth weight infants in the National Institute of Child Health and Human Development Neonatal Research Network, 1993–1994. Pediatrics. 2000;105:1216–1226. doi: 10.1542/peds.105.6.1216. [DOI] [PubMed] [Google Scholar]
- Wilke M, Holland SK, Altaye M, Gaser C. Template-O-Matic: a toolbox for creating customized pediatric templates. Neuroimage. 2008;41:903–913. doi: 10.1016/j.neuroimage.2008.02.056. [DOI] [PubMed] [Google Scholar]
- Wilke M, Schmithorst VJ, Holland SK. Normative pediatric brain data for spatial normalization and segmentation differs from standard adult data. Magn Reson Med. 2003;50:749–757. doi: 10.1002/mrm.10606. [DOI] [PubMed] [Google Scholar]
- Wilson-Costello D, Friedman H, Minich N, Fanaroff AA, Hack M. Improved survival rates with increased neurodevelopmental disability for extremely low birth weight infants in the 1990s. Pediatrics. 2005;115:997–1003. doi: 10.1542/peds.2004-0221. [DOI] [PubMed] [Google Scholar]
- Woods RP, Grafton ST, Holmes CJ, Cherry SR, Mazziotta JC. Automated image registration: I. General methods and intrasubject, intramodality validation. J Comput Assist Tomogr. 1998;22:139–152. doi: 10.1097/00004728-199801000-00027. [DOI] [PubMed] [Google Scholar]
- Woodward LJ, Anderson PJ, Austin NC, Howard K, Inder TE. Neonatal MRI to predict neurodevelopmental outcomes in preterm infants. N Engl J Med. 2006;355:685–694. doi: 10.1056/NEJMoa053792. [DOI] [PubMed] [Google Scholar]
- Xu D, Mori S, Shen D, van Zijl PC, Davatzikos C. Spatial normalization of diffusion tensor fields. Magn Reson Med. 2003;50:175–182. doi: 10.1002/mrm.10489. [DOI] [PubMed] [Google Scholar]
- Yakovlev PI, Lecours AR. Regional development of the brain in early life. F.A. Davis; Philadelphia, PA: 1967. [Google Scholar]
- Yeo BT, Sabuncu MR, Desikan R, Fischl B, Golland P. Effects of registration regularization and atlas sharpness on segmentation accuracy. Med Image Anal. 2008;12:603–615. doi: 10.1016/j.media.2008.06.005. [DOI] [PMC free article] [PubMed] [Google Scholar]
- Yoon U, Fonov VS, Perusse D, Evans AC. The effect of template choice on morphometric analysis of pediatric brain data. Neuroimage. 2009;45:769–777. doi: 10.1016/j.neuroimage.2008.12.046. [DOI] [PubMed] [Google Scholar]
- Zhang J, Evans A, Hermoye L, Lee SK, Wakana S, Zhang W, Donohue P, Miller MI, Huang H, Wang X, van Zijl PC, Mori S. Evidence of slow maturation of the superior longitudinal fasciculus in early childhood by diffusion tensor imaging. Neuroimage. 2007;38:239–247. doi: 10.1016/j.neuroimage.2007.07.033. [DOI] [PMC free article] [PubMed] [Google Scholar]