Abstract
The purpose of the present investigation was to encapsulate pure prednisolone (PRD) and PRD–hydroxypropyl-β-cyclodextrin (HPβCD) complex in cellulose-based matrix microspheres. The system simultaneously exploits complexation technique to enhance the solubility of low-solubility drug (pure PRD) and subsequent modulation of drug release from microspheres (MIC) at a predetermined time. The microspheres of various compositions were prepared by an oil-in-oil emulsion–solvent evaporation method. The effect of complexation and presence of cellulose polymers on entrapment efficiency, particle size, and drug release had been investigated. The solid-state characterization was performed by Fourier transform infrared spectroscopy, thermogravimetry, differential scanning calorimetry, and powder X-ray diffractometry. The morphology of MIC was examined by scanning electron microscopy. The in vitro drug release profiles from these microspheres showed the desired biphasic release behavior. After enhancing the solubility of prednisolone by inclusion into HPβCD, the drug release was easily modified in the microsphere formulation. It was also demonstrated that the CDs in these microspheres were able to modulate several properties such as morphology, drug loading, and release properties. The release kinetics of prednisolone from microspheres followed quasi-Fickian and first-order release mechanisms. In addition to this, the f2-metric technique was used to check the equivalency of dissolution profiles of the optimized formulation before and after stability studies, and it was found to be similar. A good outcome, matrix microspheres (coded as MIC5) containing PRD–HPβCD complex, showed sustained release of drug (95.81%) over a period of 24 h.
KEY WORDS: drug release, ethylcelluose, hydroxypropyl-β-cyclodextrin, hydroxypropyl methyl cellulose, prednisolone, solubility
INTRODUCTION
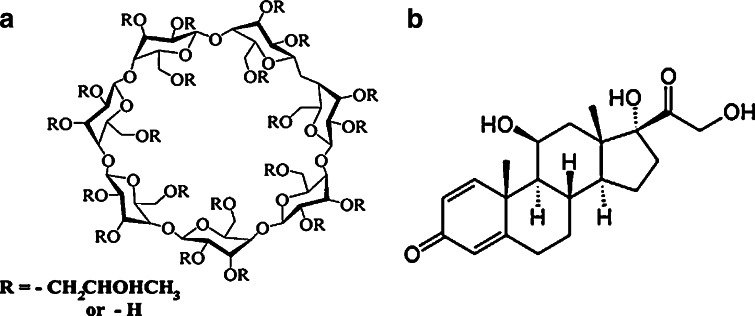
Entrapment of medicinal agents within polymeric microspheres is a unique technology which has been utilized by many formulation scientists in the recent past. This technology brightens the possibility of reduction of toxicity, enhancement of control over release activity, and maximization of the bioavailability of both soluble and insoluble drugs. Conventional dosage (oral) form does not usually provide any controlled release or target specificity because of its immediate release. Many shortcomings of the conventional dosage form may be overcome by microspheres technology. Considering the physicochemical properties of used chemicals, applied techniques, basic principles, and modulation/tailoring some of the properties of the chemicals, a formulation scientist can achieve a targeted pharmacological effect. Several ways have been explored for the development of effective prolonged drug delivery system, such as tablet (1), alginate beads (2), nanoparticles (3), microparticles (4), and liposomes (5). Among these systems, a multiple-unit system has been proven to be better than single-dosage forms as it has more predictable and reproducible gastrointestinal transit time and less local irritation/side effects (6). Various biocompatible polymers are currently in use, such as cellulose derivatives (7–10). Versatile uses of cyclodextrin have been reported earlier especially as a complexing agent and a drug release modulator (11). Cyclodextrin enhances the solubility of a poorly soluble guest molecule by fitting in lipophilic cavity. Recently, substituted cyclodextrins have received considerable attention (Fig. 1a) because of their better physiochemical properties than that of the natural counterpart (12). The problem of poor bioavailability and development of toxicity in the use of poorly soluble drug can be overcome by its complexation with substituted cyclodextrin (13,14).
Fig. 1.
Chemical structure of hydroxypropyl-β-cyclodextrin (a) and prednisolone (b)
Prednisolone (PRD), a glucocorticoid, is a highly potent anti-inflammatory and immunosuppressive drug (Fig. 1b). Additionally, it is used in substitution therapy for adrenal insufficiency. Even moderate doses of the drug, on repeated administration for a long period, causes many side effects such as diabetes, hypertension, Cushing’s syndrome, and osteoporosis (15). In spray drying technique, the effectiveness of cyclodextrin complexation to improve the solubility of PRD has been confirmed (16). Therefore, prednisolone is a good choice for improving solubility and developing a sustained drug delivery system. Long circulating liposomes of prednisolone phosphate markedly increase the biological activity and reduce side effects as compared to its solution (17,18). Teshima et al. (5) observed the plasma concentration of prednisolone after intravenous administration of liposomal palmitoyl prednisolone for a prolonged period. Berthold et al. (19) developed chitosan-based microspheres to adsorb prednisolone sodium phosphate at the interface of the microsphere. They reported a prolonged release of drug as it exhibits good adhesion of chitosan over the inflamed areas. Oosegi et al. (20) observed the absorption of prednisolone from chitosan–succinyl prednisolone microspheres in rats with trinitrobenzene sulfonic acid-induced colitis. Redmon et al. (21) compared the efficiency of two methods during the preparation of prednisolone-21-acetate poly(glycolic acid) microspheres. Akiyama et al. (22) had studied the effect of hydrophilic–lipophilic balance of polyglycerol ester of fatty acid (PGEF) on the release of prednisolone from the PGEF microspheres. With these, our aim concerns the development of matrix type microspheres loaded with PRD–hydroxypropyl-β-cyclodextrin (HPβCD) inclusion complex. To make it short, our objectives were: (a) the preparation of PRD–HPβCD complex by solvent evaporation method; (b) evaluation of various influences of the polymer matrix on the drug release and characterization of various aspects of MIC; and (c) verification of some properties of microsphere formulations such as surface texture, state change, and interaction between ingredients by instrumental analysis.
MATERIALS AND METHODS
The samples (given as gifts) were: prednisolone (Medopharm, India); ethyl cellulose (Signet Chemical Corporation Pvt. Ltd, India); HPβCD—molecular weight, 1,380 (Roquette, Lestren); and hydroxypropyl methylcellulose (HPMC) E15 (Colorcon Asia Pvt. Ltd, GAO, India).
Span 80 (Loba Chemie, Mumbai, India) and heavy liquid paraffin (Merck Specialties Pvt. Ltd, Mumbai, India) were purchased. All the reagents were of analytical grade.
Preparation of Prednisolone–Cyclodextrin Complex
Using HPβCD (carrier), solid dispersion of prednisolone was prepared by the solvent evaporation method. Accurately weighed amount of prednisolone (700 mg) and carrier (3,500 mg, 0.027:0.0362 molar ratio) were dissolved in 70 mL mixture of ethanol and water at a ratio of 7:3 (v/v). Then, the mixed solvent was evaporated under room temperature (25°C) for 48 h. After complete evaporation of solvent, solid dispersion was pulverized by a glass mortar and pestle. The 120-μm sieve fraction was then used for further studies. Actual drug content was found as 50 mg in 320 mg of solid dispersion (i.e., 15.62%) after its assay in a UV spectrophotometer.
Preparation of Microspheres
Various compositions of drug-loaded microspheres (Table I) were prepared by oil-in-oil (O/O) emulsion solvent evaporation method (4). To prepare prednisolone microspheres, 100 mg of PRD was dissolved in a 10 mL of mixture of chloroform and ethanol (1:1, v/v). The use of appropriate combination of solvents minimizes excess use of solvent. Next, weighed amount of polymers (ethyl cellulose and HPMC, E15), as shown in Table I, were added to it and stirred for 15 min in a magnetic stirrer and subsequently ultrasonicated (Takashi, Japan) for 5 min to make homogeneous dispersion. This dispersion was added dropwise to 125 mL of heavy liquid paraffin containing Span 80 at 2% (v/v). Span 80, a surfactant, acts as emulsifying agent. The resultant mixture was stirred at a speed of 1,000 rpm at room temperature for 3 h. After the formation of primary emulsion, the solvent present in the emulsion droplet diffuses into the continuous paraffin phase and gets evaporated (23). Heavy paraffin was used to retard the fast diffusion of solvent because slow diffusion facilitates bridging between the drug and polymer. To harden the microspheres, 25 mL of petroleum ether (non-solvent) was added to it, and the stirring was continued for the next 2 h. The hardened microspheres were collected by filtration and washed with 100 mL of petroleum ether and air-dried for 12 h. After washing with excess quantity of petroleum ether, microspheres turned from a pale yellow color to white. Later, the used petroleum ether was collected and recovered by a distillation process for reuse. The prepared matrix microspheres were found to be spherical, discrete, and well-defined in shape. These were designated as MIC1 and MIC2. A similar method was followed to prepare microspheres of prednisolone–HPβCD complex. Here, 320 mg complex containing 50 mg prednisolone was used to prepare the microspheres. The prepared microspheres were designated as MIC3 to MIC12.
Table I.
Compositions of MIC
| Type of MIC | Formulation code | Theoretical drug content (mg) | HPMC (mg) | EC (mg) | HPMC/EC ratio | Total amount of matrix polymers (mg) |
|---|---|---|---|---|---|---|
| MIC OF | MIC1 | 100 | 100 | 300 | 1:03 | 400 |
| PRD | MIC2 | 100 | – | 300 | NA | 300 |
| MIC of PRD–HPβCD Complexa | MIC3 | 50 | – | 300 | NA | 300 |
| MIC4 | 50 | 50 | 300 | 1:06 | 350 | |
| MIC5 | 50 | 100 | 300 | 1:03 | 400 | |
| MIC6 | 50 | 150 | 300 | 1:02 | 450 | |
| MIC7 | 50 | 50 | 400 | 1:08 | 450 | |
| MIC8 | 50 | 100 | 400 | 1:04 | 500 | |
| MIC9 | 50 | 300 | 100 | 3:01 | 400 | |
| MIC10 | 50 | 50 | 500 | 1:10 | 550 | |
| MIC11 | 50 | 100 | 500 | 1:05 | 600 | |
| MIC12 | 50 | 500 | 100 | 5:01 | 600 |
aPercent of drug in solid dispersion (complex) is 15.6%. Amount of complex was calculated as per the theoretical drug content (mg) of microsphere formulation
Characterization of Microspheres
Dried microspheres were accurately weighed and the yield calculated as a percentage using Eq. 1:
 |
1 |
A microsphere sample (50 mg) was pulverized and dissolved in 5 mL of methanol and diluted up to 50 mL with double distilled water in a volumetric flask, and then necessary dilution was made. Absorbance of the sample was noted at 247 nm and content of drug in microspheres determined. The material balance was calculated with respect to the drug content. Drug loading and encapsulation efficiency were determined in duplicate for all batches using Eqs. 2 and 3, respectively. Values were expressed as percentage:
 |
2 |
 |
3 |
Particle Size Determination by Microscopy
The particle size of the microspheres was determined using an optical microscopy method. Approximately 300 microspheres were taken on a glass slide and the particle size measured using a calibrated optical microscope (KYOWA Getner microscope, Tokyo) under regular polarized light.
In Vitro Release Studies
In vitro release studies were performed using the USP basket apparatus (TDT 06P Electrolab, India). MIC containing drug equivalent to 30 mg was added to 500 mL of the dissolution medium (pH 7.4, phosphate buffer), thermostated at 37 ± 0.5°C, and stirred at 50 rpm. At suitable time intervals, 5 mL samples were withdrawn from the dissolution vessels and immediately replaced with the same volume of the fresh dissolution medium. Samples were withdrawn from the dissolution medium at intervals of 1 h up to 12 and 24 h, and then the samples were filtered with a Whatman filter paper (pore size 11 μm) before assay. The filtrate was spectrometrically assayed for drug content at λmax 247 nm (ANALAB UV—180, spectrophotometer) (24). No interference in the measurement of the drug due to the presence of other ingredients was observed. The percent of drug released was plotted versus time. Each experiment was repeated three times.
The percent dissolution efficiency (%DE) was computed to compare the relative effect of various concentrations of polymer using MATLAB software. The percentage DE of a pharmaceutical dosage form is defined as the area under the dissolution curve up to a certain time, t, expressed as a percentage of the area of the rectangle described by 100% dissolution at the same time. The %DE can be calculated from
 |
where Y is the percent drug dissolved at time t.
Mathematical Modeling of Drug Release
In the design of the new drug delivery system, it is an essential task to characterize release data (in vitro) by various kinetics equations and empirical/semi-empirical models. These include the zero-order equation,  ; first-order equation,
  ; Hixon–Crowel’s cube root law,
  ; Higuchi’s model,
  ; and Korsmeyer–Peppas model or power law equation,
  (25–27). Here, M is cumulative amount of drug (%) at time t and k1–k4 are the release rate constants. In Korsmeyer–Peppas model Mt and M∞ are the amounts of drug released at time t and at equilibrium, respectively. In the present work, M∞ represents the total amount of drug incorporated in the microspheres, k5 is a constant related to the structural characteristics of the dosage form, and n is the diffusional exponent. Plots were made by fitting data into these equations, and kinetic parameters (k1–k4, n) and r2 values were obtained and listed in Table II. Data (r2, n) were analyzed to determine the drug release mechanism.
Table II.
Study of Kinetic Parameters by Fitting Release Data to Various Equations and Dissolution Efficiency
| Sample no. | Zero-order equation | First-order equation | Cube root law | Higuchi’s equation | Korsmeyer–Peppas | Dissolution efficiency | ||||||
|---|---|---|---|---|---|---|---|---|---|---|---|---|
| k 1 | r 2 | k 2 | r 2 | k 3 | r 2 | k 4 | r 2 | n a | r 2 | 1 h | 8 h | |
| MIC1 | 1.7494 | 0.6409 | 0.0556 | 0.8167 | 0.057 | 0.7588 | 11.494 | 0.8187 | 0.2616 | 0.9292 | 42.49 | 56.61 |
| MIC2 | 1.8574 | 0.932 | 0.0357 | 0.9845 | 0.044 | 0.9723 | 11.288 | 0.9948 | 0.3476 | 0.9953 | 23.01 | 32.31 |
| MIC3 | 1.8193 | 0.7799 | 0.047 | 0.9284 | 0.0528 | 0.8874 | 12.078 | 0.902 | 0.2898 | 0.9412 | 36.14 | 47.35 |
| MIC4 | 1.9433 | 0.8112 | 0.0538 | 0.9418 | 0.0585 | 0.9036 | 12.389 | 0.9527 | 0.2823 | 0.99 | 35.76 | 48.6 |
| MIC5 | 2.4017 | 0.812 | 0.1151 | 0.9987 | 0.1002 | 0.968 | 15.319 | 0.9546 | 0.3025 | 0.9911 | 39.78 | 55.19 |
| MIC6 | 2.0892 | 0.5987 | 0.2816b | 0.9902 | 0.2178 | 0.7962 | 14.292 | 0.8096 | 0.2544 | 0.9342 | 50.41 | 69.49 |
| MIC7 | 2.0115 | 0.9061 | 0.0512 | 0.9879 | 0.0573 | 0.9696 | 14.517 | 0.9837 | 0.2929 | 0.9954 | 32.36 | 43.4 |
| MIC8 | 2.2184 | 0.7672 | 0.0717 | 0.9212 | 0.0736 | 0.8746 | 14.354 | 0.9281 | 0.3111 | 0.9821 | 35.28 | 51.53 |
| MIC9 | 2.2952 | 0.7576 | 0.2805c | 0.9757 | 0.1904 | 0.9535 | 11.343 | 0.868 | 0.1471 | 0.9337 | 68.76 | 80.4 |
| MIC10 | 1.9395 | 0.9023 | 0.0433 | 0.9764 | 0.0508 | 0.9566 | 11.958 | 0.9911 | 0.3082 | 0.995 | 28.38 | 39.39 |
| MIC11 | 1.9512 | 0.9262 | 0.0512 | 0.9929 | 0.0567 | 0.9797 | 11.892 | 0.9941 | 0.2707 | 0.99 | 34.58 | 44.67 |
| MIC12 | 2.2355 | 0.8641 | 0.3689 | 0.9921 | 0.2281 | 0.9864 | 9.5615 | 0.9449 | 0.1017 | 0.9876 | 78.08 | 93.42 |
aExponent “n” of Korsmeyer–Peppas equation is obtained from slope of the profile
bCalculated with data up to t = 12 h
cCalculated with data up to t = 11 h
SOLID-STATE STUDIES
FTIR Spectrophotometric Analysis
Fourier transform infrared (FTIR) spectra were obtained as Nujol mulls using FTIR-8300 (Shimadzu Co., Kyoto, Japan) combined with Quick Snap sampling modules. Infrared spectra of the samples were recorded in the solid state by the KBr disc method over the wavenumber range of 4,000–400 cm−1. Individual polymers, drug (PRD), and drug/polymer physical mixtures were run as controls.
Powder XRD Analysis
Powder X-ray diffraction (XRD) patterns were studied using Rigaku Miniflex diffractometer (Rigaku Co., Ltd., Japan) using a Kb filter, Cu radiation, a voltage of 30 kV, and current of 15 mA. The powder samples were packed in the X-ray holder from the top before analysis. These samples were continuously spun and scanned at a rate of 1°/min over a 2θ range of 5–70°, and the results were processed by a pre-loaded computer program.
TG Analysis
Thermogravimetric analysis (TG) of the microspheres was performed at a heating rate of 10°C/min in the range from 30°C to 700°C under a high-purity nitrogen atmosphere (Q 600 V8.2 built100 DST/TG analyzer). Approximately 3 mg of the sample was placed in a 100-μL platinum cup and the percentage weight loss of the samples was monitored.
DSC Analysis
Differential scanning calorimetry (DSC) analyses were performed on various samples (drug, polymers, physical mixture, solid dispersion, and microspheres) with a Pyris diamond TG/DTA (Perkin-Elmer) instruments with a thermal analyzer. Under nitrogen flow of 25 mL/min, approximately 5–10 mg of the sample was placed in a sealed aluminum pan and heated at a scanning rate of 10°C/min over the temperature range of 30–300°C.
Surface Morphology
The surface morphology of MIC1 and MIC5 were examined using scanning electron microscopy (SEM; JEOL, JSM5200, Tokyo, Japan). Prior to examination, the samples were fixed on a brass stub and coated with a gold–palladium layer under argon atmosphere using a gold sputter module in a high vacuum evaporator. The pictures were then taken in the instrument set at an excitation voltage of 20 kV. The surface morphology of microspheres was investigated before and after the in vitro drug release study.
Stability Study
The stability study was performed on optimized formulation (MIC5). Microspheres were packed in a glass vial and stored at various temperatures (45 ± 2°C and 5 ± 2°C) for a period of 45 days. Sampling was done at predetermined time intervals of 0, 15, 30, and 45 days. Estimation of drug content and dissolution study of these samples were performed. To compare the similarity of drug release profiles before and after stability studies, a statistical tool was used to determine the difference factor (f1) and the similarity factor (f2) by the following equation (28):
 |
4 |
where Rt is the reference assay at time point t, Tt is the test assay at time point t, and n is the number of samples. The difference factor (f1) calculates the percent difference between two curves at specified instants and is a measurement of the relative error between the two curves. If the (f1) factor between two curves is zero, this indicates the identical dissolution profile. The similarity factor (f2) is a logarithmic transformation of the sum of the squared error. It is a measurement of the similarity in the percent dissolution between the test and reference profiles by taking the average sum of squares.
 |
5 |
The f2 value ranging from 50 to 100 ensures similarity of the two curves.
Statistical Analysis
Quantitative data were reported as mean ± SD. Statistical analysis was performed using one-way analysis of variance. Tukey’s test with statistical significance was evaluated at p < 0.05. Calculations were performed with the Graph Pad Instat program trial version.
RESULTS AND DISCUSSIONS
The cellulose matrix microspheres of PRD and PRD–HPβCD complex were prepared using O/O emulsion solvent evaporation technique. The purpose of preparing the PRD–HPβCD inclusion complex was to improve the solubility and dissolution rate and to find the feasibility of its use in the formation of controlled-release microspheres. The PRD–HPβCD complex was prepared using the conventional solvent evaporation method. The emulsion solvent evaporation method has been successfully used to incorporate plain drug (PRD) or the drug–HPβCD inclusion complex into the polymeric matrix. Heavy liquid paraffin, an immiscible liquid, was used as a continuous phase since the dispersed phase contained the hydrophilic complex. Selection of suitable dispersion media enhances the entrapment efficiency. The solvent present in the emulsion droplet gets evaporated and some amount of solvent diffuses into the continuous paraffin phase (23). Earlier, some investigators suggested that the drug was molecularly dispersed within microspheres due to the evaporation of the solvent (29).
Characterization of Microspheres
Microspheres were prepared with various ratios of matrix polymers (HPMC, EC) using prednisolone as free drug (MIC1, MIC2) and prednisolone as inclusion complex with carrier HPβCD (MIC3–12). To prepare microspheres (MIC3–12), 320 mg of complex was used for every 50-mg drug. The solubility of prednisolone in the inclusion complex was higher (3.25 mg/mL at 37 ± 0.5°C) in comparison with that of free drug (0.45 mg/mL at 37 ± 0.5°C). Microspheres were characterized to examine the yield (%) of microspheres, drug content, entrapment efficiency (%), drug loading (%), and average particle size. Loss of materials during preparation was also reported (Table III). Percent yield depends on the mass fraction of polymers, other ingredients (drug, carrier), and the physicochemical properties of the materials involved in dispersion. If any ingredient diffuses out from one liquid phase to another, then there will be lower yield due to this loss. This happens when the solvent migrates/evaporates from microspheres along with the soluble content to the dispersion medium, and this fact also causes greater porosity of the polymeric network. Therefore, we found a lower percentage yield (73.56) in MIC3 in comparison to MIC2. There was a gradual increase in percentage yield when either total polymer content or mass faction of HPMC in the matrix was enhanced. The effect of a higher percentage of HPMC was found to increase the drug content. In fact, EC is hydrophobic and less swellable, so the percent of porosity in the EC-dominated network is larger, which results in less drug content in the formulations when compared with that of HPMC. Thus, we observed that drug content in MIC11 was less than that in MIC12. Drug content in MIC9 and MIC12 were found maximum when a fraction of EC was the lowest. A similar trend was observed in entrapment efficiency.
Table III.
Characterization of Cellulose Microspheres Containing Pure Prednisolone (PRD; MIC1 and MIC2) and Complex (PRD–HPβCD, MIC3–12)
| Code no. | Percentage yield | Drug content (mg) | Entrapment efficiency (%) | Drug loading (%) | Total loss (mg) | Average particle size (μm) |
|---|---|---|---|---|---|---|
| MIC1 | 77.72 ± 1.625 | 83.15 ± 1.973 | 83.15 ± 1.973 | 21.4 ± 0.832 | 84.21 ± 9.867 | 139.25 ± 3.981 |
| MIC2 | 76.84 ± 2.798 | 80.94 ± 2.718 | 80.94 ± 2.718 | 26.33 ± 0.133 | 76.23 ± 10.874 | 168.93 ± 7.781 |
| MIC3 | 73.56 ± 2.812 | 32.68 ± 1.265 | 65.37 ± 2.53 | 7.16 ± 0.133 | 69.24 ± 5.06 | 361.51 ± 46.412 |
| MIC4 | 75.81 ± 3.357 | 34.39 ± 2.439 | 68.79 ± 4.879 | 6.78 ± 0.581 | 70.2 ± 10.978 | 412.28 ± 15.108 |
| MIC5 | 78.31 ± 2.39 | 37.77 ± 1.084 | 75.54 ± 2.168 | 6.7 ± 0.352 | 61.13 ± 5.421 | 422.27 ± 9.779 |
| MIC6 | 78.95 ± 2.337 | 38.38 ± 1.203 | 76.77 ± 2.406 | 6.32 ± 0.352 | 63.87 ± 6.616 | 437.87 ± 39.609 |
| MIC7 | 78.86 ± 1.475 | 36.94 ± 1.463 | 73.89 ± 2.927 | 6.08 ± 0.352 | 71.77 ± 8.05 | 443.42 ± 12.214 |
| MIC8 | 79.83 ± 2.198 | 38.8 ± 0.988 | 77.67 ± 1.976 | 5.93 ± 0.23 | 66.98 ± 5.928 | 449.17 ± 7.812 |
| MIC9 | 79.9 ± 1.66 | 40.32 ± 2.277 | 80.64 ± 4.554 | 7.01 ± 0.48 | 48.38 ± 11.387 | 308.66 ± 4.091 |
| MIC10 | 80.81 ± 1.916 | 35.18 ± 2.454 | 70.36 ± 4.909 | 5.01 ± 0.461 | 96.29 ± 15.954 | 465.71 ± 12.937 |
| MIC11 | 81.88 ± 1.136 | 37.16 ± 1.755 | 74.32 ± 3.51 | 4.93 ± 0.266 | 89.84 ± 12.286 | 470.94 ± 25.545 |
| MIC12 | 82.43 ± 1.816 | 40.9 ± 1.415 | 81.8 ± 2.83 | 5.39 ± 0.266 | 63.68 ± 9.908 | 340.16 ± 20.719 |
Data are the means of at least three experiments ± SD (p < 0.05). Yield is calculated with respect to the total weight of solid dispersion (320 mg of PRD–HPβCD complex) and polymers
Percentage drug loading is the percent of drug with respect to the yield of microspheres that depends upon the amount of polymer. In MIC1, the total amount of polymer was higher than MIC2, so percent drug loading was found less in MIC1. Percent drug loading dropped significantly (p < 0.05) in MIC3 in comparison to MIC2 since a lesser amount (50 mg) of drug was added in the former. With the increase of total polymer, drug loading percentage decreased.
Loss of material was minimized with the increase of total polymer and HPMC. Loss of drug in MIC3 was lesser since less quantity of the drug was added. Average particle size (dp) in MIC1 and MIC2 was comparatively lesser than in MIC3–MIC12 since the latter contained some quantity of HPβCD due to complexation. With the increase of total quantity of polymer, dp increased, as evidenced in particle size (dp) of MIC3–MIC6. Average particle size decreased when the mass fraction of EC was low (MIC9, MIC12). Physicochemical properties of EC (hydrophobicity, rigidity) may influence dp. Factors such as speed of agitation, volume of external phase, and concentration of surfactant influence the size of the particle. In the present study, all the factors were kept constant for all formulations. Interfacial tension is also an important factor that causes coalescence of globules (30). The hydrophilicity and swellability of HPMC make the microspheres less porous, and as a result, it retards the possible migration of drug into continuous medium. This hypothesis is supported by the highest yield of microspheres obtained in the presence of higher HPMC concentration (7). From this discussion, it is clear that the above method used is appropriate to incorporate the drug complex in a suitable blend of hydrophilic and hydrophobic polymer when the latter acts as good retarding agent. The mass balance was calculated with respect to drug content showing higher material loss in the formulation prepared without HPMC.
In Vitro Release Study
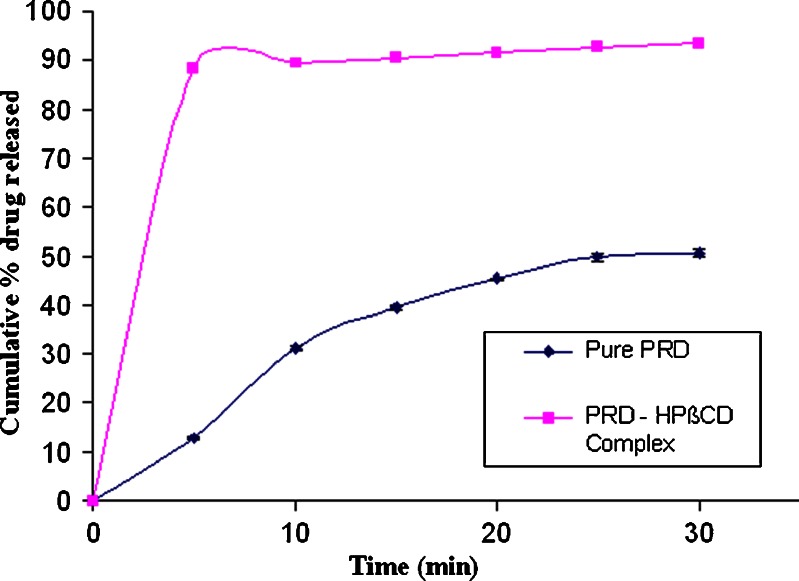
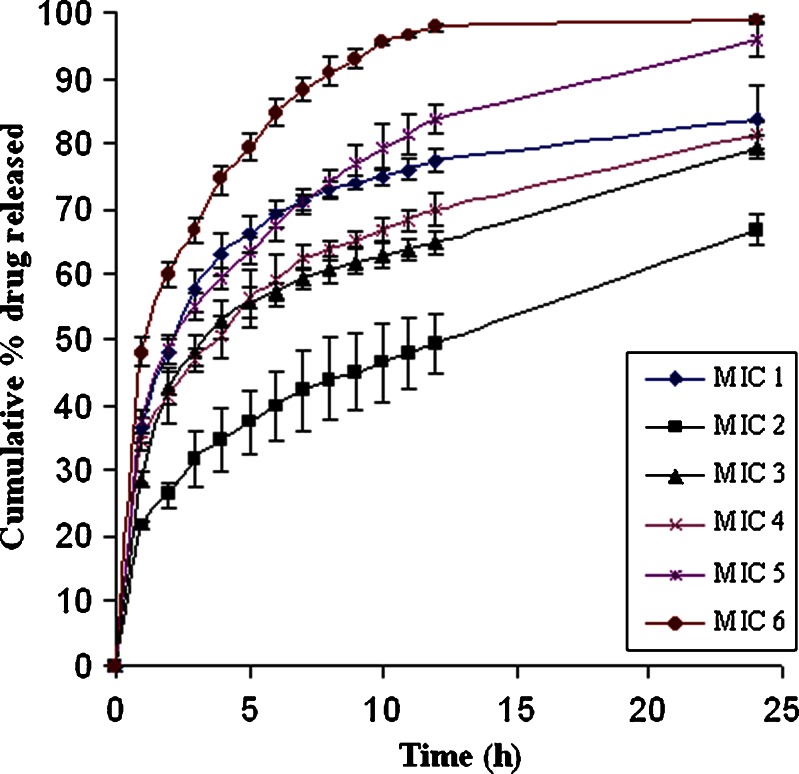
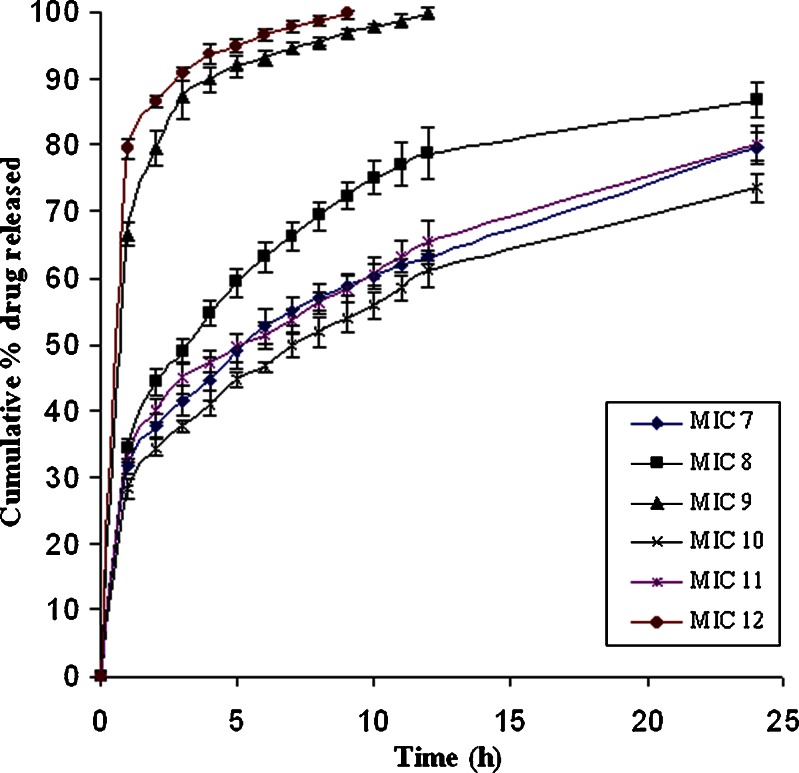
The increment in the dissolution from the PRD–HPβCD complex was higher than that of pure PRD, as depicted in Fig. 2. In the PRD–HPβCD complex, 93.36% of drug was released at the end of 30 min with an initial burst release of 88.39%, whereas a 12.86% release at 5 min and then 50.42% at 30 min were observed in the pure drug. This fact proved that the higher solubilization capability of substituted cyclodextrin favors the amorphous behavior of drug (31). The cumulative drug release profiles from various batches of microspheres were depicted in Figs. 3 and 4. Each release profile exhibits a biphasic pattern: initial burst release phase and subsequent slower release phase. The percentage release varies with various compositions of polymers (EC: HPMC). In each formulation, ethyl cellulose was used, whereas HPMC was not included in MIC2 and MIC3. It is well known that the microspheres prepared with ethyl cellulose showed sustained effect over an extended period due to its poor solubility, less permeability, and higher matrix thickness (8). In MIC2, the lowest burst release (21%) and percentage release of drug (66%) up to 24 h were observed because of slower diffusion rate of drug through the ethyl cellulose matrix. The rate of release was found higher in MIC3 (28% burst release at 1 h and percentage release 79.5% at 24 h) in comparison to MIC2 since the former contained more soluble prednisolone (PRD–HPβCD complex) when both were formulated with the same content of ethyl cellulose. It is obvious that the initial burst release increases with the higher dissolution ability of drug in complex form when compared with pure PRD (31). Therefore, the drug’s solubility and polymer’s characteristics play a combined role in the release of drug from microspheres. It is well known that the polymer having more permeability to water and swellability facilitates higher dissolution and drug release from a dosage form. Comparing the profiles of MIC1 and MIC2, we observed a higher burst release (36.62% at 1 h) and higher percentage release (83.9% at 24 h) in MIC1 owing to the presence of HPMC, which is more swellable due to its permeability to water. HPMC was not used alone in other cases because drug release cannot be controlled as much as we desire. Retardation effect of EC and fast release effect of HPMC were coupled to achieve the targeted extended release. Comparing the formulations MIC3, MIC4, MIC5, and MIC6 (PRD–HPβCD) that contained a fixed amount of EC and increasing amount of HPMC (0–150 mg; Table I), we found that both initial burst release and percentage release up to 24 h increased with the increasing content of HPMC. The possibility of extending release from 12 to 24 h in MIC6 had been ruled out due to the highest content of HPMC. The experiment showed that it achieved 97.84% drug release up to a 12-h release period. Formulations MIC3 and MIC4 could not achieve more than an 82% release up to 24 h, whereas MIC5 showed burst release (37.44%) and drug release (83.93% up to 12 h and 95% up to 24 h) in the satisfactory level. Comparing MIC4 and MIC7, and MIC5 and MIC8, we observed that percentage drug release decreased with increasing amount of EC. Release period was extended with increasing EC concentration, but MIC4, MIC7, and MIC8 could not achieve a drug release more than 90% in the 24-h period. Effect of increasing amount of EC was found similarly in MIC7, MIC10 and MIC8, MIC11. Formulations MIC10 and MIC11 could not achieve drug release >90% in the 24-h release period. The microspheres (MIC9 and MIC12) showed the highest drug content and caused a very fast release of drug, 99% within 12 and 9 h, respectively, because of the higher fraction of HPMC in comparison to EC. The drug release rate from the microspheres could also be related to the particle size (7). Microspheres of the complex (MIC9, MIC12) showed a comparatively smaller particle size that provided a large surface area and caused an increased release (%) of drug. The particle size depends on the viscosity and concentration of polymeric dispersion. Dissolution efficiency was lower with increasing amount of EC (Table III). Therefore, molecularly dispersed drug (complex) within matrix microspheres (MIC3) released at a faster rate than that of the pure drug (MIC2). This is due to the reduced crystallinity, as suggested by (32). Drug release can be achieved at a desired level by a well-balanced use of polymers.
Fig. 2.
Dissolution profiles of pure prednisolone and prednisolone in PRD–HPβCD complex
Fig. 3.
Drug release profiles from matrix microspheres (MIC1–6) loaded with prednisolone
Fig. 4.
Drug release profiles from matrix microspheres (MIC7–12) loaded with prednisolone
Release Mechanism
Drug release profiles shown in Figs. 3 and 4 are not linear with time. There are established equations to study the mechanism of drug release; among these, suitable equations are generally determined by the linearity of data-fitted curves. In the present study, the cumulative percentage of drug releases (M) at various time (t) intervals were fitted to zero-order, first-order, cube root model, Higuchi’s, and Korsmeyer–Peppas’ model.
Correlation coefficient (r2) as summarized in Table II indicates that the release data of drug from almost all the MIC formulations fitted well into the Korsmeyer–Peppas model (logM = logk + nlogt; r2 = 0.9292–0.9953), but n values were not within the range 0.5–1. Similar values were obtained when the equation was applied to the first 60% of fractional release of drug from microspheres. It suggests that drug release obeys a quasi-Fickian release mechanism (n < 0.5) where drug diffuses slowly through a swollen matrix and water filled pores of microspheres (33). Release of drug was not supported by Fickian (n = 0.5, Higuchi equation), non-Fickian (0.5 < n < 1), and case II transport (n = 1) release mechanisms as values of n ranges from 0.1 to 0.34. MIC9 and MIC12 showed the least values of n (0.1471 and 0.1017, respectively). In these two microspheres, HPMC contents were higher compared to EC, and burst releases (%) at the end of the first hour were significantly high and both the release amounts and rate of releases were very low. The correlation coefficients (r2) as per Higuchi’s equation were in the range 0.818–0.9953, which showed nonlinearity in some cases. The correlation coefficients obtained with the zero-order equation (r2 = 0.59–0.93) and cube root law (r2 = 0.758–0.9864) showed nonlinearity of plots in some cases. In zero order, the drug dissolution occurs at a constant rate from beginning to end. The cube root law describes the erosion behavior of systems and dissolution of polymer matrix. These facts were not observed in the present cases. So these mechanisms are not found suitable here. Rather, the profiles obtained according to the first-order equation showed linearity (r2 = 0.92–0.9987) in all the release patterns except that of MIC1 (r2 = 0.8167). Finally, it is concluded that drug releases exponentially from all microspheres, and the drug release patterns could be explained by quasi-Fickian and first-order release mechanisms.
Solid-State Studies
The solid-state studies were performed for the formulation (MIC5) to assess the effect of interaction between the drug and polymer and to find out whether the drug incorporated in the microspheres was in its crystalline or amorphous form (Fig. 5).
Fig. 5.
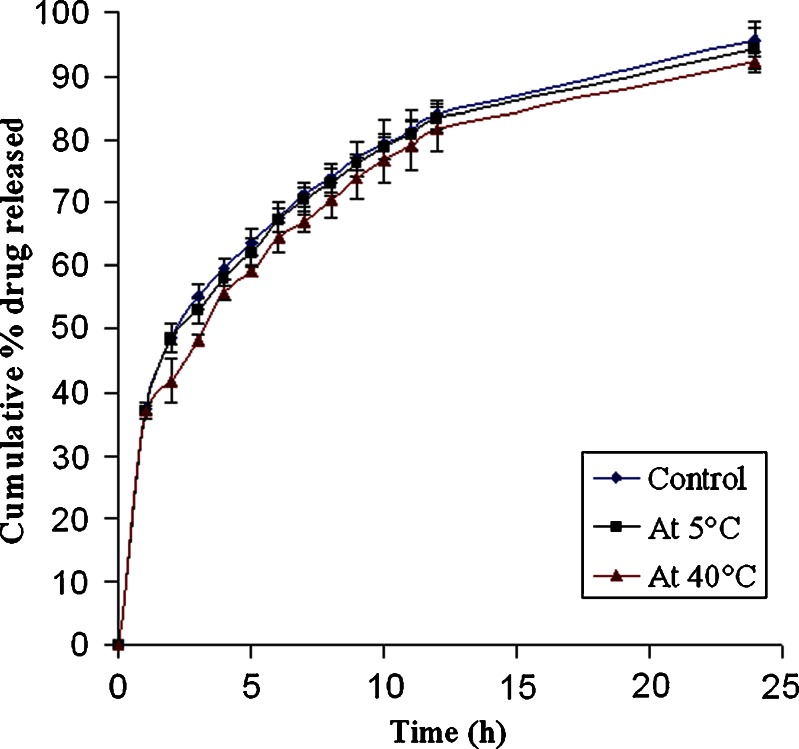
Comparison of release profiles of MIC5 before (control) and after 45 days stability studies at 5°C and 40°C
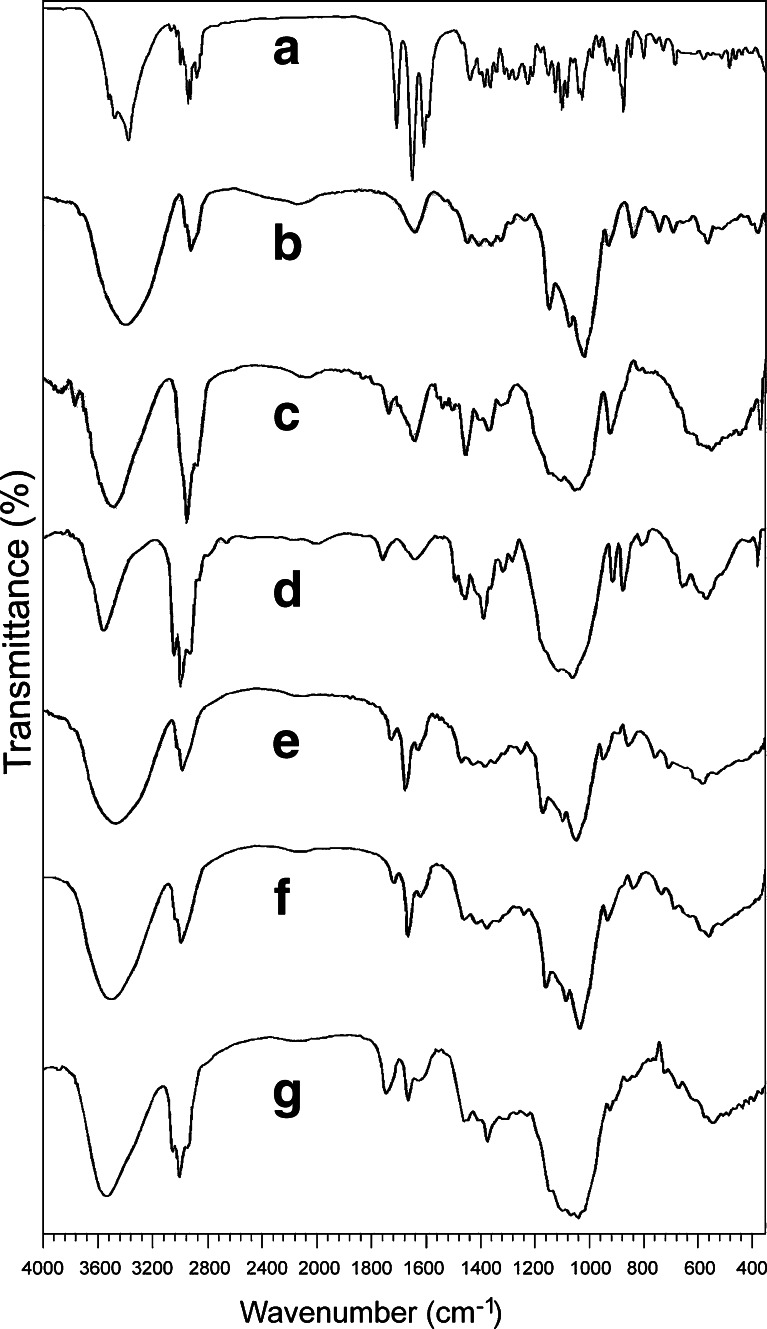
FTIR spectrophotometric analysis of pure drug, PRD–HPβCD complex, and polymers were recorded and depicted in Fig. 6. The spectrum of pure drug displayed peak characteristics of –OH stretch vibrations at 3,357, 3,454, and 3,496 cm−1 for the presence of three hydroxyl groups and the peaks at 1,710 and 1,654 cm−1 for the presence of carbonyl groups in its structure. The presence of C–H stretch (alkanes), C–H stretch (alkanes), and C–C stretch (in ring aromatics) appeared as bands at 2,866; 2,912; 2,929; and 1,596 cm−1, respectively.
Fig. 6.
FTIR spectra of pure PRD (a); pure HPβCD (b); pure HPMC (c); pure ethyl cellulose (d); PRD–HPβCD complex (e); physical mixture of PRD complex, EC, and HPMC (f); and PRD complex-loaded microspheres (MIC5) (g)
Strong absorption peaks at 3,396 cm−1 (O–H stretch vibration) and 2,929 cm−1 (C–H stretching vibration) were found in HPβCD (pure). In the drug–HPβCD complex, the peaks corresponding to O–H (3,404 cm−1) and C–H (2,926 cm−1) stretching vibrations were broadened and showed reduced intensity when compared with that of pure drug. The absorption peaks showed a slight shift in the spectra. This indicates inclusion complex formation of drug with HPβCD (13,14). The bands at 3,479 cm−1 and at 2,974, 2,925, and at 2,858 cm−1 are attributed to the presence of –OH stretch and C–H stretch groups of pure ethyl cellulose, respectively. Similar band peaks were observed in the HPMC spectrum (Fig. 6c) at 3,452 cm−1 (–OH stretch) and 2,925 cm−1 (C–H stretch). In the physical mixture, the peaks similar to the PRD complex at 3,413 and 2,929 cm−1 were found. The spectra of microspheres that consist of the PRD complex and polymers showed the characteristic peaks at 3,434 cm−1 and at 2,972, 2,927, and 2,873 cm−1 corresponding to –OH stretching and C–H stretching vibrations, respectively. All the characteristic bands found in the microsphere (MIC5) have resemblance to that of the physical mixture, while the former showed reduced intensities of peaks in comparison to the latter. Both of these two showed other bands corresponding to C=O, –C=C–, C–C (in ring), C–N stretches, and C–H bend as found in drug, drug–HPβCD complex, and polymers. This indicates that there is no chemical interaction between the PRD complex and EC/HPMC (34).
Powder X-Ray Diffraction Analysis
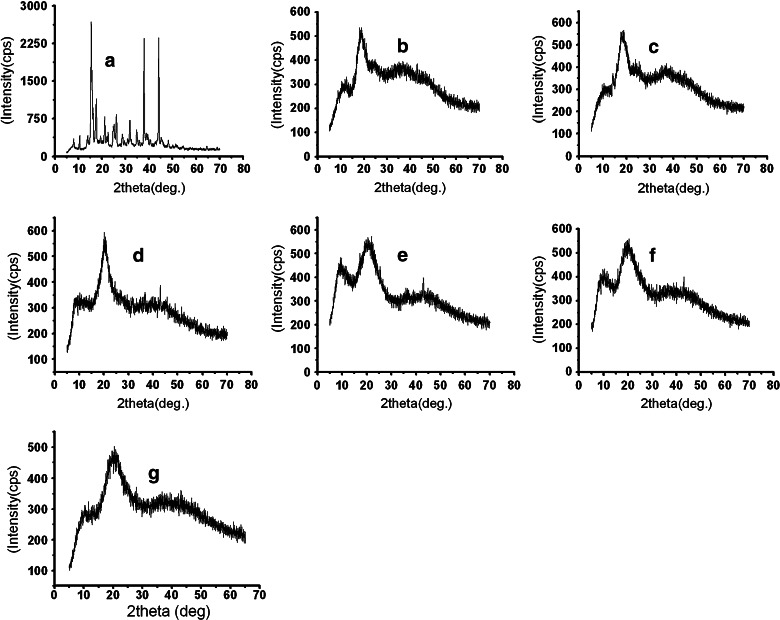
The recorded XRD spectra for the pure PRD, PRD–HPβCD, and microspheres loaded with PRD–HPβCD complex (MIC5) are presented in Fig. 7. These studies are useful to investigate the crystallinity of the drug in the prepared microspheres (35). The XRD of prednisolone (Fig. 7a) yielded several sharp diffraction peaks typical of its crystalline state, while the diffused halo pattern of the inclusion complex (Fig. 7c) indicated the amorphous state of the product. The diffractograms of the polymers (EC and HPMC) in Fig. 7d, e clearly showed the amorphous nature of polymers. Microspheres were characterized by a broad pattern of the diffractogram in Fig. 7g, suggesting the reduction in the crystallinity of the drug (36). This fact substantiates the enhancement of drug release (%) in various formulations. This amorphous state caused greater dissolution of drug from microspheres loaded with PRD–HPβCD complex than that of prednisolone microspheres.
Fig. 7.
X-ray powder diffraction spectra of pure PRD (a); pure HPβCD (b); PRD–HPβCD complex (c); pure HPMC (d); pure ethyl cellulose (e); physical mixture of PRD complex, EC, and HPMC (f); and PRD complex-loaded microspheres (MIC5) (g)
TG Analysis
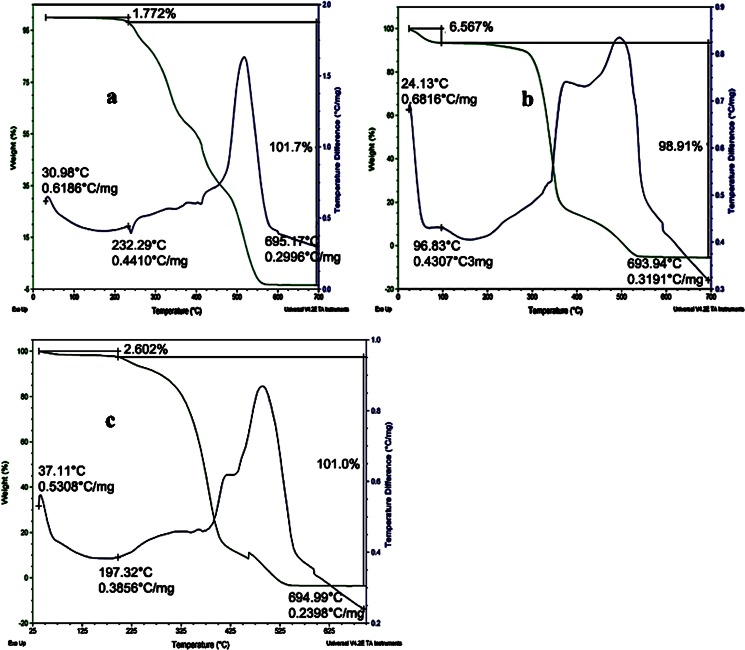
TGA is a useful tool in determining the loss of volatile components from the sample as a function of temperature. Only 1.77% of its total mass was lost at 225°C for pure PRD (Fig. 8a), which is close to the drug’s melting point (232°C, experimental value). This loss may be due to volatilization of the hydroxyl group present in PRD. This loss gradually increased as a function of temperature, whereas in the PRD–HPβCD complex (Fig. 8b), the 6.567% loss observed at 100°C was due to dehydration (37). The microsphere’s (MIC5) TG curves in Fig. 8c showed only a 2.6% weight loss at 200°C, probably owing to either volatilization of the hydroxyl group or dehydration. But complete degradation occurred only after 325°C, which indicates the presence of the PRD–HPβCD complex in stable form. With this evidence, DSC was performed to analyze the physical nature of drug in microspheres.
Fig. 8.
TGA traces of pure PRD (a); PRD–HPβCD complex (b); and PRD complex-loaded microspheres (MIC5) (c)
DSC Analysis
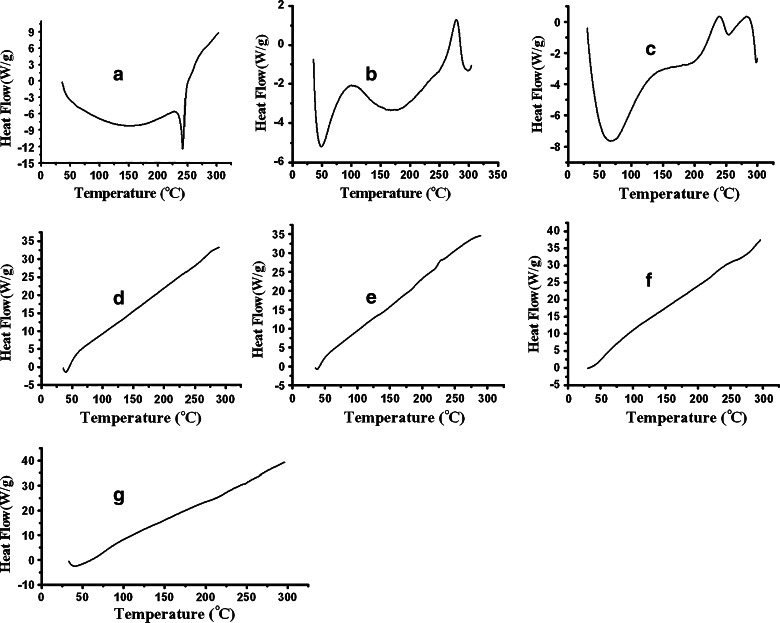
DSC analysis may provide information about the state of the drug (26) together with the physical stability of material after the process technology (38). The DSC of the respective samples is shown in (Fig. 9). The sharp endothermic peak was observed in Fig. 9a at 239.5°C, which was close to the melting point of drug (prednisolone) (15). Thermogram of pure HPβCD showed broad endothermic peak at 50°C in Fig. 9b; it was possibly due to the release of water molecules from HPβCD. There is another exothermic peak at 275°C. It is reported that HPβCD starts degradation above 250°C (39). The exothermic peak appears, probably owing to the degradation of HPβCD. In the case of drug–HPβCD complex (vide Fig. 9c), a very short endothermic peak appeared near about 250°C. It seems that the melting point of drug has been shifted from 239.5°C to 250°C in the presence of HPβCD. The melting point characteristics or the endothermic peak of a substance in a mixture may be modified depending on the nature and quantity of another substance. The short broad endothermic peak indicates that the drug is partly amorphous and partly crystalline in the complex form. The complexation technique reduced its crystallinity to some extent. In the same thermogram (Fig. 9c), the aforementioned peak appeared as if it merged with another short exothermic peak at ~280°C. This peak is possibly due to the degradation of HPβCD in the complex form. Figure 9d, e exhibited thermograms of pure HPMC and EC, respectively, which showed no distinct endothermic peak owing to its amorphous nature. No endothermic peak corresponding to the melting point of prednisolone appeared in the DSC thermograms of physical mixture (PM) and microspheres (MIC5; vide Fig. 9f, g). Both the samples of PM and MIC5 contains PRD–HPβCD complex, EC, and HPMC. In these samples, a fraction of drug–HPβCD is comparatively lower than the fraction of polymers used. Hence, merged peaks as observed in Fig. 9c did not appear in the presence of polymer, as if these have a predominating role over the complex (16). Therefore, similar thermograms were observed in Fig. 9f, g as in Fig. 9d, e. No new peak appeared in both the thermograms of PM and PRD complex (MIC5); therefore, it was suggested that the ingredients are compatible with each other, although the melting characteristic of pure drug is altered during complex formation. Diminished sharpness of peak in Fig. 9C confirms complex formation in solid dispersion.
Fig. 9.
DSC thermogram of pure PRD (a); pure HPβCD (b); PRD–HPβCD complex (c); pure HPMC (d); pure ethyl cellulose (e); physical mixture of PRD complex, EC, and HPMC (f); and PRD complex-loaded microspheres (MIC5) (g)
Surface Morphology
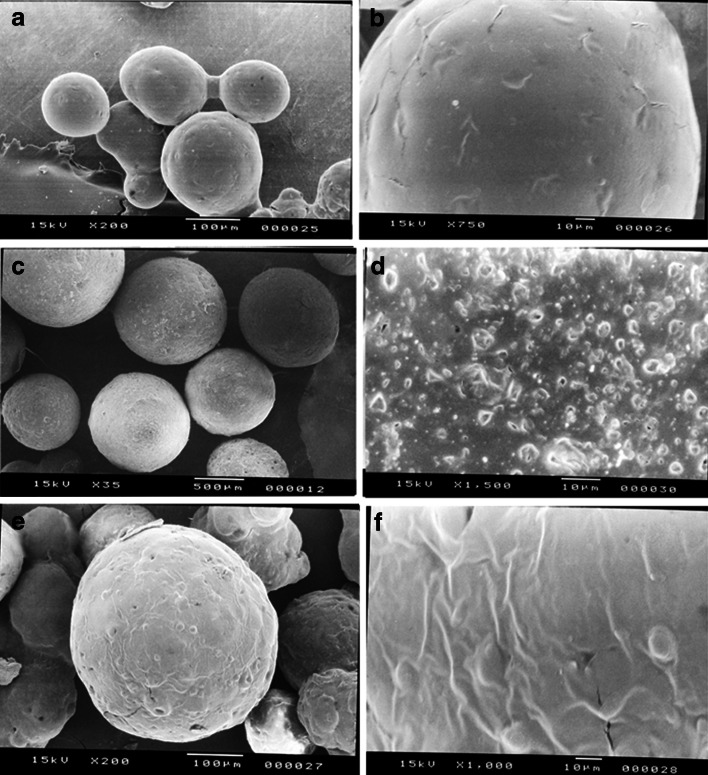
Each batch of microspheres was of regular, spherical, and a well-defined shape with varying surface characteristics (porosity), as evidenced by the photographs obtained by scanning electron microscopy (Fig. 10a–d). The microspheres (MIC5) showing a uniformly rough, porous surface (Fig. 10d) is indicative of an even distribution of solid dispersion in the polymeric matrix which results high initial burst release (31,40). The microspheres (MIC1) loaded with pure PRD–EC/HPMC (Fig. 10b) showed a smooth surface less porous in nature, with some drug crystals on the surface of the microspheres. The surface characteristics of microspheres depend on polymer characteristics, polymer concentration, and preparation technique (41,42). Surface porosity might also be caused by the high evaporation rate of the solvent when the dispersion is rotated at a high stirring rate (43). At the end of the in vitro release study, the microspheres were collected and dried. Then, the SEM photographs were taken in order to examine the surface characteristics of the microspheres after dissolution. The surface of microspheres exhibiting bigger pores is indicative of the release of drug from the polymeric matrix (Fig. 10e, f).
Fig. 10.
SEM micrographs of microspheres (MIC1) with pure PRD (a, b) and microspheres MIC5 (PRD–HPβCD complex) (c, d) before dissolution study and micrographs of microspheres MIC5 (PRD–HPβCD) (e, f) after the dissolution study
Stability Studies
Stability studies were performed under various temperatures in a period of 45 days. At regular intervals, the microspheres were subjected to drug content assay, and the results were shown in Table IV. At higher temperature (40°C), the percentage of drug content was found to be 94.08%, whereas 96.49% was obtained at 5°C at the end of 45 days. This result suggests that the microspheres were more stable at 5°C. The in vitro release profiles of optimized formulation (MIC5) before and after stability studies are illustrated in Fig. 5. The profiles appeared to be almost super imposable. The f2 similarity factor and f1 difference factor were calculated by considering the release profile of the samples before the stability study as reference and the release profile of samples after the stability study (45 days) as test. The f2 values were 86.41(5 ± 2°C) and 61.3(40 ± 2°C) and the f1 values 1.31(5 ± 2°C) and 5.24(40 ± 2°C). These results confirmed the similarity of the release profiles of the formulation that was maintained at various temperatures for a storage period of 45 days.
Table IV.
Stability Study of Cellulose Microspheres
| Sample no. | No. of days | Drug content (%) | Similarity factor (f 2) | Difference factor (f 1) | |||
|---|---|---|---|---|---|---|---|
| 5 ± 2°C | 40 ± 2°C | 5 ± 2°C | 40 ± 2°C | 5 ± 2°C | 40 ± 2°C | ||
| MIC5 | 0 | 100 | 100 | 86.41 | 61.30 | 1.31 | 5.24 |
| 15 | 98.9 | 95.29 | |||||
| 30 | 97.7 | 94.08 | |||||
| 45 | 96.49 | 94.08 | |||||
CONCLUSIONS
This is the first attempt to incorporate solid dispersion of prednisolone–HPβCD complex in matrix microspheres. By solid dispersion method, the solubility of prednisolone was enhanced. Microspheres were successfully prepared with prednisolone–HPβCD complex, and it was confirmed that prednisolone was dispersed in polymer matrices in the amorphous state by XRD and DSC. We conclude that cellulose matrix microspheres loaded with the complex is a new sustained-release delivery system of prednisolone that has a potential in administering the drug orally.
ACKNOWLEDGMENT
We express gratitude to Medopharm, Karnataka, India, for providing prednisolone as gift sample. We wish to thank Signet Chemical Corporation Pvt. Ltd, (Mumbai, India) and Colorcon Asia Pvt. Ltd (Gao, India) for providing polymers free of cost.
Declaration of interest
The authors are thankful to University Grants Commission (UGC), New Delhi, India, for financial support through grant project no. 34–132\2008 (SR).
REFERENCES
- 1.Vijayalakshmi P, Devi VK, Narendra C, Srinagesh S. Development of extended zero-order release gliclazide tablets by central composite design. Drug Dev Ind Pharm. 2008;34:33–45. doi: 10.1080/03639040701386129. [DOI] [PubMed] [Google Scholar]
- 2.Lee DW, Hwang SJ, Park JB, Park HJ. Preparation and release characteristics of polymer-coated and blended alginate microspheres. J Microencapsul. 2003;20:179–192. [PubMed] [Google Scholar]
- 3.Mukherjee B, Santra K, Pattnaik G, Ghosh S. Preparation, characterization and in-vitro evaluation of sustained release protein-loaded nanoparticles based on biodegradable polymers. Int J Nanomedicine. 2008;3:487–496. doi: 10.2147/IJN.S3938. [DOI] [PMC free article] [PubMed] [Google Scholar]
- 4.Trapani A, Laquintana V, Denora N, Lopedota A, Cutrignelli A, Franco M, et al. Eudragit RS 100 microparticles containing 2-hydroxypropyl-β-cyclodextrin and glutathione: physicochemical characterization, drug release and transport studies. Eur J Pharm Sci. 2007;30:64–74. doi: 10.1016/j.ejps.2006.10.003. [DOI] [PubMed] [Google Scholar]
- 5.Teshima M, Fumoto S, Nishida K, Nakamura J, Ohyama K, Nakamura T, et al. Prolonged blood concentration of prednisolone after intravenous injection of liposomal palmitoyl prednisolone. J Control Release. 2006;112:320–328. doi: 10.1016/j.jconrel.2006.03.004. [DOI] [PubMed] [Google Scholar]
- 6.Kramer J, Blume H. Biopharmaceutical aspects of multiparticulates. In: Ghebre-Sellasie Y, editor. Multiparticulate oral drug delivery. New York: Dekker; 1994. pp. 307–332. [Google Scholar]
- 7.Guyot M, Fawaz F. Nifedipine loaded-polymeric microspheres: preparation and physical characteristics. Int J Pharm. 1998;175:61–74. doi: 10.1016/S0378-5173(98)00253-1. [DOI] [Google Scholar]
- 8.Choudhury PK, Kar M. Controlled release metformin hydrochloride microspheres of ethyl cellulose prepared by different methods and study on the polymer affected parameters. J Microencapsul. 2009;26:46–53. doi: 10.1080/02652040802130503. [DOI] [PubMed] [Google Scholar]
- 9.Akbuga J. Furosemide-loaded ethyl cellulose microspheres prepared by spherical crystallization technique: morphology and release characteristics. Int J Pharm. 1991;76:193–198. doi: 10.1016/0378-5173(91)90271-O. [DOI] [Google Scholar]
- 10.Comoglu T, Gonul N, Dogan A, Basci N. Development and in vitro evaluation of pantoprazole-loaded microspheres. Drug Deliv. 2008;15:295–302. doi: 10.1080/10717540802006864. [DOI] [PubMed] [Google Scholar]
- 11.Bibby DC, Davies NM, Tucker IG. Mechanisms by which cyclodextrins modify drug release from polymeric drug delivery systems. Int J Pharm. 2000;197:1–11. doi: 10.1016/S0378-5173(00)00335-5. [DOI] [PubMed] [Google Scholar]
- 12.Carrier RL, Miller LA, Ahmed I. The utility of cyclodextrins for enhancing oral bioavailability. J Control Release. 2007;123:78–99. doi: 10.1016/j.jconrel.2007.07.018. [DOI] [PubMed] [Google Scholar]
- 13.Fernandes CM, Vieira MT, Veigaa FJB. Physicochemical characterization and in vitro dissolution behavior of nicardipine–cyclodextrins inclusion compounds. Eur J Pharm Sci. 2002;15:79–88. doi: 10.1016/S0928-0987(01)00208-1. [DOI] [PubMed] [Google Scholar]
- 14.Mura P, Faucci MT, Bettinetti GP. The influence of polyvinylpyrrolidone on naproxen complexation with hydroxypropyl-β-cyclodextrin. Eur J Pharm Sci. 2001;13:187–194. doi: 10.1016/S0928-0987(01)00093-8. [DOI] [PubMed] [Google Scholar]
- 15.Vogt M, Derendorf H, Krämer J, Junginger HE, Midha KK, Shah VP, et al. Biowaiver monographs for immediate release solid oral dosage forms: prednisolone. J Pharm Sci. 2007;96:27–37. doi: 10.1002/jps.20768. [DOI] [PubMed] [Google Scholar]
- 16.Fukuda N, Higuchi N, Ohno M, Kenmochi H, Sekikawa H, Takada M. Dissolution behavior of prednisolone from solid dispersion systems with cyclodextrins and polyvinylpyrrolidone. Chem Pharm Bull. 1986;34:1366–1369. doi: 10.1248/cpb.34.1366. [DOI] [PubMed] [Google Scholar]
- 17.Metselaar JM, Wauben MH, Hilbers JPW, Boerman OC, Storm G. Complete remission of experimental arthritis by joint targeting of glucocorticoids with long-circulating liposomes. Arthritis Rheum. 2003;48:2059–2066. doi: 10.1002/art.11140. [DOI] [PubMed] [Google Scholar]
- 18.Schmidt J, Metselaar JM, Wauben MH, Toyka KV, Storm G, Gold R. Drug targeting by long-circulating liposomal glucocorticosteroids increases therapeutic efficacy in a model of multiple sclerosis. Brain. 2003;126:1895–1904. doi: 10.1093/brain/awg176. [DOI] [PubMed] [Google Scholar]
- 19.Berthold A, Cremer K, Kreuter J. Preparation and characterization of chitosan microspheres as drug carrier for prednisolone sodium phosphate as model for anti-inflammatory drugs. J Control Release. 1996;39:17–25. doi: 10.1016/0168-3659(95)00129-8. [DOI] [Google Scholar]
- 20.Oosegi T, Onishi H, Machida Y. Gastrointestinal distribution and absorption behavior of eudragit-coated chitosan–prednisolone conjugate microspheres in rats with TNBS-induced colitis. Int J Pharm. 2008;348:80–88. doi: 10.1016/j.ijpharm.2007.07.007. [DOI] [PubMed] [Google Scholar]
- 21.Redmon MP, Hickey AJ, Deluca PP. Prednisolone-21-acetate poly(glycolic acid) microspheres: influence of matrix characteristics on release. J Control Release. 1989;9:99–109. doi: 10.1016/0168-3659(89)90001-1. [DOI] [Google Scholar]
- 22.Akiyama Y, Yoshioka M, Horibe H, Hirai S, Kitamori N, Toguchi H. Mechanism of drug release from polyglycerol ester of fatty acid-based microspheres. J Control Release. 1993;27:31–45. [Google Scholar]
- 23.Herrmann J, Bodmeier R. Biodegradable, somatostatin acetate containing microspheres prepared by various aqueous and non-aqueous solvent evaporation methods. Eur J Pharm Biopharm. 1998;45:75–82. doi: 10.1016/S0939-6411(97)00125-2. [DOI] [PubMed] [Google Scholar]
- 24.Indian Pharmacopoeia. Published by the Government of India. 2007;II:1584.
- 25.Xu GJ, Sunada H. Influence of formulation changes on drug release kinetics from hydroxypropyl methylcellulose matrix tablets. Chem Pharm Bull. 1995;43:483–487. doi: 10.1248/cpb.43.483. [DOI] [PubMed] [Google Scholar]
- 26.Singla AK, Medirata DK. Influence of sodium lauryl sulfate on indomethacin release patterns from zinc–indomethacin complex and Indomethacin capsules. Drug Dev Ind Pharm. 1988;14:1883–1888. doi: 10.3109/03639048809151994. [DOI] [Google Scholar]
- 27.Higuchi T. Mechanisms of rate of sustained-action medication. J Pharm Sci. 1963;52:1145–1149. doi: 10.1002/jps.2600521210. [DOI] [PubMed] [Google Scholar]
- 28.Moore JW, Flanner HH. Mathematical comparison of dissolution profiles. Pharm Tech. 1996;20:64–75. [Google Scholar]
- 29.Izumikawa S, Yoshioka S, Aso Y, Takeda Y. Preparation of poly(l-lactide) microspheres of different crystalline morphology on drug release rate. J Control Release. 1991;15:133–140. doi: 10.1016/0168-3659(91)90071-K. [DOI] [Google Scholar]
- 30.Palanisamy M, Khanam J, Arunkumar N, Rani C. Design and in vitro evaluation of poly(ε-caprolactone) microspheres containing metoprolol succinate. Asian J Pharm Sci. 2009;4:121–131. [Google Scholar]
- 31.Kakish HF, Tashtoush B, Ibrahim HG, Najib NM. A novel approach for the preparation of highly loaded polymeric controlled release dosage forms of diltiazem HCl and diclofenac sodium. Eur J Pharm Biopharm. 2002;54:75–81. doi: 10.1016/S0939-6411(02)00035-8. [DOI] [PubMed] [Google Scholar]
- 32.Yuksel N, Tincer T, Baykara T. Interaction between nicardipine hydrochloride and polymeric microspheres for a controlled release system. Int J Pharm. 1996;140:145–154. doi: 10.1016/0378-5173(96)04560-7. [DOI] [Google Scholar]
- 33.Mishra B, Bansal A, Sankar C. Development and in vitro evaluation of hydrophilic matrix tablets of diltiazem hydrochloride. Acta Pharm Turc. 2005;47:115–126. [Google Scholar]
- 34.Junior AADS, Matos JRD, Formariz TP, Rossanezi G, Scarpa MV, Egito ESTD, et al. Thermal behavior and stability of biodegradable spray-dried microparticles containing triamcinolone. Int J Pharm. 2009;368:45–55. doi: 10.1016/j.ijpharm.2008.09.054. [DOI] [PubMed] [Google Scholar]
- 35.Freiberg S, Zhu XX. Polymer microspheres for controlled drug release. Int J Pharm. 2004;282:1–18. doi: 10.1016/j.ijpharm.2004.04.013. [DOI] [PubMed] [Google Scholar]
- 36.Maestrelli F, Zerrouk N, Cirri M, Mennini N, Mura P. Microspheres for colonic delivery of ketoprofen–hydroxypropyl-β-cyclodextrin complex. Eur J Pharm Sci. 2008;34:1–11. doi: 10.1016/j.ejps.2008.02.001. [DOI] [PubMed] [Google Scholar]
- 37.Maitre MM, Longhi MR, Granero GG. Ternary complexes of flurbiprofen with HP-β-CD and ethanol amines characterization and transdermal delivery. Drug Dev Ind Pharm. 2007;33:311–326. doi: 10.1080/03639040600901978. [DOI] [PubMed] [Google Scholar]
- 38.Corti G, Capasso G, Maestrelli F, Cirri M, Mura P. Physical–chemical characterization of binary systems of metformin hydrochloride with triacetyl-β-cyclodextrin. J Pharm Biomed Anal. 2007;45:480–486. doi: 10.1016/j.jpba.2007.07.018. [DOI] [PubMed] [Google Scholar]
- 39.Kohata S, Jyodi K, Ohyoshi A. Thermal decomposition of cyclodextrins (α-, β-, γ-, and modified β-CyD) and of metal–(β-CyD) complexes in the solid phase. Thermochim Acta. 1993;217:187–198. doi: 10.1016/0040-6031(93)85107-K. [DOI] [Google Scholar]
- 40.Huang YY, Chung TW, Tzeng TW. A method using biodegradable polylactides/polyethylene glycol for drug release with reduced initial burst. Int J Pharm. 1999;182:93–100. doi: 10.1016/S0378-5173(99)00060-5. [DOI] [PubMed] [Google Scholar]
- 41.Kilicarslan M, Baykara T. The effect of the drug/polymer ratio on the properties of the verapamil HCl loaded microspheres. Int J Pharm. 2003;252:99–109. doi: 10.1016/S0378-5173(02)00630-0. [DOI] [PubMed] [Google Scholar]
- 42.Jeyanthi R, Thanoo BC, Metha RC, DeLuca PP. Effect of solvent removal technique on the matrix characteristics of polylactide/glcolide microspheres for peptide delivery. J Control Release. 1996;38:235–244. doi: 10.1016/0168-3659(95)00125-5. [DOI] [Google Scholar]
- 43.Lopedota A, Cutrignelli A, Trapani A, Boghetich G, Denora N, Laquintana V, et al. Effects of different cyclodextrins on the morphology, loading and release properties of poly(dl-lactide-co-glycolide) microparticles containing the hypnotic agent etizolam. J Microencapsul. 2007;24:214–224. doi: 10.1080/02652040601058152. [DOI] [PubMed] [Google Scholar]


