Abstract
The secondary drying phase in freeze drying is mostly developed on a trial-and-error basis due to the lack of appropriate noninvasive process analyzers. This study describes for the first time the application of Tunable Diode Laser Absorption Spectroscopy, a spectroscopic and noninvasive sensor for monitoring secondary drying in laboratory-scale freeze drying with the overall purpose of targeting intermediate moisture contents in the product. Bovine serum albumin/sucrose mixtures were used as a model system to imitate high concentrated antibody formulations. First, the rate of water desorption during secondary drying at constant product temperatures (−22°C, −10°C, and 0°C) was investigated for three different shelf temperatures. Residual moisture contents of sampled vials were determined by Karl Fischer titration. An equilibration step was implemented to ensure homogeneous distribution of moisture (within 1%) in all vials. The residual moisture revealed a linear relationship to the water desorption rate for different temperatures, allowing the evaluation of an anchor point from noninvasive flow rate measurements without removal of samples from the freeze dryer. The accuracy of mass flow integration from this anchor point was found to be about 0.5%. In a second step, the concept was successfully tested in a confirmation experiment. Here, good agreement was found for the initial moisture content (anchor point) and the subsequent monitoring and targeting of intermediate moisture contents. The present approach for monitoring secondary drying indicated great potential to find wider application in sterile operations on production scale in pharmaceutical freeze drying.
KEY WORDS: end point monitor, freeze drying, moisture content, PAT, proteins, secondary drying, TDLAS
INTRODUCTION
Freeze drying is a process widely used in the pharmaceutical industry for the stabilization of labile drugs, particularly proteins (1). The most important stabilizing factor is the removal of the solvent (commonly water) as a reactant and, consequently, a greatly reduced molecular mobility of the active component in the solid state (2). For many products (including proteins), it is beneficial to reduce the final residual moisture (RM) level as much as possible, typically below 1% (3). Recent studies have demonstrated, however, that some biological molecules show an optimum stability at intermediate moisture contents between 1% and 3% (4–6). The targeting of such intermediate moisture contents at the end of secondary drying is, however, a difficult task, based on the limited availability of technical solutions to specifically monitor this drying phase in a noninvasive way. Until today, only invasive measurement procedures are used, which are generally not representative of the entire batch. One common technique in the laboratory is the removal of few vials from the freeze dryer during the drying process using a sample extractor (or sample thief) and analyzing these samples for moisture content. The drying step is then terminated once the target water content is obtained. There are several demerits associated with this procedure: first, the sample vials are mostly taken from positions close to the front door since they are easily accessible. However, vials placed close to the front door are known to dry “atypically”, i.e., much faster than the rest of the vials in the center of the array. Secondly, this sampling procedure usually requires larger distances between the shelves than usual, leading to elevated atypical radiation effects. Lastly, the sample analysis creates substantial delays between sampling and distorts the freeze drying process. While such laboratory data delineate the drying situation of the product in a given lab-scale freeze dryer, the translation of the product drying behavior to pilot or production might be difficult. Note that until today, neither sampling of vials nor any other common technology is available in large-scale freeze drying to delineate the secondary drying progress of the product.
Tunable diode laser absorption spectroscopy (TDLAS) is a non-intrusive spectroscopic method that provides continuous measurements of water vapor concentration, velocity of vapor flow, and mass flow rates in the spool piece in real time during freeze drying (7). Several studies already demonstrated the value of TDLAS technology for pharmaceutical freeze drying (8–10). The goal of this study was to employ TDLAS to monitor the flow of water vapor during secondary drying, obtain an initial average moisture content estimate of the batch, and evaluate its ability to predict the time at which the target moisture is reached. Since targeting of intermediate moisture contents will likely be most relevant for highly concentrated antibody formulations, bovine serum albumin (BSA) was used as surrogate in a binary mixture with sucrose as a typical stabilizer for proteins (11,12).
MATERIAL
A sample solution containing 50 mg/mL sucrose and 20 mg/mL BSA was used as a model. BSA 98% and sucrose 99.5% were purchased from Sigma Chemical Company (St. Louis, MO, USA). Deionized water was further purified using a Nanopure system. All solutions were filtered through a 0.45-μm filter prior to filling. Commercially available 20-mL serum tubing vials from Wheaton (Millville, NJ, USA) and 20-mm stoppers, type Daikyo Flurotec, were purchased from WEST Pharmaceutical Services (Lionville, NJ, USA).
Karl Fischer Residual Moisture Analysis
Residual moisture contents of sample vials were determined using Karl Fischer titration. A Metrohm Karl Fischer Coulometer (Riverview, FL, USA) with Hydranal Coulomat titration solvent from Sigma Chemical Company was used. Three milliliters of dried methanol was added to the sampled vial, stirred shortly, and left to equilibrate for about 3 min. Of the solution, 0.5 mL was then removed volumetrically using a glass syringe and injected into the titration cell. The water content of pure methanol was determined in duplicate prior to the measurement and subtracted from the result.
Freeze Dryer
Experiments were performed on a laboratory-scale freeze dryer (Lyostar II, SP Scientific, Stone Ridge, NY, USA) with three shelves (0.43-m2 shelf area) and SMART™ Freeze Dryer technology installed. A Pirani/capacitance manometer (CM) comparative pressure measurement was employed to determine the end of primary drying. Product temperature at the vial bottom was monitored using calibrated thin wire thermocouples (30-gauge T-type, Omega Engineering, Stamford, CT) placed accurately in center bottom position.
TDLAS Technology
The Lyostar II freeze dryer was equipped with a LyoFlux™ TDLAS Mass Flux Monitor (Physical Sciences Inc., Andover, MA, USA). A fiber-optic collimator transmitter and photodiode receiver were mounted to the freeze dryer duct, connecting the product chamber and the condenser. The near-infrared diode laser beam was launched across the duct at a 45° angle to the gas flow axis through an anti-reflection coated window. The transmitted beam was detected by the photodiode detector and the photocurrent signal transmitted to the TDLAS sensor control unit. For more details on the sensor setup, operation, and measured parameters, the reader is referred to literature previously published on TDLAS (8–10). The TDLAS sensor provides instantaneous measurements of water vapor concentration, flow velocity, and mass flow rate. The mass flow rate is integrated throughout the freeze drying process to provide a continuous indication of the water mass balance. However, the mass balance determination alone is not sensitive enough to determine the product residual moisture content during secondary drying directly from the amount of water removed during primary drying. It has been demonstrated that the accuracy of the mass flow calculations is compromised at the end of primary drying and secondary drying due to low velocities (i.e., <8 m/s) during these process phases (8). In addition, the water content in the freeze-dried material is relatively low during secondary drying, usually on the order of 1% of the mass of solid. Thus, even small errors in the measurement of the total water removed during the drying process result in larger errors in the product residual moisture content.
Experimental Procedure
The kinetics of water removal (through diffusion mechanisms and subsequent desorption) during secondary drying were studied at three constant product temperatures for the BSA/sucrose solution (−22°C at the end of primary drying, −10°C, and 0°C). Note that all temperatures were determined by thin wire thermocouples as described in the section above. Samples were removed during secondary drying and analyzed using Karl Fischer titration. Subsequently, a correlation curve for the mass flow rate at different product temperatures and moisture contents was established. It should be highlighted that this correlation is product- and process-specific. The purpose of this procedure is to predict the amount of water remaining in the product at the start of secondary drying as an “anchor point.” From this point on, integrated TDLAS measurements throughout secondary drying could be used to determine the product residual moisture content without removing the samples. In order to directly determine the residual moisture from TDLAS measurements and terminate the process at the target moisture content, it was imperative to:
reduce moisture heterogeneity among the vials at the end of primary drying which, in turn, facilitates acquisition of representative samples,
investigate the kinetics of water removal at a relatively low and constant product temperature over an extended period of time, and
correlate mass flow readings to the residual moisture content at constant product temperature and establish a direct relationship.
Therefore, the following steps were conducted: First, four calibration runs were performed with isothermal secondary drying shelf temperatures (Ts) of −10°C and 0°C, respectively. Duplicate runs were performed at each temperature. The BSA/sucrose solution was pipetted into 480 vials (5-mL serum tubing) placed onto two shelves of the freeze dryer and lyophilized using the following procedure:
Freezing step: Cool from room temperature to 5°C (1°C/min), equilibrate for 15 min; cool to −5°C (1°C/min), equilibrate for 15 min; cool to −40°C (0.5°C/min) and hold for 60 min.
Primary drying: Ramp shelf to −22°C, chamber pressure 65 mTorr. Effective primary drying was about 50 h, as indicated by the Pirani gauge. Once the Pirani sensor had dropped to about 1.4× of the CM reading, the product was free of ice, but still possessed sufficiently high residual moisture contents between 7% and 9%. This, in turn, leads to high water vapor pressure during the following equilibration step. For equilibration purpose, the vacuum pump was turned off and the isolation valve between chamber and condenser was closed for 7–8 h, leading to a pressure increase in the chamber. During this step, moisture reabsorption by vials containing less moisture (edge vials) occurred, leading to a much more homogenous moisture distribution within the batch (within a 1% deviation range between individual vials).
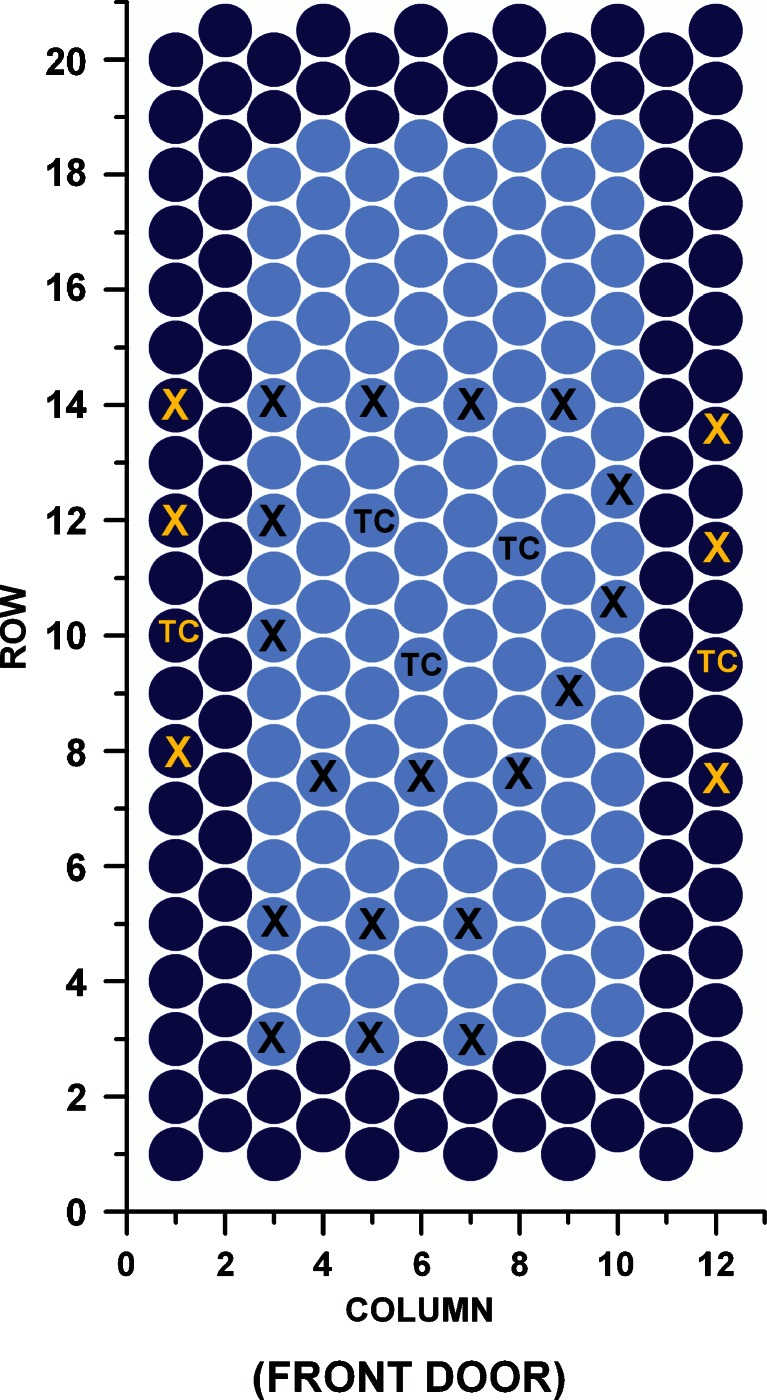
Secondary drying: Before ramping into secondary drying, three to four vials were removed to determine the start RM value (i.e., the “anchor point”). The results of two center vials and of one edge vial were averaged as this reflects the ratio of both vial categories. The shelf temperature was increased rapidly (2.5°C/min) to −10°C or 0°C, respectively. Samples were taken every 60–75 min and analyzed using Karl Fischer titration. TDLAS mass flow rate was recorded and integrated to monitor the amount of water removed from the vials and the remaining residual moisture. Only designated vials that had been weighed empty before the run were taken as samples. The vial arrangement including positions of thermocouples and weighed vials for one shelf is illustrated in detail in Fig. 1. The vials in the outermost row were empty (dummy vials, not shown in Fig. 1) and acted as thermal shields to reduce side radiation effects on edge vials. The thermal shields were used to mimic the superior homogeneity found in production-scale freeze dryers.
Fig. 1.
Illustration of the vial arrangement for the TDLAS secondary drying experiments. The two outermost rows of vials represent “edge” vials
In a second step, the developed relationship between mass flow rate and product temperature was confirmed in a separate experiment. Here, the same number and array of vials was freeze-dried using the standard freezing and primary drying procedure described above. After primary drying, no equilibration was performed, but the shelf temperature was rapidly increased to 0°C and kept constant for 1 h to determine mass flow rate and the corresponding residual moisture content. After the holding time at 0°C, samples were removed for Karl Fischer (KF) analysis and the actual moisture content compared to the predicted value by TDLAS. Then, the shelf temperature was increased 0.3°C/min to 50°C. Note that samples were removed at hourly intervals and analyzed using Karl Fischer titration.
RESULTS AND DISCUSSION
Equilibration Procedure
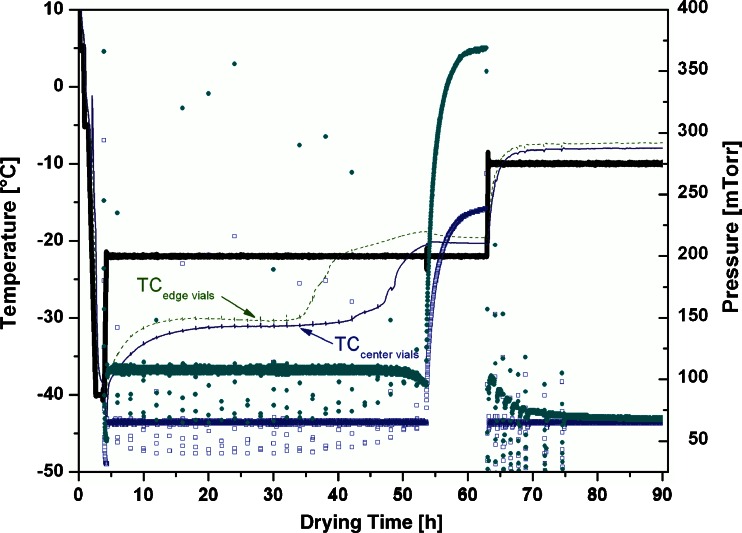
The product temperature in edge vials during primary drying was found significantly elevated by approximately 1°C compared to center vials; the agreement between TCs within each category was mostly within 0.5°C until contact to the ice was lost. Furthermore, the moisture content of edge vials was lower at the end of primary drying. Even within the group of center vials, drying was not completed at the same time and heterogeneity in moisture contents was identified (see Fig. 2). Since a correlation of mass flow rate to moisture content requires homogeneous RM in all vials, the implementation of an equilibration step was mandatory. It is imperative to retain a relatively high moisture level (i.e., in the range from 7% to 10%) at the start of the equilibration procedure in order to achieve a fast increase of water vapor pressure. This, in turn, is essential to establish equilibrium moisture content between the vials. After equilibration, homogeneous moisture content was preserved throughout the process.
Fig. 2.
Isothermal secondary drying experiment (T s = −10°C) including equilibration step. Thick solid line, shelf inlet temperature (T s); thin dotted line, average thermocouple temperature (edge vials); thin solid line, average thermocouple temperature (center vials); open squares, chamber pressure (CM); filled circles, Pirani signal
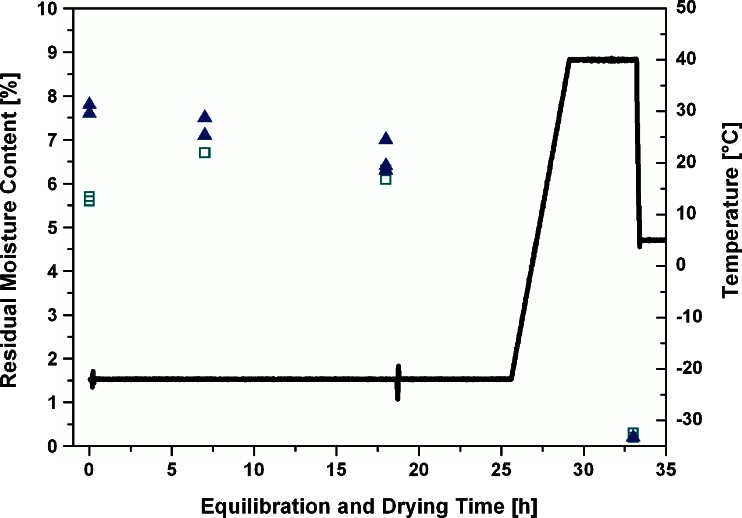
During optimization of the equilibration step, the moisture distribution after primary drying and after equilibration steps of 7 and 18 h was analyzed (Fig. 3). As expected, the moisture content in edge vials increased and in center vials slightly decreased during the equilibration procedure, reaching an average moisture content variability throughout the batch within 1%. Prolongation of the equilibration step from 7 up to 20 h did not significantly improve the homogeneity, but resulted in a minimal overall decrease of moisture content. Note that moisture contents in sampled edge and center vials after the equilibration procedure and at the end of secondary drying were in excellent agreement.
Fig. 3.
Distribution of residual moisture contents in edge and center vials during the equilibration step. Thick solid line, shelf inlet temperature (T s); open squares, residual moisture by Karl Fischer (edge vials); filled triangles, residual moisture by Karl Fischer (center vials)
Correlation Between Residual Moisture and Mass Flow Rates
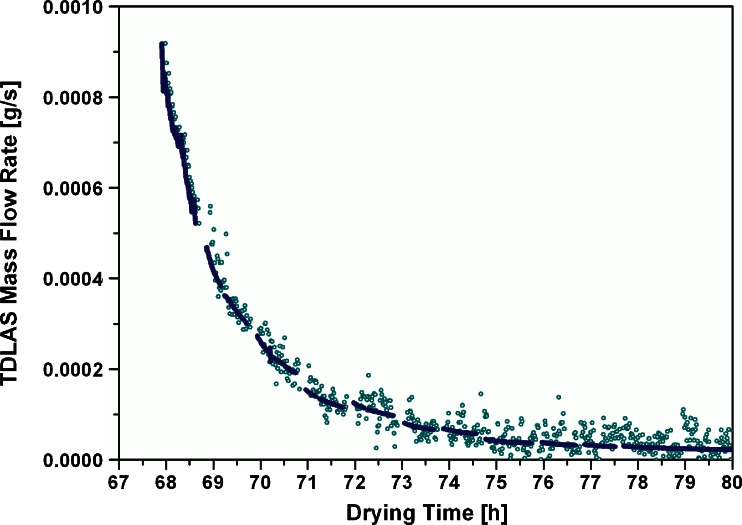
As mentioned above, a demerit of TDLAS technology is the compromise in the sensitivity of mass flow calculations at low gas flow velocities (8). Low gas flow velocities are expected close to the end of primary drying and during secondary drying. To account for this problem, the short-term noise in velocity and mass flow measurements was reduced by recalculating the mass flow rate using the real-time water vapor concentration measurements and the average of flow velocity over approximately 30 min between sampling points. The recalculated mass flow for a representative run at 0°C secondary drying temperature is displayed in Fig. 4. The mass flow recalculated based on average velocities was found in good agreement with the directly calculated TDLAS-based measurements. It is well known that the mass flow rate is high directly after ramping to the desired secondary shelf temperature, but also rapidly decreases, resulting in practically stagnation of water removal after approximately 8 h of secondary drying at 0°C. A similar behavior was observed for the experiments at −10°C with a clearly lower initial mass flow rate at this shelf temperature. For this secondary drying temperature, a slower drop and a similar plateau phase after 8 h of secondary drying was detected. The residual moisture content of samples removed from the chamber during the isothermal secondary drying period was analyzed using Karl Fischer measurements.
Fig. 4.
TDLAS-based recalculated mass flow rate (g/s) during an experiment at 0°C. Open circles, TDLAS-based mass flow rate determination; solid line, recalculated, averaged mass flow rate
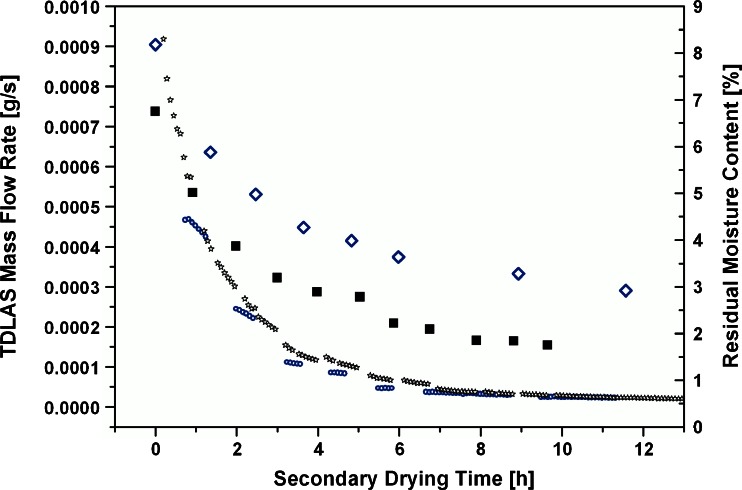
The mass flow rate at each sampling point and the corresponding residual moisture contents in an experiment at −10°C secondary drying temperature over the course of drying are given in Fig. 5. As described above, the mass flow rate decreases rapidly and approaches zero mass flow after about 6–8 h. This behavior is reflected in the residual moisture content which initially drops fast from 8% to 6%, followed by a phase of slower water removal and a plateau phase below 4% with very little additional removal of water. Although the course of both curves appear to be somewhat comparable, it could be pinpointed that the mass flow rate decreased faster than the residual moisture content which remained at 3% during the plateau phase. For practical considerations, such a behavior could be facilitated to obtain intermediate moisture contents for sensitive products in cases where no sophisticated monitoring technologies are available. The procedure would then imply a thorough characterization of the shelf temperature setting associated with the final moisture content of interest (plateau phase). However, moisture targeting using TDLAS technology may be considered as more reliable, flexible, and adjustable, thereby offering multiple advantages over an extended holding time at low shelf temperature, as illustrated in the following.
Fig. 5.
Comprehensive overview of average TDLAS mass flow rate and corresponding moisture content by Karl Fischer at −10°C and 0°C, respectively. Small open circle, TDLAS mass flow rate (−10°C); small open stars, TDLAS mass flow rate (0°C); big open diamonds, Karl Fischer residual moisture content (−10°C); big filled squares, Karl Fischer residual moisture content (0°C)
Figure 5 also displays the development of residual moisture contents during the isothermal secondary drying period in one run with 0°C and the mass flow rates at the sampling points determined from the recalculated mass flow curve. The mass flow rate is initially higher and drops faster than for the experiments at −10°C shelf temperature. This is also reflected in the residual moisture curve which shows a substantial decrease from 7% to 4% in the first 2 h, followed by a slower decrease and a plateau at 2% after 8 h. The moisture content at the plateau is about one percentage point lower than for the isothermal experiments at −10°C.
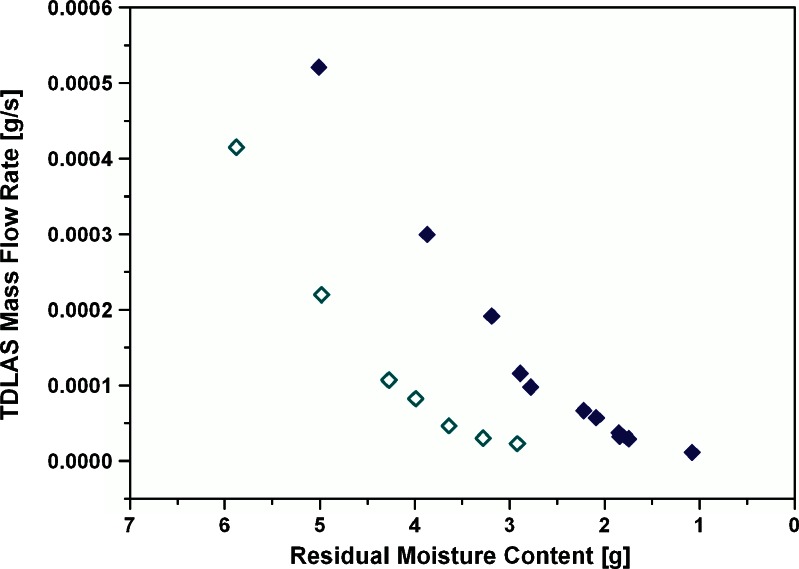
The mass flow rate at the sampling points was plotted against the moisture content determined from sampled vials and is shown in Fig. 6 for one experiment at −10°C and one at 0°C. At both shelf temperatures during secondary drying, the mass flow rate declined linearly with the moisture content until the plateau phase was reached. A linear relationship was observed between 7% and 4% for the experiments at −10°C and between 5% and 2% for the runs at 0°C secondary drying temperature. Within this range, it was possible to generate an accurate linear fit (cf. next section) of the correlation curve, measure mass flow rate at constant product temperature, calculate the moisture content, and restart integration from this point to allow reliable targeting. In addition to the mass flow rates at −10°C and 0°C, the mass flow rate was correlated to the residual moisture content directly after equilibration at −22°C prior to the ramping step. A RM range from 9% to 6% at −22°C could be associated with the mass flow rate and showed an identical linear relationship.
Fig. 6.
TDLAS mass flow rate (g/s) at different moisture contents for a −10°C and a 0°C experiment. Open diamonds, −10°C; filled diamonds, 0°C
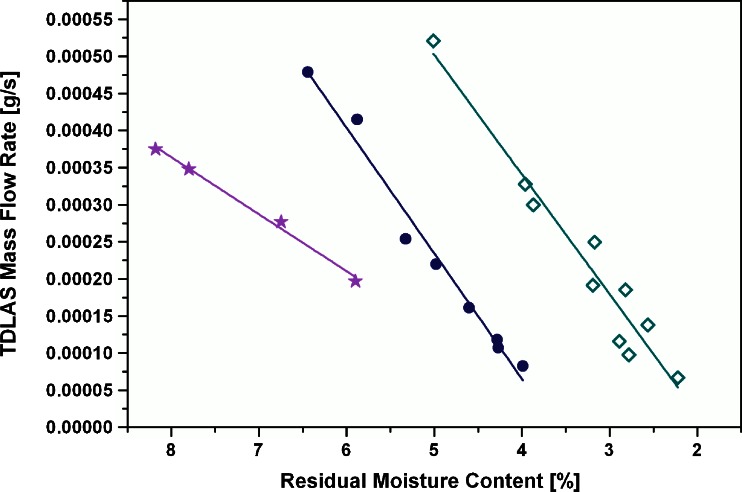
The reproducibility of mass flow rates at comparable moisture contents and identical product temperatures was found excellent for all runs. All curves showed the same pattern with a linear decline and a following plateau phase. The linear parts of the mass flow rate curves at −22°C (RM range from 9% to 6%), −10°C (RM range from 7% to 4%), and 0°C (RM range from 5% to 2%) of all runs were fitted using the linear regression analysis feature in Microcal Origin. The fitted curves and the results are illustrated in Fig. 7. The R2 (coefficient of determination) values ranged from 0.99 to 0.94. These values reflect an excellent quality of the linear interrelation between the measured data. This might be a surprising observation since potential variations affecting the quality of the data were expected to arise from (1) inhomogeneous sampling of just a few vials and (2) comparison of results from different runs. Note that the points at 0°C (R2 = 0.94) show stronger scattering around the fitted line, but display no indications for a deviation from the linear mass flow/moisture relationship. While the fitted lines at −10°C and at 0°C show very similar slopes and are only shifted, the slope at −22°C is significantly lower, suggesting a slower and more constant removal of water over a wider range of moisture contents. The correlation curves appear to be appropriate for providing an estimate of residual moisture content from only measuring the TDLAS mass flow rate and without sampling at the three product temperatures described above. Prior to the subsequent confirmation experiment, the reliability of mass flow integration during secondary drying was studied (cf. next section).
Fig. 7.
Fitted linear section of the mass flow rate of all runs as a function of moisture content. Filled stars, TDLAS mass flow rate (−22°C); filled circles, TDLAS mass flow rate (−10°C); open diamonds, TDLAS mass flow rate (0°C). Corresponding lines represent the fitted data
Comparison of Integrated TDLAS Mass Flow to Karl Fischer Measurements
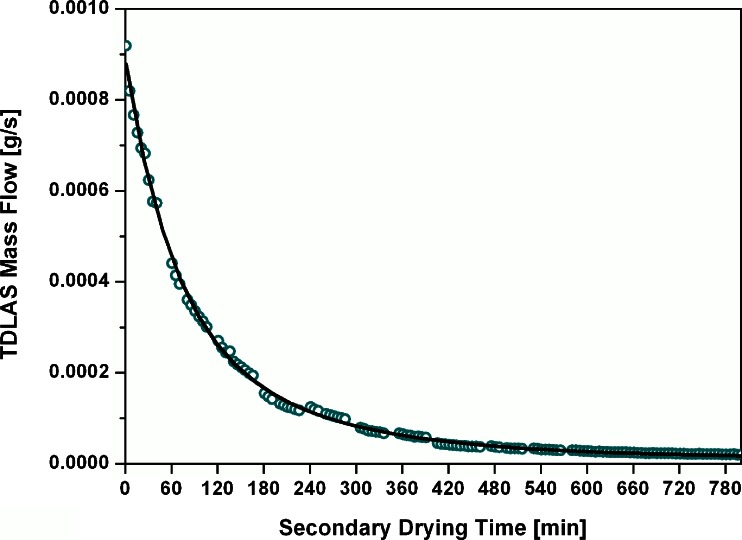
The mass flow rate during the isothermal phase was integrated and compared to the KF measurements. During sampling, no useable mass flow data were available due to the pressure increase in the chamber. Since the main determining factor for mass flow during secondary drying is the product temperature, the short sampling intervals were not expected to introduce significant deviations of the effective mass flow rate. Therefore, the recalculated mass flow rate using average velocity data was fitted to an exponential decay function (Origin 8.1, first-order exponential decay) to interpolate mass flow data during the sampling periods. A representative fitting curve with the recalculated mass flow is shown in Fig. 8. The agreement of the fitted curve to mass flow data was excellent; thus, data during the sampling periods are expected to be reliable and indicative of the process.
Fig. 8.
Recalculated average mass flow rate curve for continuous integration. Open circles, TDLAS mass flow rate; solid line, data fitted to exponential decay function
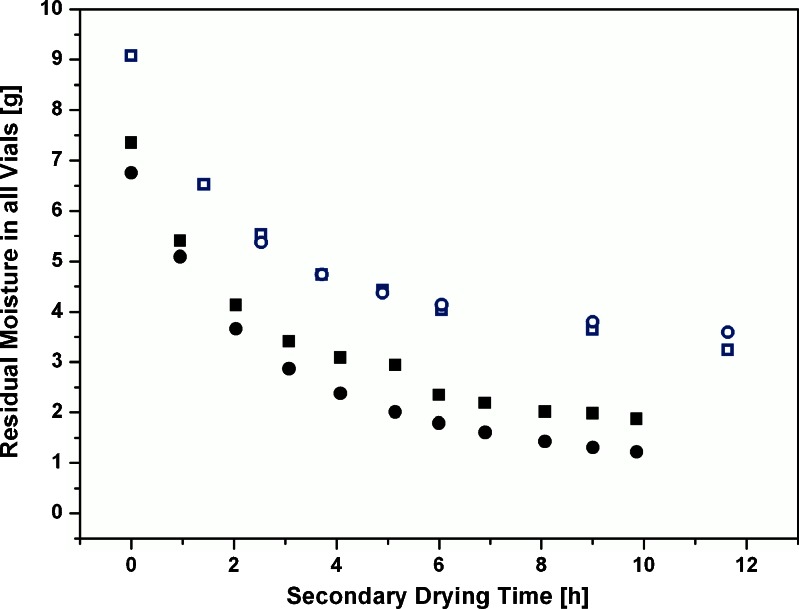
To compare the TDLAS mass flow integration during secondary drying to data from KF measurements, the KF moisture content at the end of the equilibration period was used as a starting point for the integration of TDLAS mass flow rates. The residual moisture at this point was converted to the mass of water in all 480 vials (on the order of 10 g), and TDLAS mass flow measurements were subtracted and compared to the moisture content of sampled vials. The development of moisture content at −10°C and 0°C isothermal secondary drying temperature is shown in Fig. 9. It could be demonstrated that the agreement of RM data between both techniques for secondary drying at −10°C is very good. It should be mentioned that the decrease of moisture content could be monitored with accuracy better than 0.5% if the starting point was taken from Karl Fischer samples after equilibration. For the 0°C runs, however, the agreement between integrated TDLAS mass flow data and sampled vials analyzed by Karl Fischer was found to deteriorate, but was still within 0.5%. The TDLAS mass flow information slightly overpredicted the reduction of moisture once RM decreased below 3%. Overall, the integration of mass flow and the calculation of RM reduction were found possible for the experimental design applied in this study.
Fig. 9.
Comparison of residual moisture measured by Karl Fischer from sampled vials to mass flow integration from TDLAS measurements at −10°C and 0°C. Open squares, residual moisture by Karl Fischer (−10°C); open circles, residual moisture calculated by TDLAS (−10°C); filled squares, residual moisture by Karl Fischer (0°C); filled circles, residual moisture calculated by TDLAS (0°C)
Confirmation of Mass Flow/Moisture Correlation
To prove the concept of monitoring the secondary drying phase using TDLAS without removal of the samples, an additional freeze drying run was conducted with the same experimental conditions. In contrast to the previous runs, no equilibration was conducted. The concept of equilibration might not be acceptable for conventional freeze drying cycles, in particular in a production environment. Instead, primary drying was continued until the Pirani pressure readout decreased to the pressure level of the capacitance manometer. Subsequently, the shelf temperature was increased to 0°C (ramp rate, 2°C/min) and kept constant for 1 h. After this step, a conventional secondary drying step at Ts = +50°C (ramp rate, 0.2°C/min) was implemented for 4 h. Samples were removed using the sample extractor and analyzed by Karl Fischer titration directly after the isothermal period at 0°C and during secondary drying.
As observable from the thermocouple data, the 60-min time interval at 0°C was inappropriate to obtain a product temperature of 0°C and an equilibrium of mass flow rates. As a consequence, the lower temperatures of the correlation curve were employed to calculate the anchor point for mass flow integration. For this purpose, the mass flow rate at −22°C directly prior to ramping and the mass flow at the time point when all thermocouples indicated −10°C were introduced into the respective correlation curve, and the corresponding residual moisture content was calculated. Integration of mass flow was then performed from these anchor points.
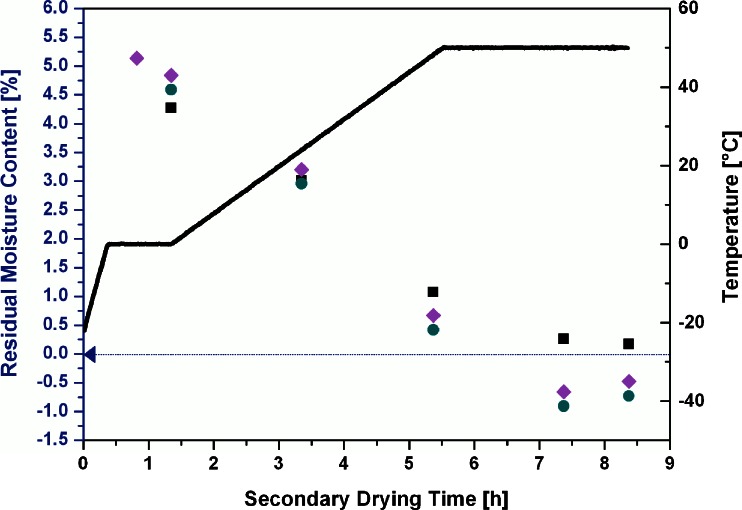
Figure 10 illustrates the comparison of RM values calculated from TDLAS anchor points at −22°C and −10°C and subsequent integration to Karl Fischer results of sampled vials. Anchor points calculated from the correlation curve at both temperatures yielded residual moisture contents in good agreement with the sampled vials. The anchor point calculated from mass flow data at −10°C was slightly higher compared to the anchor point at −22°C, but all values were within 0.5% RM. This agreement is especially remarkable as no equilibration step was conducted. Note that the variation within the sampled vials is expected to be higher than in the previous experiments.
Fig. 10.
Comparison of RM values calculated from TDLAS anchor points at −22°C and −10°C and subsequent integration to Karl Fischer results of sampled vials. Thick solid line, shelf inlet temperature (T s); filled squares, residual moisture by Karl Fischer measurements; filled circles, residual moisture calculated by TDLAS (anchor, −22°C); filled diamonds, residual moisture calculated by TDLAS (anchor, −10°C)
The agreement between integrated TDLAS mass flow measurements and sampled vials during the ramping phase was still found in good agreement until the moisture content decreases below 1%. From this point on, the TDLAS mass flow integration became unreliable due to the reduced sensitivity, which is based on the high contribution of electronic noise to the velocity data. Since the goal of this project was to target intermediate moisture contents (i.e., between 1% and 3%), this demerit of the TDLAS technology cannot be considered as a significant limitation for the present study purpose. For the desired moisture range, both anchor point determination, correlation to residual moisture content, and monitoring of the decreasing moisture content down to 1% were possible with reasonable accuracy.
CONCLUSION
In the present study, monitoring and targeting of intermediate residual moisture contents during secondary drying could be achieved for a thoroughly characterized formulation using TDLAS technology along with an isothermal correlation curve at three temperatures. The true value of the TDLAS monitor for secondary drying would be its use in manufacturing scale units since product sampling is impossible in such an environment. However, the present study illustrates the complexity of such an application in the laboratory, which in essence requires a confirmation of the observed results in larger scale equipment. Moreover, the secondary drying behavior of other formulations must be studied using the TDLAS sensor to allow a generalization about the drying kinetics of products at various temperatures. If such tests are successful, TDLAS may have the potential to become a valuable tool for monitoring the secondary drying step and targeting intermediate moisture contents in lyophilization of sensitive and complex formulations.
ACKNOWLEDGEMENTS
This project has been funded in whole or in part with federal funds from the National Cancer Institute, National Institutes of Health, Department of Health and Human Services under Contract HHSN261200622021C.
REFERENCES
- 1.Pikal MJ. Freeze drying. Encyclopedia of pharmaceutical technology. New York: Marcel Dekker; 2002. pp. 1299–1326. [Google Scholar]
- 2.Franks F. Freeze-drying: from empiricism to predictability. The significance of glass transitions. Dev Biol Stand. 1992;74:9–18. [PubMed] [Google Scholar]
- 3.Pikal MJ, Shah S. Intravial distribution of moisture during the secondary drying stage of freeze drying. PDA J Pharm Sci Technol. 1997;51(1):17–24. [PubMed] [Google Scholar]
- 4.Pikal MJ, Dellerman KM, Roy ML, Riggin RM. The effects of formulation variables on the stability of freeze-dried human growth hormone. Pharm Res. 1991;8(4):427–436. doi: 10.1023/A:1015834724528. [DOI] [PubMed] [Google Scholar]
- 5.Breen ED, Curley JG, Overcashier DE, Hsu CC, Shire SJ. Effect of moisture on the stability of a lyophilized humanized monoclonal antibody formulation. Pharm Res. 2001;18(9):1345–1353. doi: 10.1023/A:1013054431517. [DOI] [PubMed] [Google Scholar]
- 6.Sarciaux JM, Hageman MJ. Effects of bovine somatotropin (rbSt) concentration at different moisture levels on the physical stability of sucrose in freeze-dried rbSt/sucrose mixtures. J Pharm Sci. 1997;86(3):365–371. doi: 10.1021/js960217k. [DOI] [PubMed] [Google Scholar]
- 7.Schneid S, Gieseler H. Process analytical technology (PAT) in freeze drying: tunable diode laser absorption spectroscopy as an evolving tool for cycle monitoring. Eur Pharm Rev. 2009;13(6):18–25. [Google Scholar]
- 8.Gieseler H, Kessler WJ, Finson M, Davis SJ, Mulhall PA, Bons V, et al. Evaluation of tunable diode laser absorption spectroscopy for in-process water vapor mass flux measurements during freeze drying. J Pharm Sci. 2007;96(7):1776–1793. doi: 10.1002/jps.20827. [DOI] [PubMed] [Google Scholar]
- 9.Schneid SC, Gieseler H, Kessler WJ, Pikal MJ. Non-invasive product temperature determination during primary drying using tunable diode laser absorption spectroscopy. J Pharm Sci. 2009;98(9):3406–3418. doi: 10.1002/jps.21522. [DOI] [PubMed] [Google Scholar]
- 10.Kuu WY, Nail SL, Sacha G. Rapid determination of vial heat transfer parameters using tunable diode laser absorption spectroscopy (TDLAS) in response to step-changes in pressure set-point during freeze-drying. J Pharm Sci. 2009;98(3):1136–1154. doi: 10.1002/jps.21478. [DOI] [PubMed] [Google Scholar]
- 11.Wang W. Lyophilization and development of solid protein pharmaceuticals. Int J Pharm. 2000;203(1–2):1–60. doi: 10.1016/S0378-5173(00)00423-3. [DOI] [PubMed] [Google Scholar]
- 12.Wang B, Tchessalov S, Warne NW, Pikal MJ. Impact of sucrose level on storage stability of proteins in freeze-dried solids: I. Correlation of protein–sugar interaction with native structure preservation. J Pharm Sci. 2009;98(9):3131–3144. doi: 10.1002/jps.21621. [DOI] [PubMed] [Google Scholar]


