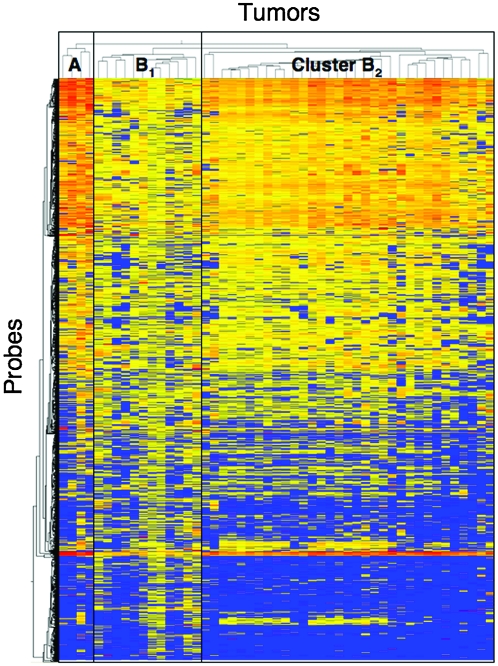
Fig. 4.
Unsupervised two-dimensional hierarchical clustering analysis based on array CGH analysis of UCs (T1 to T49). Forty-nine patients with UCs were hierarchically clustered into three subclasses, clusters A (n = 4), B1 (n = 12) and B2 (n = 33), based on copy numbers. Copy numbers of 0 or 1 (loss), 2 (no change) and ≥3 (gain) on each probe are shown in blue, yellow and red, respectively. The cluster trees for tumors and probes are shown at the top and to the left of the panel, respectively.

