

Summary
The adaptive immune system is thought to be a rich source of protein biomarkers, but diagnostically useful antibodies remain unknown for a large number of diseases. This is, in part, because the antigens that trigger an immune response in many diseases remain unknown. We present here a general and unbiased approach to the identification of diagnostically useful antibodies that avoids the requirement for antigen identification. This method involves the comparative screening of combinatorial libraries of unnatural, synthetic molecules against serum samples obtained from cases and controls. Molecules that retain far more IgG antibodies from the case samples than the controls are identified and subsequently tested as capture agents for diagnostically useful antibodies. The utility of this method is demonstrated using a mouse model for multiple sclerosis and via the identification of two candidate IgG biomarkers for Alzheimer's Disease.
Introduction
There is great interest in the discovery of disease-specific protein biomarkers in easily accessible biological fluids such as serum. A particularly interesting sub-proteome in this regard is the IgG antibody population (Anderson and LaBaer, 2005). The adaptive immune system is known to react specifically to many different disease states, in part through the amplification of particular antibodies that recognize disease-specific antigens. Thus, it should be possible to devise diagnostic tests for many different diseases based on the measurement of the levels of these antibodies in serum. However, this has proven difficult. Since antibodies are highly specific receptors for their cognate antigens, the general thinking is that a diagnostic test designed to monitor the level of a disease-specific antibody would require immobilized antigen as a “capture agent”. Unfortunately, there are many pathogenic conditions, including autoimmune diseases, neurological conditions and cancers, for which the antigens that trigger the primary immune response are unknown and thus a definitive blood test is not available.
To address this problem, powerful proteomics technologies have been employed to screen large collections of expressed proteins, peptides or other biomolecules in an attempt to discover native antigens recognized by disease-specific antibodies. Some notable successes have been achieved (Fatham et al., 2005; Frulloni et al., 2009; Gibson et al., 2010; Hudson et al., 2007; Kanter et al., 2006; Lueking et al., 2003; Robinson et al., 2002a; Steller et al., 2005; Wang et al., 2005). However, none of these techniques appears to represent a general route to the rapid discovery of antibody biomarkers of real diagnostic utility. It is reasonable to suspect that a limitation of screens that employ collections of unmodified peptides, protein or lipids is that they are unlikely to contain the primary autoantigens that trigger the earliest and most disease-specific autoimmune response. It seems more likely that these primary antigens are biomolecules that are chemically modified in unusual ways due to the pathogenic chemistry involved in that particular disease state. In other words, it may be that collections of unmodified biomolecules represent the wrong region of “chemical space” in which to be looking for autoantigens or mimics thereof.
With this hypothesis in mind, we were interested in testing a fundamentally different approach in which a combinatorial library of unnatural synthetic molecules is screened for ligands that bind antibodies abundant in the serum of animals or patients with a particular disease, but not healthy controls. The idea behind this approach is that unnatural molecules will simply represent a “shape library” that occupies regions of chemical space outside of that represented by unmodified biomolecules. A few of these molecules might, by chance, recognize the antigen-binding pocket of disease-specific antibodies well enough to retain them from the blood, though they would almost certainly not bind as well as the (unknown) native antigens. This is the thinking behind almost any high-throughput screen of synthetic molecule libraries or collections against protein drug targets of pharmaceutical interest. Moreover, while antibodies are generally not considered drug targets, it is known that antibody ligands with structures quite different from that of the native antigen can be isolated through library screening. For example, peptide libraries have been screened successfully for “mimotopes” that bind to carbohydrate-binding antibodies and these peptides can even be used as vaccines to raise antibodies against the native carbohydrate antigen (Knittelfelder et al., 2009). However, to the best of our knowledge, all such mimotope screens have employed a single, well-defined antibody target and have not been utilized in de novo searches for diagnostically useful antibody biomarkers.
We demonstrate here that microarrays displaying thousands of peptoids (N-substituted oligoglycines (Simon et al., 1992)) can be used along with a differential screening strategy for the simultaneous isolation of candidate IgG antibody biomarkers and selective peptoid ligands able to pull them out of the blood. In two mouse models, it is shown that these peptoids are antigen surrogates in the sense that they bind selectively to the antibodies raised against the antigen employed to trigger the disease state. This methodology provides an unbiased approach to the discovery of IgG serum biomarkers that does not require prior knowledge of native antigens. In this report, we describe the development of this technology and its application to a mouse model for multiple sclerosis. We also demonstrate that the approach is applicable to the discovery of potentially useful diagnostic biomarkers in humans through the discovery of compounds that bind antibodies that are present at high levels in the serum of patients with Alzheimer's Disease.
Results
Identification of Synthetic Ligands for EAE-Specific Antibodies In Mice
Our strategy for the unbiased isolation of synthetic molecule-antibody complexes of diagnostic utility is depicted in Figure 1. We hypothesized that if one exposed crude serum containing the entire complement of circulating antibodies to a large library of synthetic molecules immobilized on a microscope slide, each antibody would, by chance, bind specifically to a few molecules in the library with sufficient affinity and specificity to be retained on the slide. This is the philosophy behind any protein-targeted combinatorial library screening experiment. IgG antibody binding to the array could be visualized by subsequent addition of a fluorescently labeled secondary antibody. The fluorescence intensity at each feature on the microarray would thus reflect the amount of antibody retained by each compound. Since the adaptive immune response results in the amplification of B cells that recognize “foreign” antigens, the antibodies they produce will be present at much higher levels in the blood of animals exposed to a particular antigen or with a particular disease than in the blood of matched control animals. Therefore, the features on the array to which they bind should “light up” to a far greater extent than would be the case when serum obtained from a control animal is hybridized to the array. If so, this would allow the unbiased identification of synthetic ligands for antibodies that are amplified in a particular immunological state. This approach does not require any foreknowledge of the nature of the antigens that drive the immune response. Note that this strategy is not an attempt to obtain a “fingerprint” or “signature” of a disease state. Rather it is an unbiased high throughput screen for a few specific antigen surrogates of diagnostic utility in a large synthetic combinatorial library.
Figure 1. Schematic representation of the strategy employed to identify synthetic molecules that capture antibody biomarkers.

The Y-shaped figures represent IgG antibodies. The figure depicts hypothetical binding of an antibody present at high levels in an autoimmune serum sample, but not in a healthy serum sample, binding to two compounds on a microarray. After subsequent probing with a fluorescently-labeled secondary antibody, this would produce a much higher intensity at these two spots on the array (indicated in red scale) after exposure to the autoimmune serum sample than the healthy serum sample.
To explore this idea, we employed microarrays comprised of two copies each of 4608 octameric peptoids along with various markers and control spots. The peptoid library (see Supp. Fig. S1) was synthesized using the split and pool method (Alluri et al., 2003; Figliozzi et al., 1996). Methods employed to construct the peptoid microarrays have been reported previously (Reddy and Kodadek, 2005). While these molecules share the α-amino acid backbone of peptides, they are quite different otherwise, in that the side chains protrude from the main chain nitrogen (sp2-hybridized) rather than the α-carbon (sp3-hybridized), giving them a completely different shape. Moreover, we employed a library of peptoids in which many of the side chains did not resemble any of the twenty naturally occurring amino acids (Supp. Fig. S1). Therefore, the peptoid library represents a collection of molecular shapes that could not possibly have been “seen” by the immune system in vivo and could not mimic a native antigen closely.
Two C57BL/6 mice were immunized with Complete Freund's Adjuvant (CFA) and a peptide derived from Myelin Oligodendrocyte Glycoprotein (Mog), while two additional mice were injected with CFA alone as a control. The Mog-immunized animals develop a syndrome called Experimental Autoimmune Encephalomyelitis (EAE) that resembles human multiple sclerosis in some respects and is one of the most commonly used animal models for this disease (Hauser, 2008; McFarland and Martin, 2007). Serum samples were collected from the mice 36 days following immunization. They were then diluted several thousand-fold to provide a final total serum protein concentration of 15 μg/ml and hybridized to the peptoid microarray. After incubation and washing, the IgG binding pattern was visualized by subsequent incubation with an Alexa-647-labeled secondary antibody. As a control, the secondary antibody alone was exposed to the array and any features that bound significant amounts of the labeled secondary antibody were ignored in subsequent analyses.
Fig. 2A shows raw data from such an experiment. As expected, the Mog peptide employed as the antigen, when spotted onto the array as a positive control, captures large amounts of IgG antibodies from the serum collected from Mog/CFA-immunized mice, but not mice immunized with CFA alone. Several peptoids were identified that were reproducibly (n = 3 arrays) much brighter when exposed to the Mog/CFA-immunized serum than the CFAimmunized serum (an intensity of >40,000 vs. < 10,000 at this particular serum protein concentration at these instrument settings). One of these is highlighted in Fig. 2A.
Figure 2. Identification and characterization of peptoids that capture antibodies present at high levels in Mog peptide-immunized mice.
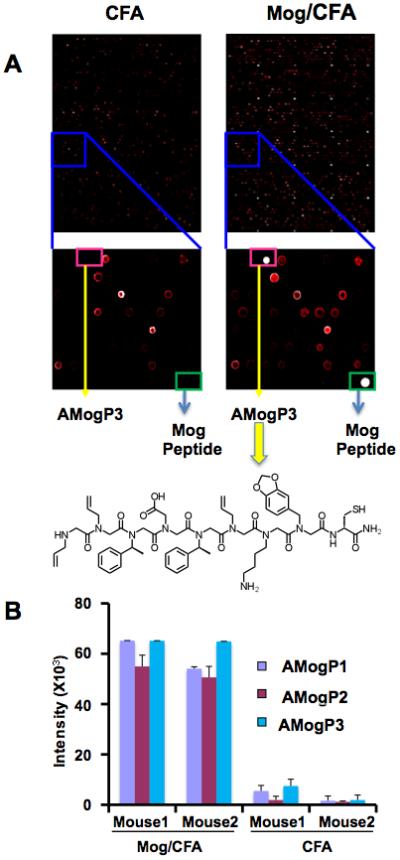
A. Raw images of peptoid arrays hybridized with serum obtained from CFA- or CFA +Mog peptide-immunized mice. About half of two arrays are shown at the top. The sections of the arrays boxed in blue are blown up to highlight a region displaying one of the peptoids (AMogP3) that clearly distinguished the CFA- and CFA+Mog peptide-immunized mice. Images were obtained by incubating serum from immunized mice with the array followed by addition of fluorescently labeled (Alexa-647) Goat-anti Mouse IgG antibody. The intensity of the fluorescence at each spot is displayed in a false-colored red scale in which a white spot means the intensity is beyond the linear range of the detector. The structure of AMogP3, the compound that is highlighted in the pink box, is shown as its free form. The molecule was tethered covalently to the array via the cysteine sulfur that is included in all of the molecules in the library. B. Quantitation of the fluorescence intensity measured at each of the three peptoid (AMogP1-3) features on the array that discriminate CFA + Mog peptide- from CFA-immunized mice. The bars depict the mean ± the standard deviation for three independent experiments. The general structure of the library employed to make the array shown in Supp. Fig. S1. The structures of the other two peptoids, AMogP2 and AMogP3, that distinguish control and EAE mice, are shown in Supp. Fig. S2
The peptoids, named anti-Mog antibody-binding peptoids 1-3 (AMogP1-3), that provided the highest level of discrimination were sequenced by tandem mass spectrometry using soluble peptoid from the well storing the solution used to spot onto the glass slide. Their structures bear no obvious resemblance to that of the peptide antigen (Fig. 2 and Supp. Fig. S2) and, in fact, could not have since many of the building blocks employed to construct the peptoid library were not analogues of natural amino acids (Supp. Fig. S1).
Validation of AMogP1-3 as specific diagnostic biomarkers for EAE
A critical issue in any biomarker discovery effort is to test the putative marker in a blinded fashion on subjects that were not employed in the “training set” used to discover the marker in the first place (Ransohoff, 2005). Therefore, the ability of peptoids AMogP1-3 to distinguish seven other Mog/CFA-immunized mice from seven other CFA-injected animals was analyzed in a series of blinded experiments. None of these mice had been used in the training set. As shown in Fig. 3, all three peptoids performed perfectly in distinguishing the Mog peptide-immunized mice from the control mice. Fig. 3A shows the quantification of data obtained in three independent experiments using “sub-arrays” (see Fig. 3B) that display AMogP1-3, the Mog peptide antigen and a negative control peptide using serum obtained from mice 36 days following immunization with CFA or CFA + Mog peptide (EAE). The negative control peptide, which was used in all subsequent experiments, represents residues 1-11 of mouse Myelin Basic Protein (ASQKRPSQRSK). This peptide was chosen as a control for antigen-specific capture of antibodies since immunization of mice with it can also lead to EAE, but through the production of different antibodies and T cells (Hauser, 2008).
Figure 3. Validation of peptoids AMogP1-3 as capture agents for EAE-specific antibodies.

A. “Sub-arrays” containing only AMogP1-3, the Mog peptide and a MBP-derived negative control peptide were created. Serum from seven Mog/CFA-immunized and seven CFA-injected mice not used in the previous experiments were analyzed in a blinded fashion. The fluorescence intensity observed at each feature is shown after unblinding the sample identities. Shown is the mean ± S.D. for samples run in triplicate. B. Raw images of sub-arrays containing the AMogP1-3, control peptide and Mog peptide that were incubated with serum from a Mog + CFA-immunized mouse (left) or a CFA-immunized mouse (right). C. Selectivity of peptoids for antibodies present in Mog peptide-immunized mice. Sub-arrays containing the AMogP1-3 peptoids, the Mog peptide, the Ova peptide and a control peptide were exposed to serum from three mice immunized with Ova peptide (Ova1-3) or three mice with SLE (SLE1-3) followed by a fluorescently labeled secondary antibody. The fluorescence intensities at each feature are shown. Mean ± S.D. for samples run in triplicate. Supp. Fig. S2 displays the peptide sequences and peptoid structures.
To test the selectivity of these peptoids for antibodies amplified in the Mog peptide-immunized mice, animals of the same genetic background were immunized with CFA and a peptide antigen derived from Ovalbumin (Ova; see Supp. Fig. S2 for the peptide sequence). Serum collected from these mice 36 days after immunization displayed strong reactivity with the Ova peptide antigen (Fig. 3C). However, only background levels of IgG antibody were captured by AMogP1-3 from this serum sample (Fig. 3C). To further test their selectivity, serum was collected from B6 mice with Systemic Lupus Erythematosus (SLE) (Liu and Wakeland, 2001) and exposed to these peptoids. Again, only background levels of antibodies were retained (Fig. 3C). These data argue that the AMogP1-3 peptoids are selective capture agents for antibodies produced in Mog/CFA-immunized mice.
We next asked if the peptoids were capable of tracking the development of the adaptive immune response that leads to EAE. Serum samples were collected from a Mog peptide/CFA immunized mouse at various time points following antigen injection and these serum samples were analyzed on a small sub-array displaying peptoids AMogP1-3, the Mog peptide antigen and the myelin basic protein (MBP)-derived control peptide. As shown in Fig. 4A, little or no signal above background was observed on any of the peptoids from the serum samples collected immediately prior to injection or seven days later. However, by 14 days post-injection, significant signal was seen on the peptoid features and by 21 days all three EAE-specific peptoids evinced a strong signal (note that an intensity of 60-65 thousand units represents saturation of the detector at these instrument settings). This time course is in line with the expected kinetics of the development of an adaptive immune response. The behavior of the peptoids as ligands for the EAE-specific antibodies was similar to that of the Mog peptide antigen, whereas the control peptoid did not capture significant amounts of antibody at any time point. We conclude that peptoids AMogP1-3 are capable of monitoring the development of an adaptive immune response over time.
Figure 4. Peptoids AMogP1-3 capture anti-Mog peptide antibodies resulting from an adaptive immune response.

A. Level of IgG antibody captured by the peptoids as a function of time after immunization. Sub-arrays displaying the molecules indicated were incubated with serum collected from mice at the indicated times after immunization with Mog peptide+CFA, followed by fluorescently labeled secondary antibody. The amount of fluorescence captured at each feature is shown. B. Effect of depletion of anti-Mog peptide antibodies on the amount of IgG antibodies captured by the peptoids. Serum from Mog peptide + CFA-immunized mice was passed over columns displaying either excess Mog peptide or a control peptide. These Mog depleted or mock depleted serum samples were then hybridized to a sub-array displaying AMogP1-3, Mog peptide and a control molecule. After subsequent hybridization with labeled secondary antibody, the signal intensities were recorded and plotted. Mean ± S.D. for samples run in triplicate.
Characterization of the Peptoid-Binding Antibodies
Given that the antibodies captured by the AMogP1-3 peptoids arise over a time frame of two to three weeks following immunization with the Mog peptide, it seems likely that they indeed capture anti-Mog peptide antibodies, rather than antibodies directed against some other antigen that might arise as a secondary response to the developing autoimmune disease. To determine if this is indeed the case, serum from Mog/CFA-immunized mice was passed over an excess of Mog peptide coupled to sepharose or a control peptide column. These sera were then hybridized to a sub-array that included AMogP1-3, Mog peptide and the control peptide. As shown in Fig. 4B, depletion of the anti-Mog antibodies from the serum of the Mog/CFA-immunized mice abolished IgG antibody binding to the immobilized peptoids, whereas passage of the serum over the control column resulted in strong binding of IgG antibody to the peptoids. As expected, the same result was observed when the level of antibodies captured by the Mog peptide was analyzed. We conclude that these peptoids bind to anti-Mog IgG antibodies.
Identification of Selective Ligands For Anti-Ova Peptide Antibodies
To determine if this approach is useful to identify antibodies and cognate peptoid ligands unique to other immunological states, or if the EAE mice somehow represent a special case, we turned to the Ova peptide/CFA-immunized mice. These mice are healthy and are not afflicted with an autoimmune inflammatory disease, as is the case in EAE. Using exactly the same methods described above for the analysis of the Mog/CFA-immunized mice, we identified three peptoids that captured much higher levels of IgG antibodies from the serum of two Ova/CFA-immunized animals than from two CFA-immunized controls (see Supp. Fig. S3). These peptoids, called anti-Ova antibody-binding peptoids 1-3 (AOvaP1-3), were sequenced by tandem mass spectrometry. Their structures are shown in Supp. Fig. S2.
To further explore the utility of these putative biomarkers for Ova peptide immunoreactivity, sub-arrays containing AOvaP1-3, the Ova peptide antigen and the control peptide were employed in blinded experiments using serum obtained from eight OVA/CFAimmunized and eight CFA-immunized mice not employed in the training set 21 days after immunization. As shown in Fig. 5A and 5B, all three peptoids exhibited much higher signals when exposed to serum collected from the OVA/CFA-immunized mice than when exposed to serum for the CFA-immunized mice.
Figure 5. Validation of peptoids identified as biomarkers of ovalbumin immunoreactivity.

A. Sub-arrays” containing only AOvaP1-3, the Ova peptide and a control peptide were created. Serum from seven Ova peptide + CFA-immunized and seven CFA-injected mice not used in the previous experiments were analyzed in a blinded fashion. The fluorescence intensity observed at each feature is shown after unblinding the sample identities. B. Raw images of sub-arrays containing the control peptide, AOvaP1-3 and Ova peptide that were incubated with serum from Ova + CFA-immunized mouse (left) or a CFA-immunized mouse (right). C. Selectivity of peptoids for antibodies present in Ova peptide-immunized mice. Sub-arrays containing the AOvaP1-3 peptoids, the Mog peptide, the Ova peptide and a control peptide were exposed to serum from three mice immunized with Mog peptide (Mog1-3) or three mice with SLE (SLE1-3). The fluorescence intensities at each feature observed after probing with the fluorescently labeled secondary antibody are shown. Error bars represent the mean ± S.D. for samples run in triplicate. The structures of the Ova peptide antigen and the peptoids that distinguish Ova-immunized from control mice (AOvaP1-3) are shown in Supp. Fig. S2. Supp. Fig. S3 displays some of the primary data that led to the identification of AOvaP1-3 as discriminators of mice that were and were not immunized with Ova peptide. Supp. Fig. 4 demonstrates that peptoids AOvaP1-3 bind anti-Ova peptide antibodies.
The selectivity of the peptoids was tested by exposing them to serum derived from Mog peptide-immunized animals or mice with SLE. As shown in Fig. 5C, very little cross-reactivity between peptoids AOvaP1-3 and IgGs in these serum samples was observed.
A time course experiment using serum samples collected 0,7,14, or 21 days after immunization with Ova peptide + CFA or CFA alone was conducted. This showed a build-up of antibodies that recognize both the peptoids and the Ova peptide over time. In this case 21 days were required to observe a robust response (Supplementary Fig. S4A). Finally, as shown in Supplementary Fig. S4B, depletion of the anti-Ova peptide antibodies from the serum of the Ova/CFA-immunized mice by passage over immobilized Ova peptide largely abolished IgG antibody binding to the peptoids, whereas passage of the serum over an immobilized control peptide did not. This argues that the peptoids recognize anti-Ova peptide antibodies.
Discovery of Candidate IgG Biomarkers for Alzheimer's Disease
It was important to determine if the protocol described above is capable of identifying potentially useful diagnostic antibody-peptoid pairs for a human disease state. To address this point, we undertook an effort to search for IgG antibodies that are enriched in the serum of patients with Alzheimer's Disease (AD). AD is the most common form of dementia and is a rapidly growing problem in the developed world due to the aging of the population. While careful clinical examination conducted by an expert, combined with radiological scans, is a reasonably effective method with which to diagnose the disease, the only unequivocal protocol for the diagnosis of AD is a post-mortem autopsy of the brain (Hampel et al., 2010). No blood test for this disease has yet been reported (Blennow et al., 2010), though an increase in the serum protein Clusterin has recently been reported to accompany AD (Thambisetty et al., 2010).
Using the same procedure described above for the EAE mice, serum samples from six AD patients (McKhann et al., 1984) (three of which were autopsy-confirmed; see Supplementary Table 1 for clinical parameters) were analyzed using peptoid microarrays displaying approximately 15,000 peptoids. Each sample was analyzed in triplicate. The same procedure was carried out with serum samples obtained from six age-matched, non-demented control individuals (NC23-28, see Supplementary Table 1). To attempt to ensure specificity for AD, we also analyzed six serum samples obtained from Parkinson's Disease (PD) patients (Gelb et al., 1999) as well. After measuring the signal level on each spot of each array, three peptoids were chosen that best distinguished the AD patients from the controls. These peptoids captured at least three-fold more IgG antibody from all six of the AD patients than any of the control subjects (Fig. 6) or PD patients (Fig. 7A). The structures of the three peptoids were deduced by tandem mass spectrometry and are shown in Fig. 6. They were named AD peptoids (ADP) 1-3.
Figure 6. Peptoids that retain antibodies from the serum of patients with Alzheimer's Disease.

A peptoid library was screened for ligands to AD-specific IgG antibodies. The structures of the three best peptoids that were found to discriminate age-matched controls and AD patients are shown in the top right. The levels of antibodies retained from the indicated serum samples in subsequent sub-array experiments are shown on the left. The numbers indicate a patient identifier (for example, AD1 or NC9; only every other number is shown). The samples employed in the training sets are labeled as such (AD Train and NC Train) as are the samples employed in blinded test studies. AD = Alzheimer's Disease, NC = normal control. The error bars indicate the mean ± S.D. for samples run in triplicate. See text for details. Supp. Tables S2-S6 and Supp. Fig. S5 present a detailed statistical analysis of these data as well as those shown in Fig. 7A. Supp. Fig. S6 demonstrates that the intensities shown in this figure represent the high end of the linear range of the assay.
Figure 7. Peptoids ADP1-3 bind two different antibodies that are present in the serum of Alzheimer's patients, but not patients with Parkinson's Disease (PD) or lupus (SLE).

A. Comparison of levels of IgG antibodies captured by peptoids ADP1-3 from serum samples collected from a patient with AD (individual 1), a normal control (individual 23) or patients with Parkinson's Disease (PD) or lupus (SLE). B. Serum from an autopsy-confirmed AD patient was passed repeatedly over immobilized ADP1 or, as a control, an irrelevant peptide. The serum samples were then diluted and hybridized to sub-arrays displaying peptoids ADP1-3. The amount of antibody captured by each peptoid was measured. Shown is the Mean ± S.D. for samples run in triplicate. Supp. Tables S2-S6 and Supp. Fig. S5 present a detailed statistical analysis of these data as well as those shown in Fig. 6.
To further test these three peptoids as potential capture agents for AD-specific antibodies, sub-arrays displaying re-synthesized and HPLC-purified ADPs1-3 as well as controls were employed to analyze serum samples obtained from sixteen different AD patients, sixteen new controls and samples from six lupus patients. These experiments were conducted in a blinded fashion. When the samples were unblinded, the data showed that peptoids ADP1-3 captured much more IgG antibodies from the AD patients than fourteen of the control individuals (Fig. 6) or the six lupus patients (Fig. 7A). Two of the control individuals (NC31 and NC41) displayed an unusually high level of antibodies that cross-react with each the three ADPs, comparable to that found in the serum of AD patient 15, who exhibited the lowest levels of peptoid-reactive antibodies from the AD set. Overall, for the AD vs. NC subjects, the sensitivity was 93.7% for each of the peptoids and specificity was from 93.7-100%. The Positive and Negative predictive values were greater than 93% for each of the peptoids, and the accuracy ranged from 93-96%. Finally, the area under the curve for each of the three peptoids was 0.99 ± 0.01 (see Supp. Fig. S5 and Supp. Tables S2-S6 for a full statistical analysis).
The fluorescent intensities of the ADP1-3 spots on the sub-arrays employed for these experiments were at or near the saturation point for the detector. To ensure that we were close to the linear range, measurements were redone at different serum protein concentrations. As shown in Supp. Fig. S6A, the sample from an AD patient demonstrated concentration-dependent signals that saturated at a total serum protein concentration of 15 μg/ml, the concentration employed for all of the experiments whose results are shown in Figures 6 and 7. The intensity of the signal was also linear at different photomultiplier tube gains on the scanner (Supp. Fig. S6B). We conclude that the ratios of the peptoid binding antibodies in case and control samples presented in Fig. 6 represent a valid quantitative comparison.
To determine if peptoids ADP1, 2 and 3 bind the same antibodies, serum from one of the autopsy-confirmed AD patients was passed repeatedly over a column containing immobilized ADP1 in order to completely deplete the sample of antibodies that bind to this peptoid. As a control, the same procedure was done using a column displaying a control peptide (MBP Ac1-11; see Supp. Fig. S2 for sequence). The serum was then exposed to a sub-array displaying ADPs1-3 and the level of IgG antibodies captured by each peptoid from the ADP1-depleted and mock-depleted samples were measured. As shown in Fig. 7B, immobilized ADP1 bound high levels of antibody from the mock-depleted AD sample, but almost no IgG was captured from the ADP1-depleted sample, as expected. Depletion of the ADP1-binding antibodies also reduced the amount of IgG captured by ADP3 to background levels, arguing that these two peptoids capture the same antibodies. In stark contrast, depletion of ADP1-binding antibodies had no effect on the amount of IgG captured by ADP2, arguing that this peptoid binds different antibodies than ADP1 and ADP3.
Discussion
We have described here a technology with which the entire complement of serum IgG antibodies can be screened against a peptoid library in order to identify complexes of disease-specific antibodies and individual peptoids. This approach to the discovery of serum antibody biomarkers differs from other efforts of which we are aware in that it makes no attempt to directly identify the native antigen or a close mimic thereof by screening libraries of peptides, lipids, proteins, nucleic acids or other naturally occurring molecules. Instead, the idea behind this approach is that it should be possible to use high-throughput screening to identify a synthetic, unnatural molecule that happens to have the right shape and chemical functionality to bind the antigen recognition pocket of the antibody of interest well enough to pull it out of serum, even if said molecule does not bind as well as the native antigen. While peptoids and peptides share an α-amino acid backbone, they are otherwise quite different in shape and chemical properties. For example, the side chain in peptoids protrudes from the main chain nitrogen, which is sp2 hybridized, whereas the peptide α-carbon is sp3-hybridized. In addition, peptoids lack the N-H group in the main chain, which is often a contributor to hydrogen bond interactions that stabilize either peptide secondary structures or interactions with a partner binding protein. Finally, many of the side chains in the library of peptoids used in this study did not resemble the side chains of the 20 common amino acids (see Supp. Fig. 1). Thus, this approach is quite distinct from previously reported screens of peptide libraries (Robinson et al., 2002b; Wang et al., 2005), which aim to identify a native epitope or at least a close relative. The peptoid molecules cannot possibly mimic a native peptide antigen closely.
As shown schematically in Fig. 1, this type of screening was done using a microarray format that allowed comparison of the binding of antibodies from case and control serum samples to thousands of peptoids. Molecules that retained far more IgG antibody from the case samples were considered candidate capture agents for IgG antibodies highly enriched in the disease state of interest. This protocol was first employed to test if peptoids could be identified that capture antibodies that distinguish between healthy mice and animals with EAE. The same analysis was applied to mice immunized with a peptide derived from Ovalbumin. In each case, three peptoids, called AMogP1-3 and AOvaP1-3, respectively, were identified that captured high levels of IgG antibody from the serum of the immunized animals, but not the control animals. As must have been the case (see above) the peptoids bear no obvious resemblance to the Mog and Ova peptide antigens, respectively (see Supp. Fig. S2), even though it was demonstrated that these molecules indeed bind the antibodies raised against the peptide antigens (Figs. 4 and Supp. Fig. S4). Subsequent validation studies with samples obtained from mice not used in the training set validated these peptoids as excellent capture agents for antibodies unique to the EAE and Ovalbumin peptide-immunized mice, respectively (Figs. 3 and 5).
Of course, the more important question is whether this approach is relevant to the discovery of peptoid-antibody complexes that might be of utility in medical diagnostics. While the mouse work was encouraging and proved the principle of using libraries of unnatural molecules to search for autoantibody ligands, this study employed relatively homogeneous laboratory mice and simple, single antigen immunization models. The greater immunological diversity between different people than between different laboratory mice might complicate the application of this technology to the discovery of biomarkers for human disease. To address this important question, we carried out a preliminary study of serum samples collected from patients with Alzheimer's Disease (AD). It has been reported that AD patients have lower levels of serum anti-amyloid antibodies than healthy individuals (Weksler et al., 2002). While this difference is not sufficient to act as the basis of a diagnostic test, it does suggest the possibility of finding more useful antibody markers of the disease. Peptoid libraries were screened using serum samples from six AD patients (three autopsy-confirmed), six matched control individuals and six Parkinson's Disease (PD) patients. Three peptoids were identified that captured at least three-fold higher levels of IgG antibodies from all six of the AD patients than any of the controls or PD patients (Figs. 6 and 7). The structures of these peptoids are shown in Fig. 6. Depletion of ADP1-binding antibodies from the serum of AD samples demonstrated that ADP1 and ADP3 bind the same IgG antibodies, while ADP2 binds different antibodies (Fig. 7B). Thus, we have discovered at least two candidate autoantibody biomarkers for AD.
Subsequent blinded studies were conducted using samples from more AD patients, controls (see Supplementary Table 1) and patients with a different disease (lupus) to test the utility of the peptoids identified in the original screen. These “validation samples” were not employed in the training set and thus constitute a fair and critical test of the utility of the peptoid-antibody complexes as biomarkers (Ransohoff, 2005). Once unblinded, the data (see Figs. 6 and 7) showed that these peptoid antibody complexes are indeed highly promising biomarkers for the diagnosis of AD (see Supp. Fig. S5 and Supp. Tables S2-6 for the results of a comprehensive statistical analysis).
Two of the control individuals displayed a relatively high level of the AD antibodies (NC31 and 41), similar to that seen in the AD patient with the lowest levels of antibodies (AD15)(see Fig. 6). The individual from whom the NC31 sample was collected is a 75 year-old female with a mini-mental state examination (MMSE) score (McKhann et al., 1984) of 29 out of a possible 30 and without obvious clinical signs of AD (Supplementary Table 1). The NC41 sample was from a 65 year-old female with the same MMSE score. These may represent examples of false positives, for example due to the cross-reaction of non-AD associated antibodies with these peptoids, or could represent pre-symptomatic detection of developing disease. Since these samples contained high levels of antibodies that bind to ADP2 as well as antibodies that bind to ADP1 and ADP3, we favor the latter hypothesis, but this cannot be concluded with certainty.
The development of a simple blood test for AD is an important unrealized goal (Blennow et al., 2010). This preliminary study is promising in that it represents a high level of diagnostic sensitivity and specificity (Saah and Hoover, 1997), at least within the relatively limited range of samples analyzed. However, it is important to point out that more work will be required before it is clear whether the peptoids ADP1-3 will be useful reagents for the clinical diagnosis of AD. First, the analysis of a larger number of patient samples derived from a more diverse population will be required. Second, it will be important to test samples collected from patients with mild cognitive impairment (MCI) that have gone on to develop confirmed AD, since early detection is an important clinical goal. Third, all of the measurements done in this study were conducted on a microarray platform that may not be easily employed in a clinical setting, so optimized conditions for using the peptoids on other analytical platforms will have to be developed. Fourth, if these biomarkers are indeed validated then it will be of great interest to identify the native antigens that they recognize. Studies to address all of these issues are in progress. The experiments in this paper were designed solely to address the issue of whether this technology is applicable to the discovery of biomarker candidates for human disease. We conclude that this is indeed the case.
In summary, we have developed and validated a technology based on parallel screens of synthetic combinatorial libraries for the discovery of IgG biomarkers and simple, synthetic capture agents capable of retaining them from serum. We believe that this technology will have a significant impact on the development of diagnostic tests for a variety of important diseases.
METHODS SUMMARY
General Remarks
All chemicals and solvents were purchased from commercial suppliers and used without further purification. Secondary antibodies were obtained from Molecular Probes (Goat anti-mouse IgG – Alexa 647) and Goat anti-mouse-RPE (Invitrogen). The slides were scanned using GenePix Autoloader 4200AL scanner (Molecular Devices, Sunnyvale CA.) at 10 micron resolution using 635-nm laser at 100% power and 650 photomultiplier tube gain. All the scanned images were analyzed by the Gene Pix Pro 6.0 software (Axon Instruments, Union City, CA).
Peptoid Library Synthesis and Microarray Construction
General protocols for the creation of peptoid libraries and peptoid-displaying microarrays have been published previously (Alluri et al., 2003; Figliozzi et al., 1996; Olivos et al., 2002; Reddy and Kodadek, 2005). A detailed protocol for the creation of the particular libraries and arrays used in this study is provided in the Supplementary Material.
Animal Experiments
C57BL/6 mice were purchased from Jackson Laboratory (Bar Harbor, ME) and bred and maintained in a federally approved animal facility at the University of Texas Southwestern Medical Center (Dallas, TX) in accordance with the regulations of the Institutional Animal Care and Use Committee. All mice were between 7-10 weeks of age when the experiments were initiated.
For actively induced EAE and OVA immunizations, 30 female C57BL/6 mice were injected subcutaneously (s.c.) at four sites over the flanks and shoulders with 200μg MOG 35-55 peptide (MEVGWYRSPFSRVVHLYRNGK) (CS Bio, Menlo Park, CA) or OVA 323-339 peptide (ISQAVHAAHAEINEAGR) (UTSW, Dallas, TX) in an emulsion with complete Freund's adjuvant (CFA) (Difco, Detroit, MI). For control experiments, mice were injected with CFA alone. Pertussis toxin (200 ng/mouse) (List Biological Laboratories) was injected i.p. at the time of immunization and 48 hours later to enhance the upregulation of adhesion molecules and to facilitate blood brain barrier breakdown. Mice were scored on a scale of 0-6: 0, no clinical disease; 1, limp/flaccid tail; 2, moderate hind limb weakness; 3, severe hind limb weakness; 4, complete hind limb paralysis; 5, quadriplegia or premoribund state; 6, death.
Retro-orbital bleeds were performed every 7 days following immunization, starting at day 0 and continuing to day 50 post-immunization on mice in all groups (OVA, MOG, and CFA). Serum was collected by centrifugation and frozen at −20°C until used.
Array analysis of serum samples
Peptoid slides were covered with a hybridization chamber and equilibrated with TBST (50 mM Tris, pH 8.0, 150 mM NaCl, 0.1% Tween20) for 15 minutes. The slides were then blocked with 1 ml of blocking buffer for 1 hour at 4°C. The blocking buffer was removed and the slides were incubated with 1 ml of serum (adjusted to 15 μg/ml of total protein) for 18 hours at 4°C with gentle shaking. Microarrays were then washed three times with TBST and hybridized with Alexa-647-labeled Goat anti-mouse antibody (1:400 dilution) for 2 hours on an orbital shaker at 4°C. The chamber cassettes were removed from the microarray slides and washed with TBST (3 × 15 ml) followed by 0.1XTBST (1 × 10ml). The slides were then dried on a centrifuge (5 min at 1500RPM) and scanned on a microarray scanner (Gene Pix Autoloader 4200 from Telechem International, Inc., CA) by using the 635-nm laser at 100% power and a 650 photomultiplier tube gain. All the scanned images were analyzed using Gene Pix Pro 6.0 (Axon Instruments, Union City, CA) and Genespring software.
The experiments were done in triplicate and each group of three included slides printed in different batches to avoid bias due to batch-to-batch differences in the slides. The Gene Pix Results (GPR's) were generated by using Genepix Pro 6.0 software. Local background subtracted median (F635 Median-B635) spot intensities were used for further analysis. These signal intensities were used for downstream analysis using GeneSpring software (Silicon Genetics, CA). All the GPR's were loaded onto the GeneSpring and only features that gave greater than 40,000 signal intensity in immunized mice and less than 10,000 in control mice were selected and saved to the results folder. These results were transferred to the Excel and peptoids with the highest signal intensity differential and reproducibility in all of the experiments were selected for further testing. The same criteria were used to analyze all the test experiments on a sub-array.
Analysis of human serum samples
The human serum samples were analyzed in exactly the same way as described for the mouse serum samples, except that the serum was diluted to a total protein concentration of 15 μg/ml prior to hybridization to the array. A mouse anti-human secondary antibody was employed to monitor the level of human IgG captured on a spot.
Depletion of Mog peptide-binding antibodies from the serum
All the reagents were allowed to equilibrate to room temperature. The resin from the SulfoLink immobilization kit for peptides (Thermo Scientific Inc., 44999) was suspended by rocking and then the column was placed in a 15 ml tube and centrifuged at 1000 rpm for 1 minute to remove the storage buffer. The column was equilibrated by adding 2 ml of coupling buffer followed by centrifugation. Peptide (1 mg) was dissolved in 2 ml of coupling buffer and added to the column. The top and bottom caps were replaced and the resin was mixed by rotating the column end over end at room temperature for 15 minutes. The column was placed upright and incubated for 30 minutes at room temperature without mixing. The top and bottom caps were removed and the column was placed into a new 15 ml tube and centrifuged at 1000 rpm for 1 minute to collect the non-bound peptide. The column was washed by adding 2 ml of wash solution to the column followed centrifugation. This step was repeated three times for a total of four washes. The column was washed again by adding 2 ml of coupling buffer and the column was then centrifuged. This was repeated once for a total of 2 washes. L-cysteine-HCL (15.8 mg) was dissolved in 2 ml of coupling buffer (50 mM cysteine) and the solution was added to the column. The resin was mixed for 15 minutes at room temperature then incubated for 30 minutes without mixing. The top cap was removed first and then the bottom cap to allow the column to drain. The column was centrifuged at 1000 rpm for 1 minute to remove the non-bound cysteine. The column was washed with 2 ml of 1X TBST and serum sample was added to the column. After the serum sample entered the resin bed the top and bottom caps were replaced and the column was incubated for 60 minutes at room temperature. The top and bottom caps were removed and the column was centrifuged to collect the flow-through serum. Finally, the resin was washed by adding 2 ml of binding/wash buffer.
Supplementary Material
Acknowledgements
We thank Drs. Mike Racke, Amy Lovett-Racke and Ward Wakeland for contributing EAE and SLE samples in the early phase of this project. We thank Kristin Martin-Cook of the UT Southwestern Medical Center's Alzheimer's Disease Center for selecting the normal and AD serum samples for analysis, and Dr. Padraig O'Suilleabhain for diagnosis and collection of the PD serum samples. This work was supported by an NIH Director Pioneer Award to T.K. (DP1OD000663) and the NHLBI Proteomics Initiative of the National Heart, Lung & Blood Institute, National Institutes of Health (contract No. NO1-HV-28185). Human serum sample collection was supported by grant NIH grant AG12300.
Footnotes
Publisher's Disclaimer: This is a PDF file of an unedited manuscript that has been accepted for publication. As a service to our customers we are providing this early version of the manuscript. The manuscript will undergo copyediting, typesetting, and review of the resulting proof before it is published in its final citable form. Please note that during the production process errors may be discovered which could affect the content, and all legal disclaimers that apply to the journal pertain.
Literature Cited
- Alluri PG, Reddy MM, Bacchawat-Sikder K, Olivos HJ, Kodadek T. Isolation of protein ligands from large peptoid libraries. J Amer Chem Soc. 2003;125:13995–14004. doi: 10.1021/ja036417x. [DOI] [PubMed] [Google Scholar]
- Anderson KS, LaBaer J. The sentinel within: Exploiting the immune system for cancer biomarkers. J Proteome Res. 2005;4:1123–1133. doi: 10.1021/pr0500814. [DOI] [PMC free article] [PubMed] [Google Scholar]
- Blennow K, Hampel H, Weiner M, Zetterberg H. Cerebrospinal fluid and plasma biomarkers in Alzheimer disease. Nat Rev Neurol. 2010;6:131–144. doi: 10.1038/nrneurol.2010.4. [DOI] [PubMed] [Google Scholar]
- Fatham CG, Soares L, Chan SM, Utz PJ. An array of possibilities for the study of autoimmunity. Nature. 2005;435:605–611. doi: 10.1038/nature03726. [DOI] [PubMed] [Google Scholar]
- Figliozzi GM, Goldsmith R, Ng SC, Banville SC, Zuckermann RN. Synthesis of N-substituted glycine peptoid libraries. Methods Enzymol. 1996;267:437–447. doi: 10.1016/s0076-6879(96)67027-x. [DOI] [PubMed] [Google Scholar]
- Frulloni L, Lunardi C, Simone R, Dolcino M, Scattolini C, Falconi M, Benini L, Vantini I, Corrocher R, Puccetti A. Identification of a novel antibody associated with autoimmune pancreatitis. The New England journal of medicine. 2009;361:2135–2142. doi: 10.1056/NEJMoa0903068. [DOI] [PubMed] [Google Scholar]
- Gelb DJ, Oliver E, Gilman S. Diagnostic criteria for Parkinson disease. Archives of neurology. 1999;56:33–39. doi: 10.1001/archneur.56.1.33. [DOI] [PubMed] [Google Scholar]
- Gibson DS, Banha J, Penque D, Costa L, Conrads TP, Cahill DJ, O'Brien JK, Rooney ME. Diagnostic and prognostic biomarker discovery strategies for autoimmune disorders. J Proteomics. 2010;73:1045–1060. doi: 10.1016/j.jprot.2009.11.013. [DOI] [PubMed] [Google Scholar]
- Hampel H, Frank R, Broich K, Teipel SJ, Katz RG, Hardy J, Herholz K, Bokde AL, Jessen F, Hoessler YC, et al. Biomarkers for Alzheimer's disease: academic, industry and regulatory perspectives. Nat Rev Drug Discov. 2010;9:560–574. doi: 10.1038/nrd3115. [DOI] [PubMed] [Google Scholar]
- Hauser SL. Multiple lessons for multiple sclerosis. N Eng J Med. 2008;359:1838–1841. doi: 10.1056/NEJMe0806738. [DOI] [PubMed] [Google Scholar]
- Hudson ME, Pozdnyakova I, Haines K, Mor G, Snyder M. Identification of differentially expressed proteins in ovarian cancer using high-density protein microarrays. Proc Natl Acad Sci U S A. 2007;104:17494–17499. doi: 10.1073/pnas.0708572104. [DOI] [PMC free article] [PubMed] [Google Scholar]
- Kanter JL, Narayana S, Ho PP, Catz I, Warren KG, Sobel RA, Steinman L, Robinson WH. Lipid microarrays identify key mediators of autoimmune brain inflammation. Nature medicine. 2006;12:138–143. doi: 10.1038/nm1344. [DOI] [PubMed] [Google Scholar]
- Knittelfelder R, Riemer AB, Jensen-Jarolim E. Mimotope vaccination--from allergy to cancer. Expert Opin Biol Ther. 2009;9:493–506. doi: 10.1517/14712590902870386. [DOI] [PMC free article] [PubMed] [Google Scholar]
- Liu K, Wakeland EK. Delineation of the pathogenesis of systemic lupus erythematosus by using murine models. Adv Exp Med Biol. 2001;490:1–6. doi: 10.1007/978-1-4615-1243-1_1. [DOI] [PubMed] [Google Scholar]
- Lueking A, Possling A, Huber O, Beveridge A, Horn M, Eickoff H, Schuchardt J, Lehrach H, Cahill DJ. A non-redundant human protein chip for antibody screening and serum profiling. Mol Cell Proteomics. 2003;2:1342–1349. doi: 10.1074/mcp.T300001-MCP200. [DOI] [PubMed] [Google Scholar]
- McFarland HF, Martin R. Multiple sclerosis: a complicated picture of autoimmunity. Nat Immunol. 2007;8:913–919. doi: 10.1038/ni1507. [DOI] [PubMed] [Google Scholar]
- McKhann G, Drachman D, Folstein M, Katzman R, Price D, Stadlan EM. Clinical diagnosis of Alzheimer's disease: report of the NINCDS-ADRDA Work Group under the auspices of Department of Health and Human Services Task Force on Alzheimer's Disease. Neurology. 1984;34:939–944. doi: 10.1212/wnl.34.7.939. [DOI] [PubMed] [Google Scholar]
- Olivos HJ, P.G. A, Reddy MM, Saloney D, Kodadek T. Microwave-assisted solid phase synthesis of peptoids. Org Lett. 2002;4:4057–4059. doi: 10.1021/ol0267578. [DOI] [PubMed] [Google Scholar]
- Ransohoff DF. Lessons from controversy: Ovarian cancer screening and serum proteomics. J of the NCI. 2005;97:315–319. doi: 10.1093/jnci/dji054. [DOI] [PubMed] [Google Scholar]
- Reddy MM, Kodadek T. Protein “fingerprinting” in complex mixtures with peptoid microarrays. Proc Natl Acad Sci U S A. 2005;102:12672–12677. doi: 10.1073/pnas.0501208102. [DOI] [PMC free article] [PubMed] [Google Scholar]
- Robinson WH, DiGennaro C, Hueber W, Haab B, Kamachi M, Dean E, Fournel S, Fong D, Genovese MC, de Vegvar H, et al. Antigen arrays for multiplex characterization of autoantibody responses. Nature Med. 2002a;8:295–301. doi: 10.1038/nm0302-295. [DOI] [PubMed] [Google Scholar]
- Robinson WH, Steinman L, Utz PJ. Protein and peptide array analysis of autoimmune disease. Biotechniques. 2002b Dec.(Suppl.):66–69. [PubMed] [Google Scholar]
- Saah AJ, Hoover DR. “Sensitivity” and “specificity” reconsidered: the meaning of these terms in analytical and diagnostic settings. Ann Intern Med. 1997;126:91–94. doi: 10.7326/0003-4819-126-1-199701010-00026. [DOI] [PubMed] [Google Scholar]
- Simon RJ, Kania RS, Zuckermann RN, Huebner VD, Jewell DA, Banville S, Ng S, Wang L, Rosenberg S, Marlowe CK, et al. Peptoids: a modular approach to drug discovery. Proc Natl Acad Sci U S A. 1992;89:9367–9371. doi: 10.1073/pnas.89.20.9367. [DOI] [PMC free article] [PubMed] [Google Scholar]
- Steller S, Angenendt P, Cahill DJ, Heuberger S, Lehrach H, Kreutzberger J. Bacterial protein microarrays for identification of new potential diagnostic markers for Neisseria meningitidis infections. Proteomics. 2005;5:2048–2055. doi: 10.1002/pmic.200401097. [DOI] [PubMed] [Google Scholar]
- Thambisetty M, Simmons A, Velayudhan L, Hye A, Campbell J, Zhang Y, Wahlund LO, Westman E, Kinsey A, Guntert A, et al. Association of plasma clusterin concentration with severity, pathology, and progression in Alzheimer disease. Arch Gen Psychiatry. 2010;67:739–748. doi: 10.1001/archgenpsychiatry.2010.78. [DOI] [PMC free article] [PubMed] [Google Scholar]
- Wang X, Yu J-Q, Sreekumar A, Varambally S, Shen R, Giachero D, Mehra R, Montie JE, Pienta KJ, Sanda MG, et al. Autoantibody signatures in prostate cancer. New England J Med. 2005;355:16–27. doi: 10.1056/NEJMoa051931. [DOI] [PubMed] [Google Scholar]
- Weksler ME, Relkin N, Turkenich R, LaRusse S, Zhou L, Szabo P. Patients with Alzheimer disease have lower levels of serum anti-amyloid peptide antibodies than healthy elderly individuals. Exp Gerontol. 2002;37:943–948. doi: 10.1016/s0531-5565(02)00029-3. [DOI] [PubMed] [Google Scholar]
Associated Data
This section collects any data citations, data availability statements, or supplementary materials included in this article.