

Abstract
Sulfur mustard (HD, SM), is a chemical warfare agent that within hours causes extensive blistering at the dermal–epidermal junction of skin. To better understand the progression of SM-induced blistering, gene expression profiling for mouse skin was performed after a single high dose of SM exposure. Punch biopsies of mouse ears were collected at both early and late time periods following SM exposure (previous studies only considered early time periods). The biopsies were examined for pathological disturbances and the samples further assayed for gene expression profiling using the Affymetrix microarray analysis system. Principal component analysis and hierarchical cluster analysis of the differently expressed genes, performed with ArrayTrack showed clear separation of the various groups. Pathway analysis employing the KEGG library and Ingenuity Pathway Analysis (IPA) indicated that cytokine–cytokine receptor interaction, cell adhesion molecules (CAMs), and hematopoietic cell lineage are common pathways affected at different time points. Gene ontology analysis identified the most significantly altered biological processes as the immune response, inflammatory response, and chemotaxis; these findings are consistent with other reported results for shorter time periods. Selected genes were chosen for RT-PCR verification and showed correlations in the general trends for the microarrays. Interleukin 1 beta was checked for biological analysis to confirm the presence of protein correlated to the corresponding microarray data. The impact of a matrix metalloproteinase inhibitor, MMP-2/MMP-9 inhibitor I, against SM exposure was assessed. These results can help in understanding the molecular mechanism of SM-induced blistering, as well as to test the efficacy of different inhibitors.
Keywords: Vesicant, Sulfur mustard, Microarray, Alkylating agent, Skin, MMP inhibitor, MMP, Matrix metalloproteinase
Introduction
Sulfur mustard [bis(2-chloroethyl)sulfide] (sulfur mustard, SM, HD) is a potent alkylating agent which penetrates the skin rapidly causing skin blistering within hours (Fig. 1A). The fluid filled blisters occur at the level of the dermal–epidermal junction (DEJ) which is also the identical pathological target for Junctional Epidermolysis Bullosa (JEB) (Monteiro-Riviere et al., 1999) JEB is a genetic skin blistering disease where the epidermis separates away from the dermis and compromises the skin integrity. Disruption of the dermal–epidermal junction in JEB appears to be further magnified through the actions of matrix metalloproteinases (MMPs), a family of proteases that both enhances the action of many activating factors during the inflammatory response, and contributes to tissue degradation (Yancey, 2005). Currently, there is no established pharmacological countermeasure against SM-induced skin injury. Because the precise mechanisms responsible for SM-induced skin injury are unknown, treatment strategies and pharmacological countermeasures continue to be developed. Our previous work identified matrix metalloproteinase-9 (MMP-9) as a potential target of therapy for SM damage in that it quantitatively increases over time in response to sulfur mustard exposure (Shakarjian et al., 2006). Since this increase in MMP-9 correlates to increased tissue damage, it is hypothesized that a quantitative reduction of MMP-9 in skin would reduce the tissue damage normally observed after SM exposure. Studies have shown some success in the use of protease inhibitors both in vitro in cell culture (Cowan et al., 2000) and in an in vivo mouse model (Powers et al., 2000). It was tested whether or not topical skin treatment with MMP-2/MMP-9 inhibitor I [(2R)-2-[(4-Biphenylylsulfonyl)amino]-3-phenylpropionic acid (Fig. 1B), was effective in reducing the secondary damage caused by MMP-9. Using microarray analysis, the major gene pathways that are activated in response to SM skin exposure were identified. The rationale for using microarray technology was that it may identify potential new target molecules or pathways that could be used for medical intervention against SM-induced injury. It also has the potential to identify biomarkers that could be used as quantitative tools for novel compound evaluation.
Fig. 1.
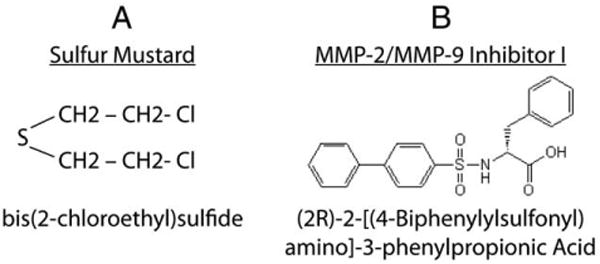
Chemical structures of Sulfur Mustard and the MMP inhibitor.
To date, there have only been a handful of microarray studies involving analysis of mouse skin treated with sulfur mustard (Rogers et al., 2004; Sabourin et al., 2004; Dillman et al., 2006). These studies only focused on gene changes at early time points within the first 24 h post exposure. The present study expanded the observed time-course to seven days in length. It also analyzed the impact of a specific MMP inhibitor to the SM-induced skin damage by assessing ear tissues from mice exposed to SM for histological damage (with and without topical pre-treatment with MMP-2/MMP-9 inhibitor I). Since microarray analysis data vary according to the method employed, analysis was performed using several different techniques in order to compare the gene variations with and without MMP-2/MMP-9 inhibitor I application and generate statistically significant data. A majority of the techniques employed in this study to analyze gene expression microarray data are supported by the USFDA's ArrayTrack system (Tong et al., 2003; 2004). In the present study, the multiple analysis methods supported by Array-Track were used, both within ArrayTrack and through links to other analysis platforms.
Methods
Experimental design
A schematic depiction of the experiments and subsequent analysis is shown in Fig. 2. The mice were divided into three groups (each group is represented by three post-exposure time-points). The three groups included: 1) untreated, control group; 2) mice treated with sulfur mustard; 3) mice treated with sulfur mustard after pre-treatment with the inhibitor. The microarray gene expression data were then analyzed to identify the genes that have been significantly expressed using several different statistical and pathway analysis techniques. Details of the experiments and the analysis methods follow.
Fig. 2.
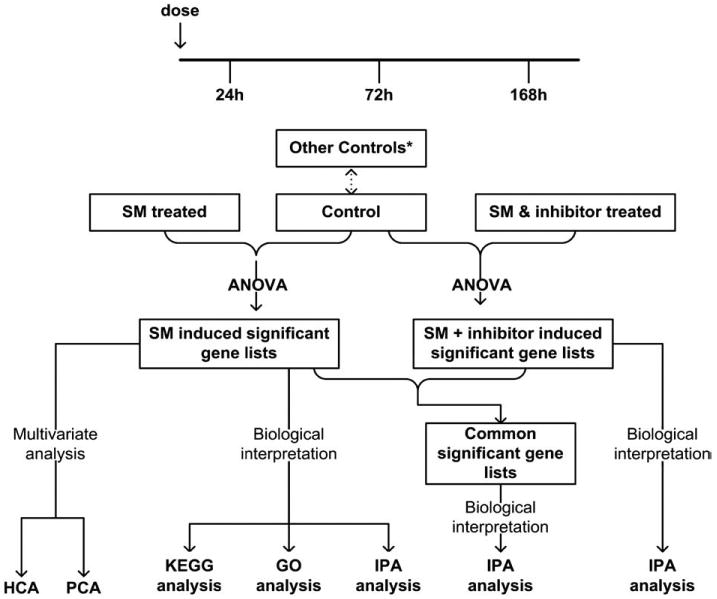
Schematic depiction of the microarray experimental design and subsequent analyses. *Other controls are described in Methods section (a comparison of all the various control groups showed no significant differences between the groups).
SM exposure
Animals were exposed to SM as reported in Shakarjian et al. (2006). Briefly, for the mouse ear exposures, male CD1 mice [Charles River Laboratories, Portage, MI; N=20 per treatment) anesthetized with ketamine and xylazine were exposed to 5 μl of 97.5 mM SM (0.08 mg) in CH2Cl2 (methylene chloride) through application to the inner medial surface of the right ear]. The left ear served as a control and received only the vehicle CH2Cl2. There were additional controls in the study that included untreated ear punches, ethanol alone (the carrier for the MMP 2/MMP 9 inhibitor I), inhibitor in ethanol, and inhibitor in ethanol followed by CH2Cl2 alone. A statistician analyzed all the study control results and concluded there was no significant difference in the microarray results for any of the controls (data not shown). At 24, 72, and 168 h post-exposure, animals were euthanized and dermal punch specimens (8 mm in diameter) were taken from the center of both the SM-exposed and control ears. The punch biopsies were collected for an early time period (24 h post-exposure) and late time periods (72 h and 168 h post-exposure).The ear punches were either snap-frozen in liquid nitrogen and stored at −70 °C for microarray analysis or fixed in neutral-buffered formalin for 24 h at room temperature for histopathology analysis.
Microarray experiments
Between 5 and 20 ng of total RNA prepared from each tissue biopsy was used to generate a high fidelity cDNA for array hybridization The cDNA were analyzed by electrophoresis using the Agilent Bioanalyzer 2100 to assess the appropriate size distribution prior to microarray hybridization. 2.5 μg of amplified labeled cDNA was used in the hybridization cocktail for GeneChip analysis. Three technical replicates and three biological replicates were used in this study. All samples were subjected to gene expression analysis via the Affymetrix mouse 430_2.0 Plus high-density oligonucleotide array, which currently queries 46,000 mouse probe sets. Hybridization, staining and washing of all arrays were performed in the Affymetrix fluidics module as per the manufacturer's protocol. The detection and quantitation of target hybridization was performed with a GeneArray Scanner 3000 set to scan each array twice at a factory set PMT level and resolution. All arrays referred to in this study were assessed for “array performance” prior to data analysis via statistical analysis of control transcripts that were spiked into the samples themselves and the hybridization cocktail.
Data analysis methods
The USFDA's ArrayTrack system (Tong et al., 2003; 2004) has been used with different analysis approaches for studying the microarray data from the experiments. ArrayTrack is an open platform and contains three integrated components: (a) MicroarrayDB, which stores essential data associated with a microarray experiment, including information on slide samples, treatment, and experimental results; (b) TOOL, which provides analysis capabilities for data visualization, normalization, significance analysis, clustering, and classification; and (c) LIB, which contains information from public and proprietary repositories (e.g., for gene annotation, protein function, and pathways). ArrayTrack is being enhanced to result in a new system, termed ebTrack, through additional analysis modules for gene expression data as well as through incorporation or linkages to modules for analysis of proteomic and metabonomic datasets that include tandem mass spectra. Furthermore, interfaces to environmental health risk analysis tools, as well as an open source database backend are planned in order to make it even more widely usable.
Gene expression data were first normalized using the Microarray Suite, version 5.0 (MAS5; Affymetrix), with an auto-scale intensity of 500. The normalized data were converted into log2 intensity and only those genes which were expressed with mean channel intensities greater than 100 were selected for further analysis. This represents about 24,681 genes out of a total of about 45,000. Principal Component Analysis (PCA) and Hierarchical Cluster Analysis (HCA) were then applied on the selected data using the centered method within ArrayTrack. Subsequently, significant genes were selected using cutoffs of p<0.05 and fold change >1.5 (and retaining the constraint that the mean intensity is greater than 100). The identification of differentially expressed genes was based on Welch t-test.
The initial genomic analysis used the methodology of the Gene Ontology (GO) Consortium. This initial analysis provided some biological information and was followed by a KEGG pathway analysis (Kanehisa et al., 2004). Subsequently, Ingenuity Pathway Analysis (IPA) (Ingenuity Systems, 2008) was performed to gather even more information on individual gene changes and an attempt was made to link them to biological functions in the model system. Significantly expressed genes at 24 h, 72 h, and 168 h post-dosing were uploaded into IPA. When one gene corresponded to several spots in arrays, the average intensity was used as its gene expression response. LocusID of each gene was mapped to its corresponding gene object in the IPA Knowledge Base. These genes were then used as the starting point for calculating biological functions, and assigning them to different pathways and networks.
Real-time polymerase chain reaction
RT-PCR was performed as previously described (Shakarjian et al., 2006).
Cytokine enzyme quantitation
The interleukin 1 beta enzyme was quantitated using the Millipore Mouse Cytokine Lincoplex system.
Results
The gene expression data were analyzed through different analysis techniques, including PCA, HCA, Gene GO analysis, KEGG pathway analysis, and IPA analysis. All the methods were consistent and showed that over 1000 genes were significantly expressed in mouse skin after sulfur mustard exposure. Fig. 3 depicts the hierarchical cluster analysis based on 24,681 genes with mean channel intensities in the arrays greater than 100. The control group separates from the SM-treated group, and demonstrates an increasing distance with the time after dosing. This observation indicates that an increasing number of genes are activated after SM-induced cutaneous injury. Fig. 4 shows the results from the principle component analysis based on the 24,681 genes whose mean channel intensities were greater than 100 in the arrays across different time-points after treatment. The control group clearly separated from the treated group, and a monotonous time-course trajectory of 24 h, 72 h, and 168 h was observed. This observation highlights the importance of conducting longer-term time-course studies. In the case of both the PCA and HCA analyses, a larger subject of the gene list was used (the only constraint was imposed on the channel intensity).
Fig. 3.
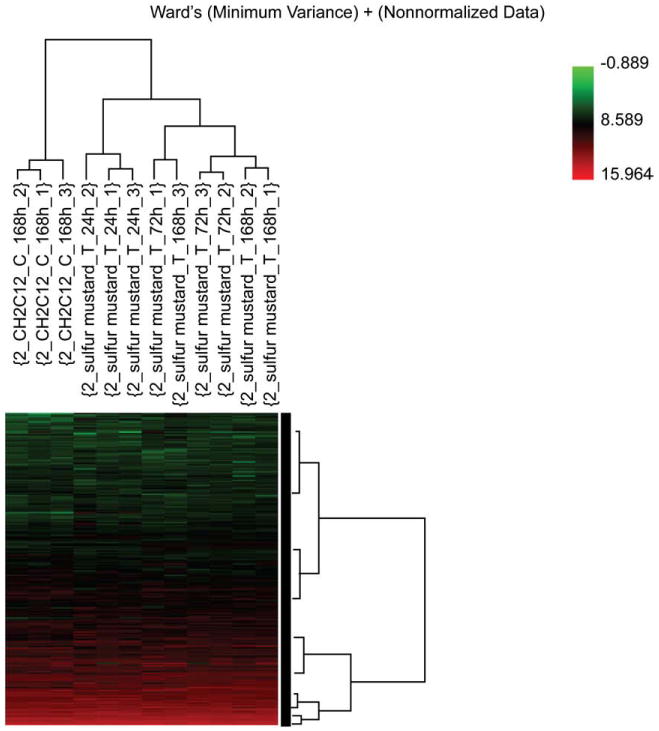
Hierarchical cluster analysis (HCA) based on 24,681 genes whose mean channel intensities were greater than 100 in the arrays. The control group separates from the SM-treated group, with an increasing distance with the time after dosing. This indicates an increasing number of genes are activated following SM-induced cutaneous injury.
Fig. 4.
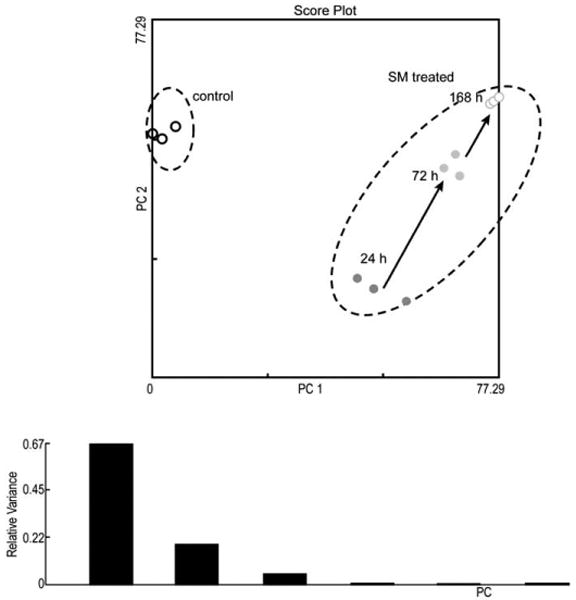
Principle component analysis based on the 24,681 genes with mean channel intensities greater than 100 as measured across different time points after treatment. The control group clearly separates from the treated group, and a monotonous time-course trajectory of 24 h, 72 h, and 168 h was observed.
When a KEGG analysis was performed for different sulfur mustard post-exposure time-points, using statistically significant Fisher P values, novel pathway activations were identified in the sulfur mustard exposure time-points when compared to controls (Table 1). The analysis showed that cytokine–cytokine receptor interaction and the Jak-STAT signaling pathways are impacted at all the post-exposure time points. If a comparative analysis was performed in a slightly different way, using the IPA system, it would be possible to identify the top biological functions affected by sulfur mustard exposure. The data is presented in Table 2 and identifies cell death, cancer, inflammatory disease, immunological disease, and cell movement as the top biological functions affected by sulfur mustard exposure. Note that the total number of genes affected is shown in parentheses. Table 3 shows the 46 genes involved in inflammatory response induced by sulfur mustard at different time points post-exposure. Other pathways examined include: p53 signaling (Table 4: 17 genes), NF-kB signaling (Table 5: 25 genes), oxidative stress (Table 6: 17 genes), p38 MAPK (Table 7: 20 genes), pro-apoptosis (Table 8: 9 genes), and apoptosis (Table 9: 15 genes). Since the data carried the MEVM model out to a longer time period than previously reported, it was decided to measure the effects of MMP inhibitor I on SM-exposed skin. A list of significantly affected genes was generated utilizing the following additional constraints: cutoffs of p<0.05 and fold change >1.5). These data correspond to the green colored “common significant gene lists” in Fig. 2. A Venn diagram of the KEGG pathways meeting these criteria is presented in Fig. 5. At least 2 pathways were common for all the three time points post-exposure. One specific KEGG pathway, that of cytokine–cytokine receptor interaction pathway is presented in Fig. 6 based on a total of 240 in the ArrayTrack database. It shows the significantly expressed genes in cytokine–cytokine receptor interaction pathway which are disturbed by sulfur mustard exposure at different time points post-exposure: 51 genes at 24 h, 60 genes at 72 h, and 72 genes at 168 h, and a total of 34 common genes. Since genes that are differentially expressed can provide insight into planning further extended time studies, we performed a Gene Ontology analysis focusing on the biological processes whose gene expression was significantly altered by sulfur mustard at 24 h, 72 h, and 168 h respectively (Fig. 7). The Y-axis represents the Fisher P value for each biological process shown in the X-axis. There were at least four biological processes that were disturbed in all three time-points post-exposure. These were: immune response, chemotaxis, inflammatory response, and cell adhesion. Additional processes were disturbed with increasing post-exposure time. HCA and PCA showed no significant difference between the SM-treated and SM+inhibitor-treated cases, which was consistent with the histological information (data not shown). However, as shown in Fig. 8, the analysis of major biological pathways that were involved in sulfur mustard induced cutaneous injury showed a slightly different trend, with fewer pathways being significantly impacted with increasing time. Selected genes from the microarray data were chosen for quantitation of the mRNA. The data is presented in Fig. 9 and demonstrated that the general trends for the microarray data are consistent with the QPCR. Interleukin 1 beta was selected for protein quantitation and the data is presented in Fig. 10. The overall trends were consistent between the microarray, mRNA, and actual protein.
Table 1. Pathways obtained from KEGG analysis at 24 h, 72 h and 168 h.
| Pathway name | Fisher P value |
|---|---|
| 24 h | |
| Cytokine–cytokine receptor interaction | 0.00002 |
| Inositol phosphate metabolism | 0.00064 |
| Phosphatidylinositol signaling system | 0.00651 |
| Synthesis and degradation of ketone bodies | 0.03842 |
| Jak-STAT signaling pathway | 0.03924 |
| Hematopoietic cell lineage | 0.04550 |
| 72 h | |
| Cytokine–cytokine receptor interaction | 0.00000 |
| Hedgehog signaling pathway | 0.00190 |
| Cell communication | 0.00822 |
| Jak-STAT signaling pathway | 0.02221 |
| 168 h | |
| Cytokine–cytokine receptor interaction | 0.00001 |
| Cell adhesion molecules (CAMs) | 0.00017 |
| Hematopoietic cell lineage | 0.00500 |
| Neuroactive ligand–receptor interaction | 0.00776 |
| Glycosphingolipid biosynthesis — neo-lactoseries | 0.02207 |
| Jak-STAT signaling pathway | 0.04376 |
| Complement and coagulation cascades | 0.04682 |
Here Fisher P value indicates the pathway's significance compared with chance sampling alone. Cytokine–cytokine receptor interaction, cell adhesion molecules (CAMs), hematopoietic cell lineage are common pathways at different time points.
Table 2. The top biological functions generated by IPA for the significant genes list of 24 h, 72 h, and 168.
| Biological function | −log (p-value)/genes | ||
|---|---|---|---|
| 24 h | 72 h | 168 h | |
| Cell death | 17.5 (511) | 17.3 (528) | 17.3 (580) |
| Cancer | 12.6 (566) | 17.2 (623) | 14.2 (687) |
| Inflammatory disease | 11.5 (226) | 17.8 (271) | 18.4 (295) |
| Immunological disease | 10.3 (228) | 17.1 (260) | 18.5 (287) |
| Cell movement | 9.5 (311) | 12.5 (323) | 22.6 (401) |
P-value represents the statistical significance of the specific biological function, and −log(p-value) increases with the statistical significance (−log(p-value)=1.30 when p-value=0.05). The number under the dash represents that the number of genes in a gene list was involved in a biological function. Results in this table shows that inflammation plays an important role in the etiology of SM-induced cutaneous injury. The total number of genes affected are in parentheses.
Table 3. Genes involved in inflammatory response induced by sulfur mustard at 24, 72 and 168 h post-exposure.
| Gene name | Gene description | Fold change (SM) | ||
|---|---|---|---|---|
| 24 h | 72 h | 168 h | ||
| Bax | BCL2-associated X protein | 3.38† | 2.56† | 2.23† |
| Bid | BH3 interacting domain death agonist | 1.97† | 2.54* | 2.08* |
| Bsg | Basigin (Ok blood group) | 2.00* | 1.56 | 1.05 |
| C5ar1 | Complement component 5a receptor 1 | 2.62* | 3.53* | 6.09* |
| Ccl2 | Chemokine (C–C motif) ligand 2 | 10.71* | 9.35† | 4.17* |
| Ccl6 | Chemokine (C–C motif) ligand 6 | 4.09† | 5.19† | 4.50* |
| Ccr1 | Chemokine (C–C motif) receptor 1 | 12.20† | 15.04† | 20.58† |
| Ccr2 | Chemokine (C–C motif) receptor 2 | 2.36* | 3.31† | 3.07† |
| Ccr5 | Chemokine (C–C motif) receptor 5 | 6.93† | 8.57† | 10.33† |
| Cd14 | CD14 molecule | 5.97† | 9.34† | 13.86† |
| Cd44 | CD44 molecule (Indian blood group) | 2.23† | 2.27† | 2.10† |
| Cd47 | CD47 molecule | 1.10 | 1.21 | 1.78* |
| Cebpd | CCAAT/enhancer binding protein (C/EBP), delta | 1.62* | 2.25† | 1.97* |
| Cfb | Complement factor B | 1.70* | 2.39† | 2.31* |
| Cxcl2 | Chemokine (C–X–C motif) ligand 2 | 270.81† | 286.62† | 497.50† |
| Dmd | Dystrophin (muscular dystrophy, Duchenne and Becker types) | −2.07† | −1.26* | 1.89 |
| Dsg3 | Desmoglein 3 (pemphigus vulgaris antigen) | 2.61* | 2.46* | 1.62 |
| Egr1 | Early growth response 1 | 2.39† | 1.52 | 1.28 |
| F3 | Coagulation factor III (thromboplastin, tissue factor) | −1.89† | −1.75* | −1.96† |
| Fas | Fas (TNF receptor superfamily, member 6) | 2.88† | 2.10* | 1.89† |
| Fcgr2b | Fc fragment of IgG, low affinity IIb, receptor (CD32) | 4.10† | 5.19† | 8.15† |
| Hexb | Hexosaminidase B (beta polypeptide) | −1.55* | −1.09 | −1.15 |
| Icam1 | Intercellular adhesion molecule 1 (CD54), human rhinovirus receptor | 3.86† | 2.78† | 3.81† |
| Il18 | Interleukin 18 | −2.56* | −1.08 | −1.15 |
| Il1b | Interleukin 1, beta | 35.29* | 34.18† | 51.94† |
| Il1rl1 | Interleukin 1 receptor-like 1 | 3.79* | 8.37* | 18.77* |
| Il1rn | Interleukin 1 receptor antagonist | 1.84* | 1.18 | 1.72 |
| Il6 | Interleukin 6 | 26.54† | 12.51† | 16.61† |
| Insr | Insulin receptor | 1.51 | 1.76 | 2.84* |
| Itgb1 | Integrin, beta 1 | 2.78* | 2.30 | 5.60 |
| Itgb2 | Integrin, beta 2 | 2.42* | 3.56† | 3.12† |
| Lbp | Lipopolysaccharide binding protein | 1.97* | 1.58* | 1.26 |
| Lgals1 | Lectin, galactoside-binding, soluble, 1 | 1.50† | 2.31† | 1.73† |
| Map2k1 | mitogen-activated protein kinase kinase 1 | 1.69* | 2.27* | 2.02† |
| Map3k7 | Mitogen-activated protein kinase kinase kinase 7 | 1.66† | 1.38† | 1.74* |
| Mif | Macrophage migration inhibitory factor | 1.36* | 1.19 | 1.82 |
| Mmp9 | Matrix metallopeptidase 9 (gelatinase B, 92 kDa gelatinase, 92 kDa type IV collagenase) | 2.40* | 3.93* | 8.26† |
| Myd88 | Myeloid differentiation primary response gene (88) | 1.56* | 1.46 | 1.17 |
| Nfe2l2 | Nuclear factor (erythroid-derived 2)-like 2 | 1.33* | 1.36* | 1.35* |
| Nfkbia | Nuclear factor of kappa light polypeptide gene enhancer in B-cells inhibitor, alpha | 1.66* | 1.43 | 1.62* |
| Osm | Oncostatin M | 4.47* | 5.00* | 8.46† |
| Ptgs2 | Prostaglandin-endoperoxide synthase 2 | 23.88† | 27.62† | 34.35† |
p<0.05.
p<0.01.
Table 4. Genes involved in p53 signaling pathway induced by sulfur mustard at 24, 72 and 168 h post-exposure.
| Gene name | Gene description | Fold change (SM) | ||
|---|---|---|---|---|
| 24 h | 72 h | 168 h | ||
| Akt2 | v-akt murine thymoma viral oncogene homolog 2 | 1.78† | 1.46* | 1.41† |
| Bax | BCL2-associated X protein | 3.38† | 2.56† | 2.23† |
| Ccnd1 | Cyclin D1 | 1.87† | 1.67* | 1.67† |
| Ccng1 | Cyclin G1 | 5.89† | 3.30* | 2.73* |
| Chek2 | CHK2 checkpoint homolog (S. pombe) | −1.04 | 2.10† | 1.79* |
| E2f1 | E2F transcription factor 1 | 1.49 | 1.54 | 1.79* |
| Mdm2 | Mdm2, transformed 3 T3 cell double minute 2, p53 binding protein | 3.41† | 1.87† | 1.69* |
| Pik3c2g | Phosphoinositide-3-kinase, class 2, gamma polypeptide | −2.56† | −2.13* | −2.44† |
| Pik3cd | Phosphoinositide-3-kinase, catalytic, delta polypeptide | 1.13 | 1.79 | 2.35* |
| Pik3cg | Phosphoinositide-3-kinase, catalytic, gamma polypeptide | 1.29† | 2.35* | 3.12† |
| Pik3r5 | Phosphoinositide-3-kinase, regulatory subunit 5, p101 | 2.01* | 3.36* | 4.14† |
| Pmaip1 | Phorbol-12-myristate-13-acetate-induced protein 1 | 6.84† | 3.93* | 3.28* |
| Serpinb5 | Serpin peptidase inhibitor, clade B (ovalbumin), member 5 | −1.25 | −1.39* | −2.06* |
| Serpine2 | Serpin peptidase inhibitor, clade E (nexin, plasminogen activator inhibitor type 1), member 2 | 1.95* | 2.35* | 3.99* |
| Trp53bp2 | Tumor protein p53 binding protein2 | −1.34* | −1.61* | −1.50 |
| Trp53inp1 | Tumor protein p53 inducible nuclear protein 1 | 2.75† | 1.45† | 1.36 |
p<0.05.
p<0.01.
Table 5. Genes involved in NF-kB signaling pathway induced by sulfur mustard at 24, 72 and 168 h post-exposure.
| Gene name | Gene description | Fold change (SM) | ||
|---|---|---|---|---|
| 24 h | 72 h | 168 h | ||
| Akt2 | v-akt murine thymoma viral oncogene homolog 2 | 1.78† | 1.46* | 1.41† |
| Ep300 | E1A binding protein p300 | −1.72* | −2.13* | −2.13* |
| Ghr | Growth hormone receptor | −1.66* | −1.52* | −1.18 |
| Ikbkg | v-Ha-ras Harvey rat sarcoma viral oncogene homolog | 1.59* | 1.80† | 1.48* |
| Il1b | Interleukin 1, beta | 35.29† | 34.18† | 51.94† |
| Il1rn | Interleukin 1 receptor antagonist | 1.84† | 1.18 | 1.72† |
| Irak3 | Interleukin-1 receptor-associated kinase 3 | 2.78* | 1.98 | 1.77* |
| Map3k7 | Mitogen-activated protein kinase 8 | 1.66† | 1.3† | 1.74* |
| Nfkbia | Nuclear factor of kappa light polypeptide gene enhancer in B-cells inhibitor, alpha | 1.66* | 1.43 | 1.62* |
| Nfkbie | Nuclear factor of kappa light polypeptide gene enhancer in B-cells inhibitor, epsilon | 1.66 | 1.99 | 3.97* |
| Ngfb | Nerve growth factor, beta polypeptide | 13.52† | 11.37† | 6.15* |
| Pik3c2g | Phosphoinositide-3-kinase, class 2, gamma polypeptide | −2.56† | −2.13* | −2.44† |
| Pik3cd | Phosphoinositide-3-kinase, catalytic, delta polypeptide | 1.13 | 1.79 | 2.35* |
| Pik3cg | Phosphoinositide-3-kinase, catalytic, gamma polypeptide | 1.29* | 2.35* | 3.12† |
| Pik3r1 | Phosphoinositide-3-kinase, regulatory subunit 1 (p85 alpha) | 1.03 | −1.28* | −1.39* |
| Pik3r5 | Phosphoinositide-3-kinase, regulatory subunit 5, p101 | 2.01* | 3.36* | 4.14† |
| Rras2 | Related RAS viral (r-ras) oncogene homolog 2 | 1.94* | 1.98* | 1.79† |
| Tgfa | Transforming growth factor, alpha | 1.57 | 2.36† | 2.24* |
| Tirap | Toll-interleukin 1 receptor (TIR) domain containing adaptor protein | 1.73* | 1.60* | 1.54* |
| Tlr1 | Toll-like receptor 1 | 3.13† | 6.83† | 5.76† |
| Tlr2 | Toll-like receptor 2 | 2.25 | 3.34* | 3.75* |
| Tlr3 | Toll-like receptor 3 | 1.05 | 1.56† | 2.22† |
| Tlr4 | Toll-like receptor 4 | 1.64 | 1.85† | 1.93* |
| Tnfaip3 | Tumor necrosis factor, alpha-induced protein 3 | 3.12† | 1.23 | 2.95† |
| Traf3 | TNF receptor-associated factor 3 | 1.65* | 1.72 | 2.18* |
p<0.05.
p<0.01.
Table 6. Genes involved in oxidative stress pathway induced by sulfur mustard at 24, 72 and 168 h post-exposure.
| Gene name | Gene description | Fold change (SM) | ||
|---|---|---|---|---|
| 24 h | 72 h | 168 h | ||
| Fos | v-fos FBJ murine osteosarcoma viral oncogene homolog | 4.56* | 2.70† | 2.49* |
| Gpx1 | Glutathione peroxidase 1 | 1.36 | 1.69 | 1.69* |
| Gss | Glutathione synthetase | 1.48* | 1.51* | 1.40* |
| Gsta2 | Glutathione S-transferase A5 | −2.70 | −1.92 | −3.70* |
| Gstm2 | Glutathione S-transferase M1 | −1.52 | −1.15 | −1.59* |
| Gstm1 | Glutathione S-transferase M5 | −1.60 | −1.77† | −2.00* |
| Gstm5 | Glutathione S-transferase M3 (brain) | −1.33 | −1.12 | −1.82† |
| Icam1 | Intercellular adhesion molecule 1 (CD54), human rhinovirus receptor | 3.86† | 2.78† | 3.81† |
| Il6 | Interleukin 6(interferon, beta 2) | 26.54† | 12.51† | 16.61† |
| Mgst1 | Microsomal glutathione S-transferase 1 | 1.24 | 1.36* | 2.83* |
| Mpo | Myeloperoxidase | −1.18 | −2.63* | −9.09* |
| Nfe2l2 | Nuclear factor (erythroid-derived 2)-like 2 | 1.33† | 1.36† | 1.35† |
| Prdx3 | Peroxiredoxin 3 | 1.47 | 1.66† | 1.60† |
| S100a9 | S100 calcium binding protein A9 | 60.60† | 71.55† | 52.98† |
| Sod2 | Superoxide dismutase 2, mitochondrial | 1.46† | 1.15 | 1.43* |
| Stat3 | Signal transducer and activator of transcription 3 | 2.04* | 1.67* | 1.85* |
| Vcam1 | Vascular cell adhesion molecule 1 | 1.56 | 1.18 | 3.05* |
p<0.05.
p<0.01.
Table 7. Genes involved in p38 MAPK pathway induced by sulfur mustard at 24, 72 and 168 h post-exposure.
| Gene name | Gene description | Fold change (SM) | ||
|---|---|---|---|---|
| 24 h | 72 h | 168 h | ||
| Creb1 | cAMP responsive element binding protein 1 | 2.92* | 9.38* | 7.89* |
| Ddit3 | DNA-damage-inducible transcript 3 | 1.62* | 1.23 | 1.14 |
| Eef2k | Eukaryotic elongation factor-2 kinase | −1.58† | −1.80* | −1.60† |
| Fas | Fas (TNF receptor superfamily, member 6) | 2.88† | 2.10* | 1.89† |
| H3f3a | H3 histone, family 3A | 1.81* | 1.05 | 1.17 |
| H3f3b | H3 histone, family 3B (H3.3B) | 2.10* | −1.13 | −1.18 |
| Il18 | Interleukin 18 (interferon-gamma-inducing factor) | −2.56* | −1.08 | −1.15 |
| Il1b | Interleukin 1, beta | 35.29† | 34.18† | 51.94† |
| Il1rn | Interleukin 1 receptor antagonist | 1.84† | 1.18 | 1.72 |
| Irak3 | Interleukin-1 receptor-associated kinase 3 | 2.78* | 1.98 | 1.77 |
| Map3k7 | Mitogen-activated protein kinase kinase kinase 7 | 1.66† | 1.38* | 1.74* |
| Mapk13 | Mitogen-activated protein kinase 13 | −1.56* | 1.16 | −1.30 |
| Mef2a | Myocyte enhancer factor 2A | −1.00 | 1.41* | 1.74* |
| Pla2g4b | Phospholipase A2, group IVB (cytosolic) | 1.48* | 1.69* | 1.40 |
| Rps6ka4 | Ribosomal protein S6 kinase, 90 kDa, polypeptide 4 | 1.87† | 1.92† | 1.60† |
| Rps6ka5 | Ribosomal protein S6 kinase, polypeptide 5 | −1.61† | −1.13 | 1.41 |
| Stat1 | Signal transducer and activator of transcription 1 | 1.49* | 1.56* | 1.73† |
| Tgfb2 | Transforming growth factor, beta 2 | −1.70* | −1.89* | −1.68* |
| Tgfb3 | Transforming growth factor, beta 3 | −4.17† | −1.67 | −1.54 |
| Tradd | TNFRSF1A-associated via death domain | 1.54† | 1.33 | 1.22 |
p<0.05.
p<0.01.
Table 8. Genes involved in pro-apoptosis induced by sulfur mustard at 24, 72 and 168 h post-exposure.
| Gene name | Gene description | Fold change (SM) | ||
|---|---|---|---|---|
| 24 h | 72 h | 168 h | ||
| Apaf1 | Apoptotic peptidase activating factor 1 | 2.66* | 2.17† | 1.98 |
| Bax | BCL2-associated X protein | 3.38† | 2.56† | 2.23† |
| Bcl2l11 | BCL2-like 11 (apoptosis facilitator) | 2.41† | 1.96 | 2.44* |
| Bid | BH3 interacting domain death agonist | 1.97† | 2.54* | 2.08* |
| Bmf | Bcl2 modifying factor | 1.30* | 1.56 | 1.48 |
| Fas | Fas (TNF receptor superfamily, member 6) | 2.88† | 2.10* | 1.89† |
| Tnfrsf10b | Tumor necrosis factor receptor superfamily, member 10a | 4.49* | 2.83 | 2.05 |
| Tradd | TNFRSF1A-associated via death domain | 1.54† | 1.33 | 1.22 |
| Traf3 | TNF receptor-associated factor 3 | 1.65* | 1.72 | 2.18* |
p<0.05.
p<0.01.
Table 9. Genes involved in the apoptosis signaling pathway induced by sulfur mustard at 24, 72 and 168 h post-exposure.
| Gene name | Gene description | Fold change (SM) | ||
|---|---|---|---|---|
| 24 h | 72 h | 168 h | ||
| Akt2 | v-akt murine thymoma viral oncogene homolog 2 | 1.78† | 1.46* | 1.41† |
| Bax | BCL2-associated X protein | 3.38† | 2.56† | 2.23† |
| Bid | BH3 interacting domain death agonist | 1.97† | 2.54* | 2.08* |
| Capn3 | Calpain 3, (p94) | 1.47 | 1.61 | 2.16† |
| Capn5 | Calpain 5 | −2.20 | −1.49 | −2.44* |
| Casp8 | Caspase 8, apoptosis-related cysteine peptidase | 1.31 | 1.53* | 1.72† |
| Fas | Fas (TNF receptor superfamily, member 6) | 2.88† | 2.10* | 1.89† |
| Ikbkg | Inhibitor of kappa light polypeptide gene enhancer in B-cells, kinase gamma | 1.59* | 1.80† | 1.48* |
| Map2k1 | Mitogen-activated protein kinase kinase 1 | 1.69* | 2.27* | 2.02† |
| Nfkbia | Nuclear factor of kappa light polypeptide gene enhancer in B-cells inhibitor, alpha | 1.66* | 1.43 | 1.62* |
| Nfkbie | Nuclear factor of kappa light polypeptide gene enhancer in B-cells inhibitor, epsilon | 1.66 | 1.99 | 3.97* |
| Pak3 | p21 (CDKN1A)-activated kinase 3 | −1.69 | −1.70† | −2.19† |
| Pkn1 | Protein kinase N1 | 1.61 | 1.35 | 2.48* |
| Rras2 | Related RAS viral (r-ras) oncogene homolog 2 | 1.94* | 1.98* | 1.79† |
| Ttk | TTK protein kinase | −1.24 | 1.04 | −2.13* |
p<0.05.
p<0.01.
Fig. 5.
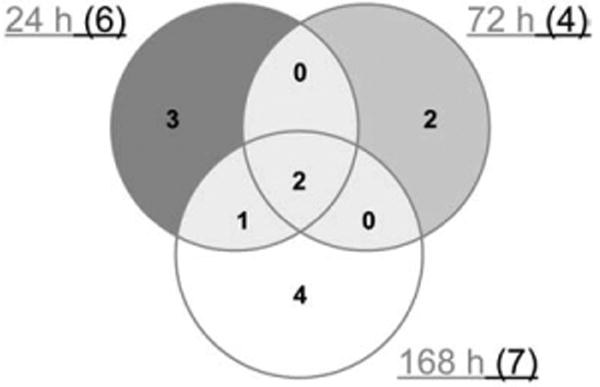
Number of pathways obtained through KEGG analysis for those genes whose expression was significantly altered by sulfur mustard. At least 2 pathways were common for different time points.
Fig. 6.
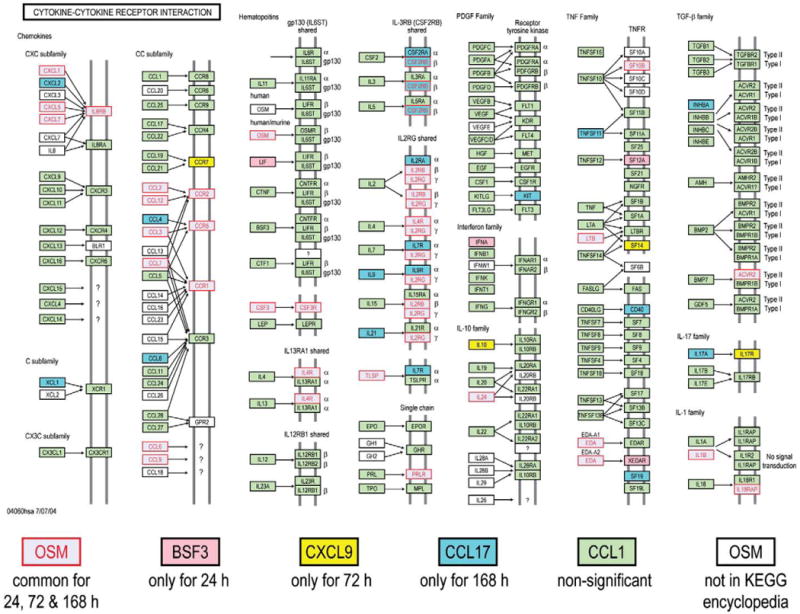
Significantly expressed genes in cytokine–cytokine receptor interaction pathway disturbed by SM at different time points.
Fig. 7.
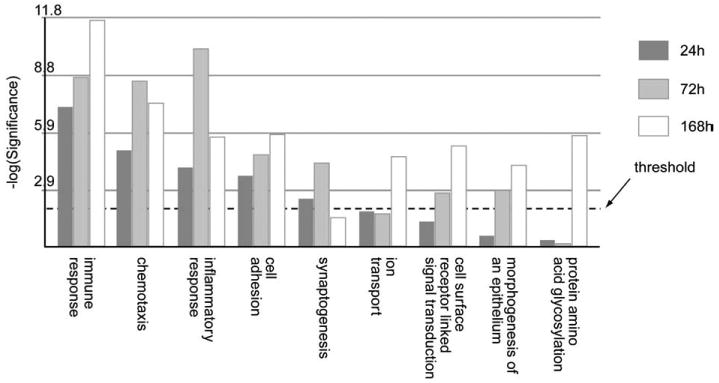
Comparison of biological processes obtained by Gene Ontology analysis whose gene expression was significantly altered by SM at 24 h, 72 h and 168 h respectively. The Y-axis represents the Fisher P value for each biological processes shown in the X-axis. The threshold value used for screening the pathways was a p-value of 0.01 (i.e. −log10(P)=2.0).
Fig. 8.
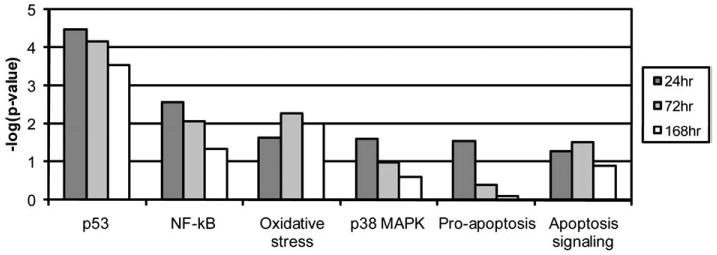
Six biological pathways involved in the SM-induced cutaneous injury at 24, 72 and 168 h post-exposure. The threshold value used for screening the pathways was a p-value of 0.05 (i.e. −log10(P)=1.3).
Fig. 9.
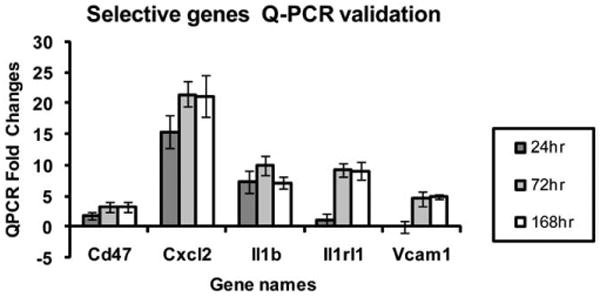
Quantitation of mRNA for selected genes at various time points after treatment.
Fig. 10.
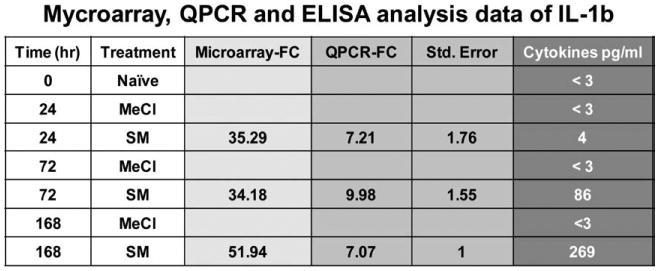
Interleukin 1 beta microarray, QPCR, and protein data.
In order to evaluate the impact of the matrix metalloproteinase inhibitor, an alternative approach based on a predefined group of genes (through metabolic and signaling pathways obtained in KEGG) was used to evaluate differential pathway activities at each time point, post treatment, compared to the control animals. As shown in Table 10, the inhibitor treated animals show different pathway activities for 24 hour exposure. These pathways were mostly metabolic and biosynthesis related genes and represented subtle differences between the inhibitor treated and SM alone. For later responses transcriptional profiles for sulfur mustard treated and inhibitor treated samples overlap. Even though there was no significant histological difference between the SM and SM-I (i.e. with inhibitor) cases, the differential pathway activities identified here can provide insight into the time course progression of gene expression.
Table 10. An alternative approach based on a predefined group of genes (metabolic and signaling pathways in KEGG) was used to evaluate differential pathway activities at each time point, post treatment, compared to the control animals.
| Pathway | SM24* | SMI-24† | SM72* | SMI-72† | SM 168* | SMI-168† |
|---|---|---|---|---|---|---|
| Neurodegenerative disorders | 0.039 | 0.5694 | 0.9517 | 0.7433 | 0.7808 | 0.8799 |
| Thiamine metabolism | 0.04 | 0.1504 | 0.008 | 0.1052 | 0.2437 | 0.1894 |
| Glioma | 0.042 | 0.6121 | 0.9976 | 0.9944 | 0.9824 | 0.9977 |
| Cytokine-cytokine receptor interaction | 0.0456 | 0.0687 | 0.5258 | 0.0022 | 0.4987 | 0.0035 |
| Terpenoid biosynthesis | 0.047 | 0.0701 | 0.0011 | 0.0103 | 0.019 | 0.0008 |
| Methane metabolism | 0.0489 | 0.1945 | 0.0238 | 0.0809 | 0.4053 | 0.0456 |
| Fatty acid biosynthesis | 0.088 | 0.0296 | 0.02 | 0.001 | 0.0107 | 0.0041 |
| Purine metabolism | 0.1679 | 0.0299 | 0.7888 | 0.9612 | 0.6399 | 0.8637 |
| Urea cycle and metabolism of amino groups | 0.1408 | 0.031 | 0.9106 | 0.8238 | 0.3617 | 0.1675 |
| Arachidonic acid metabolism | 0.3127 | 0.0339 | 0.5819 | 0.0206 | 0.0565 | 0.2192 |
| Aminosugars metabolism | 0.2458 | 0.0393 | 0.2348 | 0.3673 | 0.1453 | 0.3668 |
| Cell communication | 0.337 | 0.0427 | 0.376 | 0.0164 | 0.0564 | 0.075 |
| Taurine and hypotaurine metabolism | 0.2754 | 0.0429 | 0.9024 | 0.6113 | 0.5074 | 0.2642 |
| Glycosylphosphatidylinositol | 0.4842 | 0.048 | 0.7613 | 0.5648 | 0.8792 | 0.2443 |
| Nicotinate and nicotinamide metabolism | 0.2134 | 0.1421 | 0.0032 | 0.1505 | 0.1291 | 0.3936 |
| Bile acid biosynthesis | 0.6092 | 0.1469 | 0.0032 | 0.0214 | 0.0486 | 0.0336 |
| Riboflavin metabolism | 0.1653 | 0.1599 | 0.004 | 0.1066 | 0.0129 | 0.2346 |
| 1- and 2-Methylnaphlhalene degradation | 0.1686 | 0.1244 | 0.0046 | 0.0497 | 0.0196 | 0.0486 |
| Fatty acid elongation in mitochondria | 0.3335 | 0.5421 | 0.0083 | 0.1426 | 0.5593 | 0.2223 |
| Metabolism of xenobiotics by cytochrome P450 | 0.6824 | 0.2559 | 0.0116 | 0.06 | 0.4679 | 0.1099 |
| Lysine degradation | 0.4443 | 0.487 | 0.0132 | 0.0467 | 0.2505 | 0.117 |
| Fatty acid metabolism | 0.3226 | 0.2493 | 0.014 | 0.0486 | 0.1827 | 0.1152 |
| gamma-Hexachlorocyclohexane degradation | 0.3418 | 0.158 | 0.018 | 0.049 | 0.0495 | 0.055 |
| Sulfur metabolism | 0.6127 | 0.5662 | 0.0223 | 0.671 | 0.3992 | 0.2367 |
| Tryptophan metabolism | 0.7325 | 0.2778 | 0.0266 | 0.07 | 0.603 | 0.1552 |
| Styrene degradation | 0.2302 | 0.06 | 0.0278 | 0.0916 | 0.264 | 0.0721 |
| Carbazole degradation | 0.8657 | 0.7966 | 0.0281 | 0.18 | 0.0181 | 0.0244 |
| Androgen and estrogen metabolism | 0.8155 | 0.3289 | 0.0293 | 0.1141 | 0.6005 | 0.1842 |
| Reductive carboxylate cycle | 0.3027 | 0.3365 | 0.0367 | 0.0886 | 0.189 | 0.2233 |
| Glutathione merabolism | 0.355 | 0.3515 | 0.0405 | 0.1432 | 0.2103 | 0.2079 |
| 1,1,1-Trichloro-2,2-bis | 0.9007 | 0.8062 | 0.0435 | 0.2153 | 0.0213 | 0.0342 |
| Valine, leucine and isoleucine degradation | 0.7407 | 0.231 | 0.0438 | 0.0322 | 0.1719 | 0.0539 |
| 2,4-Dichlorobenzoate degradation | 0.8281 | 0.3744 | 0.0462 | 0.1379 | 0.0491 | 0.0327 |
| Eenzoate degradation via CoA ligation | 0.298 | 0.2447 | 0.047 | 0.0403 | 0.1013 | 0.0856 |
| Hematopoietic cell lineage | 0.5299 | 0.071 | 0.0476 | 0.8882 | 0.7409 | 0.1487 |
| Synthesis and degradation of ketone bodies | 0.6306 | 0.2081 | 0.0954 | 0.0163 | 0.0537 | 0.0238 |
| Pantothenate and CoA biosynthesis | 0.3431 | 0.1294 | 0.1956 | 0.0213 | 0.097 | 0.0085 |
| Propanoate metaboiism | 0.1823 | 0.1216 | 0.0747 | 0.0287 | 0.0852 | 0.0507 |
| Butanoate metabolism | 0.8944 | 0.2828 | 0.1042 | 0.0294 | 0.1885 | 0.0544 |
| Biosynthesis of steroids | 0.189 | 0.1281 | 0.0525 | 0.0295 | 0.0856 | 0.0238 |
| Linoleic acid metabolism | 0.1662 | 0.351 | 0.2802 | 0.033 | 0.1353 | 0.098 |
| Lysine biosynthesis | 0.4334 | 0.0943 | 0.4849 | 0.0332 | 0.2065 | 0.0709 |
| Glycine, serine and threonine metabolism | 0.639 | 0.3086 | 0.1198 | 0.0363 | 0.1768 | 0.0851 |
| Pyruvate metabolism | 0.5949 | 0.7417 | 0.1988 | 0.0371 | 0.1988 | 0.067 |
| ABC transporters - general | 0.2504 | 0.2368 | 0.3741 | 0.4469 | 0.0185 | 0.2165 |
| Circadian rhythm | 0.1174 | 0.0515 | 0.3505 | 0.2296 | 0.0414 | 0.0762 |
| Inositol metabolism | 0.0754 | 0.0517 | 0.1752 | 0.7487 | 0.3397 | 0.029 |
| Vitamin BS metabolism | 0.4674 | 0.2128 | 0.5157 | 0.0751 | 0.08 | 0.0325 |
Inhibitor treated animals show different pathway activities for 24 h exposure. For later responses transcriptional profiles for sulfur mustard treated and inhibitor treated samples overlap. Even though there was no significant histological difference between the SM and SM-I (i.e. with inhibitor) cases, the differential pathway activities identified here can provide insight into the time course progression of gene expression. The table depicts the p-values associated with the confidence level that there was significant change in the activity of a particular pathway under a specific condition. Gray shaded entries correspond to p-values less than 0.05 and hence express confidence that a particular pathway was indeed altered at that condition.
Exposure to sulfur mustard only.
Exposure to Sulfur Mustard plus Inhibitor.
Discussion
One ultimate goal of vesicant research is to identify potential effective medical countermeasures to alkylation injury of the skin and to identify biomarkers for different stages of vesicant injury and wound repair. This would provide the methodology to screen large numbers of novel compounds quickly and act as a qualitative tool to determine their potential effectiveness in alleviating damage or enhancing wound repair. One approach is to identify biomarkers that correlate to histological improvements after application of a novel countermeasure.
Microarray technology is a useful tool which provides an indication of the changing gene expression between control samples and those exposed to toxicants. In general, transcriptional analysis can generate proxies that monitor critical events associated with post-exposure changes at the cellular level; the information from transcriptional signatures can lead to development of hypotheses associated with modes of action (Androulakis, 2005). A majority of transcriptional studies to date focused on terminal events at a very coarse temporal resolution, loosely characterized as before vs. after, healthy vs. unhealthy, treated vs. vehicle, in an effort to identify clear and distinguishing variations between terminal states (Androulakis et al., 2007). However, in order to understand the progression of a phenotypic response towards a terminal state or, more importantly, the identification of “intervention” strategies, the time-evolution of the transcriptional phenomenon is critical. Additional detailed time-course experiments provide “kinetic” information on the critical points and rates associated with the post-exposure response, and can provide insight into possible interventions that alter the progression of the response. Therefore, high(er) temporal resolution transcriptional studies enable improved characterization of the cellular processes as they evolve over time thus enabling the identification of the state changes and points of intervention associated with the progress of the response. Furthermore, time-course measurements will critically assist the development of quantitative and predictive state progression models. Therefore, the present study focused on longer time periods (24, 72, and 168 h) than previously reported, in order to allow enough time for wound repair to commence.
Initial analysis used the methodology of the Gene Ontology (GO) Consortium in combination with KEGG pathway analysis. Common gene pathways for the SM-treated time-points included cytokine–cytokine receptor interaction and Jak-STAT signaling. Both of these pathways correspond to persistent inflammation, which was observed histologically as well as in the gene chip analysis (data not shown). It will be interesting to see whether the inflammatory cell population follows a defined progression from neutrophils to macrophages to mast cells over time as is true for the incisional wound model (Stramer et al., 2007). In addition to inflammatory pathways, two novel repair pathways became prominent 72 h post-treatment. These were cell communication and the Hedgehog signaling pathway, the latter of which is a pathway which plays a critical role in the regulation of the development of several tissues and organs (Ma et al., 2008). By 168 h post-treatment several additional pathways are activated including cell adhesion molecules, neuroactive ligand–receptor interactions, glycosphingolipid biosynthesis, and complement and coagulation cascades. In a broad sense, these may all be considered repair pathways. It is fully expected that additional repair pathways will turn on even later, which would require further experiments that carry the model out at least a month or more. The data were analyzed a slightly different way, sorting according to the top biological functions, and similar results occurred. The biological functions included inflammation, immunological activation, cell movement, and cell death, also supporting the notion that cells are actively dividing and migrating in an attempt to heal the wound. These data are consistent with the belief that inflammation is persistent and a long-term process in the MEVM. In fact, genes involved in the inflammatory pathway topped the list in every type of analysis performed in this study. The most significant individual mRNA increase was for CXCL2 (also called MIP-2, macrophage inflammatory protein-2) and increased by a tremendous 500 fold by 168 h post-treatment (Table 3). This protein is involved with neutrophil recruitment and other inflammatory processes, so CXCL2 upregulation was not unexpected. Other inflammatory genes significantly upregulated after sulfur mustard exposure included CCL2, CCR1, Il1b, Il6, and PTGS2. All of these increased dramatically by 24 h post-SM exposure, demonstrating the value of analyzing early time points as well as the later ones. Several of these cytokines and Vcam1 were chosen for quantitation of their mRNA for the various time points (Fig. 9). In every case the mRNA validated the general trends of the microarray data. In order to validate that mRNA is translated into protein, interleukin 1 beta was quantitated and agreed with the microarray and mRNA data (Fig. 10). The major gene pathways affected by sulfur mustard were predominantly inflammatory, apoptosis, and stress-related pathways (Tables 3–9). These all reflect the severity of the wound caused by sulfur mustard exposure. Testing an inhibitor of matrix metalloproteinase activity demonstrated that subtle, but specific changes do occur in the gene profiles when microarray analysis is performed (Table 10). Since these changes are more quantitative than the histological changes which are more qualitative (evaluating amount of edema, number of invading inflammatory cells, and severity of necrosis), these differences in microarray patterns may correlate to predictable changes in SM exposed skin and lead to the identification of biomarkers for specific stages of injury. The pathway changes observed in the inhibitor I microarrays involved the metabolism, degradation, and biosynthesis of many molecules suggesting that the wound healing response was slightly accelerated using MMP-2/9 inhibitor I, although no gross changes in inflammation, or inflammatory genes were noted.
Taken together, the microarray data provide detailed information regarding the genes that become activated in mouse skin following exposure to sulfur mustard. Many of these genes reflect biologic processes. In general, a host of cytokines and mediators of inflammation are released and activated early (within 24 h) after SM exposure. These include genes in the NFKb pathway and the p38 MAP kinase pathway. Hyperproliferation and cell division are also activated early as seen by a number of genes under control of the p53 signaling pathway. Apoptosis and oxidative stress genes also turn on early and remain on throughout all the time points observed. When this methodology was applied to the MMP-2/MMP-9 inhibitor I data, there were numerous repair process genes that became activated when compared to SM-alone treated samples. This demonstrates the sensitivity of the assay since we did not observe any quantitative histological differences between SM-alone and MMP inhibitor I treated samples. If these results can be replicated and the same genes that were activated in this system identified, there is potential for use of microarrays as markers of repair.
Although the data were analyzed in several different ways, the major results were similar, depending on the analysis employed. However, there were subtle differences between the various analyses. Regardless of the different results, all the methods were valid and useful in analyzing gene expression at different time periods post-exposure. Higher time resolution gene expression experiments, partly performed in this study, beyond the standard dose–response analysis, will significantly boost the ability to cross over from the present, mostly, descriptive nature of genomics towards a more useful mathematical model-based analysis that identifies specific phases of wound progression and repair in order to developed targeted medical interventions. Microarray analysis shows strong potential for advancing the knowledge of the MEVM system and for use as a prescreening tool to predict the general effectiveness of medical countermeasures to vesicant injury.
Acknowledgments
This research was supported in part by the following grants: NIEHS sponsored UMDNJ Center for Environmental Exposures and Disease (Grant # NIEHS P30ES005022); NIH/NIEHS funded Training in Environmental Toxicology (ES004738); NIH/NEI funded Expression of Specialized Collagens in Cornea (EY09056); NIH funded CounterACT Program (NIAMS U54AR055073); and USEPA STAR Grant funded Environmental Bioinformatics and Computational Toxicology Center (GAD R 832721-010). Its contents are solely the responsibility of the authors and do not necessarily represent the official views of the funding agencies including NIH, USFDA, and USEPA. Appreciation is extended to Linda Everett of EOHSI for editorial assistance.
References
- Androulakis IP. Selecting maximally informative genes. Comput Chem Eng. 2005;29:535–546. [Google Scholar]
- Androulakis IP, Yang E, Almon RR. Analysis of time-series gene expression data: methods, challenges, and opportunities. Annu Rev Biomed Eng. 2007;9:205–228. doi: 10.1146/annurev.bioeng.9.060906.151904. [DOI] [PMC free article] [PubMed] [Google Scholar]
- Cowan KN, Jones PL, Rabinovitch M. Elastase and matrix metalloproteinase inhibitors induce regression, and tenascin-C antisense prevents progression, of vascular disease. J Clin Invest. 2000;105:21–34. doi: 10.1172/JCI6539. [DOI] [PMC free article] [PubMed] [Google Scholar]
- Dillman JF, III, Hege AI, Phillips CS, Orzolek LD, Sylvester AJ, Bossone C, Henemyre-Harris C, Kiser RC, Choi YW, Schlager JJ, Sabourin CL. Microarray analysis of mouse ear tissue exposed to bis-(2-chloroethyl) sulfide: gene expression profiles correlate with treatment efficacy and an established clinical endpoint. J Pharmacol Exp Ther. 2006;317:76–87. doi: 10.1124/jpet.105.097014. [DOI] [PubMed] [Google Scholar]
- Ingenuity Systems . Ingenuity Pathways Analysis (IPA) 2008. [Google Scholar]
- Kanehisa M, Goto S, Kawashima S, Okuno Y, Hattori M. The KEGG resource for deciphering the genome. Nucleic Acids Res. 2004;32:D277–D280. doi: 10.1093/nar/gkh063. [DOI] [PMC free article] [PubMed] [Google Scholar]
- Ma G, Xiao Y, He L. Recent progress in the study of Hedgehog signaling. J Genet Genomics. 2008;35:129–137. doi: 10.1016/S1673-8527(08)60019-3. [DOI] [PubMed] [Google Scholar]
- Monteiro-Riviere NA, Inman AO, Babin MC, Casillas RP. Immunohistochemical characterization of the basement membrane epitopes in bis(2-chloroethyl) sulfide-induced toxicity in mouse ear skin. J Appl Toxicol. 1999;19:313–328. doi: 10.1002/(sici)1099-1263(199909/10)19:5<313::aid-jat582>3.0.co;2-x. [DOI] [PubMed] [Google Scholar]
- Powers JC, Kam CM, Ricketts KM, Casillas RP. Cutaneous protease activity in the mouse ear vesicant model. J Appl Toxicol. 2000;20(Suppl. 1):S177–S182. doi: 10.1002/1099-1263(200012)20:1+<::aid-jat678>3.0.co;2-9. [DOI] [PubMed] [Google Scholar]
- Rogers JV, Choi YW, Kiser RC, Babin MC, Casillas RP, Schlager JJ, Sabourin CL. Microarray analysis of gene expression in murine skin exposed to sulfur mustard. J Biochem Mol Toxicol. 2004;18:289–299. doi: 10.1002/jbt.20043. [DOI] [PubMed] [Google Scholar]
- Sabourin CL, Rogers JV, Choi YW, Kiser RC, Casillas RP, Babin MC, Schlager JJ. Time- and dose-dependent analysis of gene expression using microarrays in sulfur mustard-exposed mice. J Biochem Mol Toxicol. 2004;18:300–312. doi: 10.1002/jbt.20047. [DOI] [PubMed] [Google Scholar]
- Shakarjian MP, Bhatt P, Gordon MK, Chang YC, Casbohm SL, Rudge TL, Kiser RC, Sabourin CL, Casillas RP, Ohman-Strickland P, Riley DJ, Gerecke DR. Preferential expression of matrix metalloproteinase-9 in mouse skin after sulfur mustard exposure. J Appl Toxicol. 2006;26:239–246. doi: 10.1002/jat.1134. [DOI] [PubMed] [Google Scholar]
- Stramer BM, Mori R, Martin P. The inflammation-fibrosis link? A Jekyll and Hyde role for blood cells during wound repair. J Invest Dermatol. 2007;127:1009–1017. doi: 10.1038/sj.jid.5700811. [DOI] [PubMed] [Google Scholar]
- Tong W, Cao X, Harris S, Sun H, Fang H, Fuscoe J, Harris A, Hong H, Xie Q, Perkins R, Shi L, Casciano D. ArrayTrack-supporting toxicogenomic research at the U.S. Food and Drug Administration National Center for Toxicological Research. Environ Health Perspect. 2003;111:1819–1826. doi: 10.1289/ehp.6497. [DOI] [PMC free article] [PubMed] [Google Scholar]
- Tong W, Harris S, Cao X, Fang H, Shi L, Sun H, Fuscoe J, Harris A, Hong H, Xie Q, Perkins R, Casciano D. Development of public toxicogenomics software for microarray data management and analysis. Mutat Res. 2004;549:241–253. doi: 10.1016/j.mrfmmm.2003.12.024. [DOI] [PubMed] [Google Scholar]
- Yancey KB. The pathophysiology of autoimmune blistering diseases. J Clin Invest. 2005;115:825–828. doi: 10.1172/JCI24855. [DOI] [PMC free article] [PubMed] [Google Scholar]