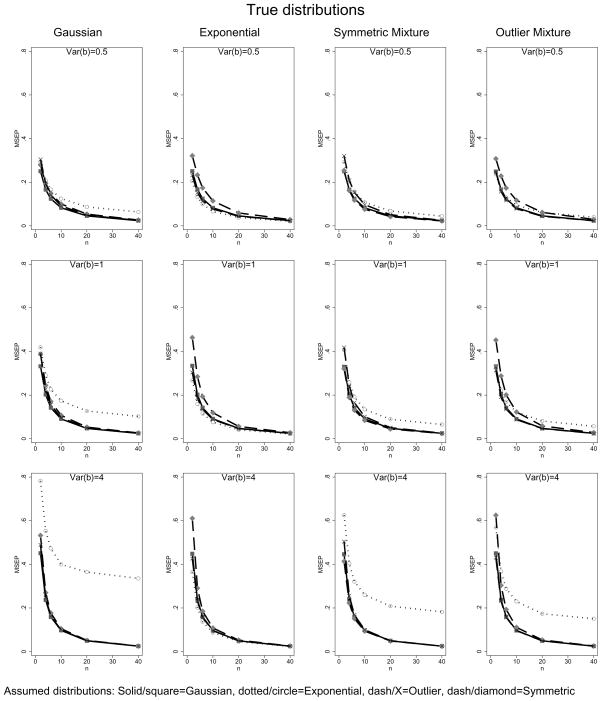
Figure 3.
Mean square error of prediction with various true and assumed distributions and sample sizes. Different columns contain different true distributions. Each row is a different value of the random effects variance and each plot shows the mean square error of prediction as a function of cluster size with separate curves for different assumed distributions.

