

Abstract
In biofilms, diffusion may limit the chemical activity of nutrients, toxic compounds, and medicines. This study provides direct, noninvasive insight into the factors that will most effectively limit the transport of antibiotics and biocides in biofilms. Self-diffusion coefficients have been determined for a number of fluorescent probes in biofilms of Streptococcus mutans using fluorescence correlation spectroscopy. The effects of probe size and charge and the roles of biofilm pH, ionic strength, and heterogeneity were studied systematically. The relative diffusion coefficients (D in the biofilm divided by that in water) decreased with increasing probe size (3,000-molecular-weight [3K], 10K, 40K, 70K, and 2,000K dextrans). Studies using variably charged substrates (tetramethylrhodamine, Oregon Green, rhodamine B, and rhodamine 6G) showed that the self-diffusion coefficients decreased with an increasing negative charge of the fluorescent probes. No significant effect was observed for changes to the ionic strength (10−4 to 10−1 M) or pH (4 to 9) of the biofilm. Biofilm heterogeneity was responsible for variations of ca. one order of magnitude in the diffusion coefficients.
Biofilms are complex suprastructures in which bacterial microcolonies are dispersed in a matrix of extracellular polymeric substances (EPS; polysaccharides, proteins, and DNA), lipids, and other metabolites (3, 6, 11, 14, 21). Due to the functional groups on the EPS (e.g., carboxylate, pyruvate, sulfate, etc.), the biofilm generally has an overall negative charge and a high water content (21). The specific structure of biofilms is thought to provide them with a high level of resistance to antibiotics, disinfectants, and detergents (7, 19, 20). For example, it has been reported that the minimum antibiotic concentration to kill bacteria found in biofilms was about 100 to 1,000 times greater than what was observed for the planktonic organisms (19). A long-standing explanation for the observed increased tolerance to antibiotics is that the biofilm constitutes an effective barrier to the penetration of antimicrobial agents, which is related to a reduction in their diffusive flux with respect to that observed in water (18, 19). To that end, it is vital to quantify diffusion in biofilms (23), preferably with noninvasive methods, such as fluorescence correlation spectroscopy (FCS) (4, 15) or attenuated total reflection-Fourier transform infrared spectroscopy (ATR-FTIR) (17). Unfortunately, no consensus yet exists on the role of biofilms in diffusion. Relative diffusion coefficients (defined as the diffusion coefficient, D, in a biofilm divided by that in water) vary greatly across the literature.
In this paper, the effects of substrate size and charge and of biofilm pH and ionic strength were studied systematically for a biofilm of Streptococcus mutans. S. mutans is a main constituent of dental plaque, which can form dense biofilms both in vivo and in vitro (16). The diffusion coefficients of particle-size standards (dextrans of 3,000 molecular weight [3K], 10K, 40K, 70K, and 2,000K) and variably charged substrates (tetramethylrhodamine, Oregon Green, rhodamine B, and rhodamine 6G) were measured in the biofilms and in water using FCS at very low probe concentrations (20 to 100 nM). In parallel, complementary observations of confocal microscopy were performed in order to provide information on the physiological state of the biofilms, as well as their thickness and heterogeneity.
MATERIALS AND METHODS
Chemicals.
Fluorescent dextrans (3K, 10K, 40K, 70K, and 2,000K) and several other fluorescent probes (tetramethylrhodamine, methyl ester [TMRM]; Oregon Green 488 carboxylic acid, succinimidyl ester [Oregon 1C]; and Oregon Green 488 carboxylic acid [Oregon 2C]) were purchased from Invitrogen. Rhodamine B (RB; ≥97.0%) and rhodamine 110 (R110; ≥ 99.0%) were obtained from Fluka, while rhodamine 6G (R6G) was acquired from Sigma-Aldrich. A summary of the physicochemical properties of the probes is provided in Table 1. For all fluorophores except Oregon 1C and 2C, small quantities of fluorophore were added to Milli-Q water (R > 18 MΩ cm) to obtain stock solutions in the micromolar concentration range. Oregon 1C and 2C were dissolved in 1 mM MES (morpholineethanesulfonic acid), pH 7.2. Samples were prepared by dilution of the stock solutions into an electrolyte solution with a controlled pH and ionic strength so as to obtain a final probe concentration of 20, 50, or 100 nM (pH 4 to 9, ionic strength 0.1 to 100 mM). For the pH experiments, Na-acetate (99.7%; Fisher), Na-MES (ultra grade; Sigma), Na-HEPES (≥99.5%; Sigma), and Na-AMPSO [N-(1,1-dimethyl-2-hydroxyethyl)-3-amino-2-hydroxypropanesulfonic acid; Sigma] were used to prepare 1 mM pH buffers that were adjusted using HNO3 (65%; Fluka). KCl (99.0 to 100.5%; Sigma-Aldrich) was used to adjust the ionic strength of the solutions. pH was measured using a Metrohm 744 pH meter and a Metrohm Pt 1000 combination pH electrode, calibrated with standard NBS buffers.
TABLE 1.
Physicochemical properties of the fluorescent probes of diffusion
| Probe(s) | Functional group(s) | Net charge |
|---|---|---|
| Dextran (3K, 10K, 40K, 70K, 2,000K) | None | 0 |
| Rhodamine 6G | Ammonium | +1 |
| Tetramethylrhodamine, methyl ester | Ammonium | +1 |
| Rhodamine B | Ammonium, carboxylate (zwitterion) | 0 |
| Oregon Green 488 carboxylic acid, succinimidyl ester | Carboxylate | −1 |
| Oregon Green 488 carboxylic acid | Carboxylate | −2 |
Preparation of biofilms.
Trypticase yeast extract (TYE) medium was prepared with 17 g/liter BBL Trypticase peptone (B11921; BD), 3 g/liter yeast extract (VWR), 5 g/liter NaCl (Fisher Scientific), and 2.5 g/liter Na2HPO4 (Sigma-Aldrich) to obtain a liquid or solid culture medium (solid medium also contained 15 g/liter agarose and 25 ml/liter of 40% glucose; Fluka). Solutions of 40% glucose and sucrose (Difco) were prepared in Milli-Q water. A phosphate-buffered saline (PBS) buffer (pH 7.2) was prepared with 8.76 g/liter NaCl (Fisher Scientific), 6.05 g/liter K2HPO4 (Sigma), and 1.7 g/liter KH2PO4 (Sigma) in Milli-Q water. All culture media and components were autoclaved prior to use.
S. mutans (NCTC 10449) was inoculated on the solid TYE culture medium and incubated for 24 h in the dark at 37°C. A small number of cells were transferred into 10 ml of the liquid TYE culture medium containing 0.2% glucose, where cells were again incubated for 24 h in the dark at 37°C. One ml of bacterial suspension was then diluted 10-fold in liquid TYE culture medium containing 0.5% sucrose. Five hundred microliters of the mixture was added to each well of an 8-well coverglass (Nunc), and the culture was incubated for another 24 h in the dark at 37°C in order to form replicate biofilms in each of the wells. The biofilms were gently washed twice with PBS buffer and then three times with the solutions containing the target probes. After a 20-min equilibration with the final 0.5 ml of probe-containing solution, fluorescence correlation spectroscopy (FCS) was performed in the biofilms within a few microns from the surface of the coverglass.
Fluorescence correlation spectroscopy.
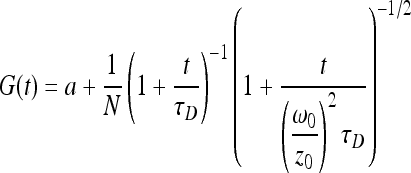
The principle of FCS has been explained in detail elsewhere (9). In brief, FCS uses a confocal microscope (Leica TCS SP5) to define a ca. 1-μm3 volume through which the diffusion times of fluorescently labeled probes are measured. In this study, fluorophores were excited with an argon ion laser at 488 or 514 nm and fluorescence intensity fluctuations were quantified using an avalanche photodiode detector (Leica). The probe concentrations were selected to ensure that only a few fluorophores occupied the confocal volume at any given time (optimal signal-to-noise ratio) and to minimize perturbations to the biofilm from the probe. In the absence of chemical reactions or other dynamic processes, temporal fluctuations in intensity can be attributed solely to the translational diffusion of the fluorescent probe (time scales, 10−7 to >102 s). When the frequency and intensity of fluctuations are recorded as a function of time, an autocorrelation function can be computed that is related to the dynamic parameters of the system. In this case, diffusion times were determined from an autocorrelation function that assumed a three-dimensional Gaussian distribution, G(t), of the fluorophores in the confocal volume (1), as follows:
 |
(1) |
where a is a constant offset caused either by a change in fluorophore concentration or by the movement of the biofilm, N is the average number of fluorescent particles in the confocal volume, τD(s) is the characteristic diffusion time of the fluorescent species in the sample volume, t(s) is the delay time, and ω0(m) and z0(m) are the transversal and longitudinal radii of the confocal volume, respectively. The values of ω0 and z0 can be determined by a multiparametric fit of the data obtained by calibrating the system with 5 concentrations of rhodamine 110 (Fluka) in water, which has a known diffusion coefficient of 4.4 × 10⁻¹⁰ m2 s−1 (12). Diffusion times, τD, of unknown fluorescent probes were obtained by fitting the experimental points by equation 1. Diffusion coefficients (Db, biofilm; Dw, water) were calculated from equation 2:
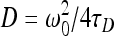 |
(2) |
Since FCS diffusion coefficients are determined from the Brownian motion of the fluorophore, they are self-diffusion coefficients, which are different from mutual diffusion measurements performed in the presence of a chemical gradient. Self-diffusion coefficients are determined from fluorescence intensity fluctuations at steady state and, thus, should not be affected by the binding of fluorophore to the biofilm or a decrease in chemical flux. Raw data were interpreted using ISS Vista FCS software (version 3.6_37).
For the determination of diffusion coefficients in water, measurements were repeated 10 to 15 times at a single location in solution with data acquisition times of 100 to 200 s (time that each data set was allowed to accumulate in order to reduce the signal-to-noise ratio). In the biofilms, acquisition times were increased to 200 to 500 s to account for sample heterogeneity. Furthermore, in the biofilms, each measurement was repeated 3 to 5 times at 6 to 8 randomly selected locations (typical spatial displacement of >500 μm). Error bars are indicative of the standard deviations of replicate measurements. Because of the heterogeneous and potentially dynamic nature of the biofilms, some shifts in the autocorrelation curves were observed at longer correlation times (much larger diffusion times); these were not included in the data analysis. All the experiments were performed in a climate-regulated laboratory at room temperature (23 ± 1.5°C) (mean ± standard deviation).
RESULTS AND DISCUSSION
Microscopic observations of the biofilm structure and health.
In situ examinations of the biofilms were performed by confocal microscopy. The biofilm appeared to be well attached to the surface of sample wells (Fig. 1b, c, and d), with an average thickness (after extensive washing) of about 15 μm (Fig. 1a). Microcolonies were observed to be irregularly dispersed in exopolymers (Fig. 1b), but dead cells did not predominate in any one area. The structure of the microcolonies reflected in part the preparation method, in which long chains of bacteria were first formed in solution prior to their attachment on the surface. A standard Live/Dead BacLight (Invitrogen) test using SYTO9-propidium iodide indicated that the vast majority of cells in the biofilm were alive.
FIG. 1.

(a) FCS image of S. mutans biofilm and experimental position (the cross in the image); (b to d) Live/Dead test of S. mutans biofilms with BacLight: green-labeled cells are presumed to be live; red-labeled cells are presumed to be dead. Green illumination only (b); red illumination only (c); overlay (both laser excitation wavelengths) (d).
Heterogeneity of the biofilm.
At a microscopic level, it was clear that the physical structure and the distribution of bacterial cells were fairly heterogeneous. In order to evaluate whether biofilm heterogeneity affected the local diffusion of the substrates, measurements were made at 8 randomly selected positions (Fig. 2). For Oregon 1C, diffusion coefficients in the biofilm varied from 4.7 ± 0.2 (10−11 m2·s−1) (mean ± standard deviation) to 9.2 ± 2.2 (10−11 m2·s−1), i.e., a variation of 100%. Note that for a similar experiment performed in water, D varied from 2.6 ± 0.2 (10−10 m2·s−1) to 3.1 ± 0.1 (10−10 m2·s−1), a variation of 19.7%. There was no apparent relationship between biofilm position and diffusion coefficient (i.e., we saw no obvious relationship between the microscopic positioning of the observations in the biofilm and the values of the diffusion coefficients).
FIG. 2.

Experimental positions and diffusion coefficients of Oregon 1C in biofilms of S. mutans. Each value of diffusion coefficient represents the mean and standard deviation for 5 repeated measurements in the biofilm.
Influence of substrate size on diffusion in the biofilm.
The diffusion coefficients of the fluorescent dextrans in water are given in Table 2. The diffusion coefficients decreased with increasing molar mass in line with values in the literature (13). Furthermore, based upon calculations using the Stokes-Einstein equation, hydrodynamic radii of 1.4 nm to 5.8 nm were calculated, also similar to values in the literature (2). In the biofilms, the diffusion coefficients for the 3K to 70K dextrans were 27 to 47% lower than those observed in water. The magnitude of the observed decreases is similar to previously observed values (22) and likely mainly reflects the increased tortuosity and viscosity of the biofilms. It also suggests that the average “pore size” of the biofilms was in the range of 20 to 50 nm. Indeed, for the 2,000K (36-nm) dextran, diffusion decreased by 10-fold with respect to that of the 3K dextran. Surprisingly, the diffusion coefficients of the 2,000K dextrans were larger than those obtained in water. Since FCS measures self diffusion (i.e., due to Brownian motion), diffusion coefficients should not be influenced by an overall acceleration of the diffusive flux due to phenomena such as the development of a chemical gradient (e.g., due to a Donnan potential on the biofilm matrix). The most feasible explanation for this observation is that free fluorophores or small pieces of the 2,000K dextrans were able to diffuse into the biofilm, while the majority of the particles were excluded. Indeed, for a given concentration of the 2,000K dextran, the fluorescence intensity in the biofilm was significantly smaller than that in water. When experiments were repeated using an extensively (3K) dialyzed sample, the data could not be correlated due to low fluorescence intensity of the biofilm; no diffusion coefficient could be determined. Substantial exclusion of the 2,000K dextran (ca. 71 nm) would again support the hypothesis that the effective pore size of the biofilm was in the range of 50 nm.
TABLE 2.
Diffusion coefficients and the corresponding hydrodynamic radii of fluorescently labeled probes in water and in biofilms of S. mutans
| Probe | Mwa (g/mole) | Mean Dw ± SD (10−10 m2·s−1) | rHb (nm) | Dw (10−10 m2·s−1) in literature | rH from literatured (nm) | Mean Db ± SD (10−10 m2·s−1) | Db/Dw |
|---|---|---|---|---|---|---|---|
| Dextran 3K | 3,000 | 1.61 ± 0.22 | 1.36 | 1.2 ± 0.3 | 0.73 | ||
| Dextran 10K | 10,000 | 1.22 ± 0.04 | 1.78 | 1.86 | 0.8 ± 0.2 | 0.63 | |
| Dextran 40K | 40,000 | 0.47 ± 0.018 | 4.59 | 0.45c | 4.78 | 0.25 ± 0.08 | 0.53 |
| Dextran 70K | 70,000 | 0.37 ± 0.066 | 5.80 | 0.38c | 6.49 | 0.20 ± 0.06 | 0.53 |
| Dextran 2,000K | 2000,000 | 0.062 ± 0.0081 | 35.7 | 0.13 ± 0.06 | 2.10 | ||
| Rhodamine 6G | 479.01 | 4.0 ± 0.2 | 4.0 ± 0.3e | 2.2 ± 0.7 | 0.54 | ||
| Tetramethylrhodamine, methyl ester | 500.93 | 4.12 ± 0.18 | 0.53 | 2.3 ± 0.7 | 0.55 | ||
| Rhodamine B | 479.01 | 4.2 ± 0.2 | 4.2 ± 0.3e | 1.8 ± 0.7 | 0.42 | ||
| Oregon Green 488 carboxylic acid, succinimidyl ester | 509.38 | 3.08 ± 0.10 | 0.70 | 0.7 ± 0.2 | 0.21 | ||
| Oregon Green 488 carboxylic acid | 412.30 | 3.36 ± 0.11 | 0.65 | 0.6 ± 0.2 | 0.17 |
Influence of the pH on diffusion in the biofilm.
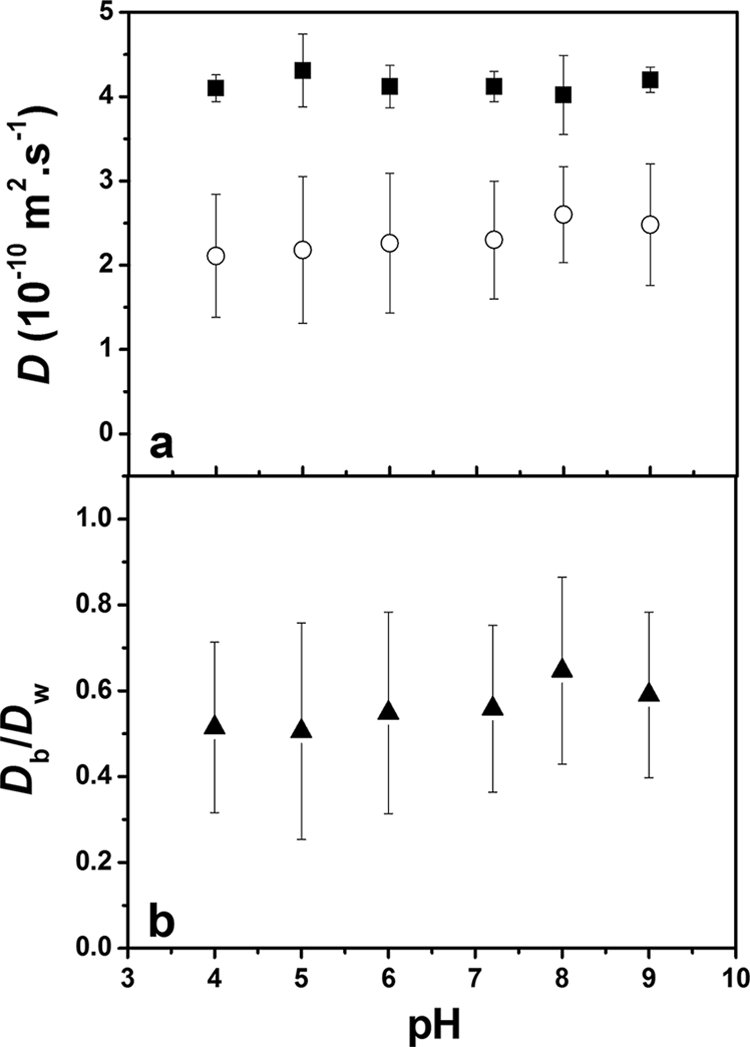
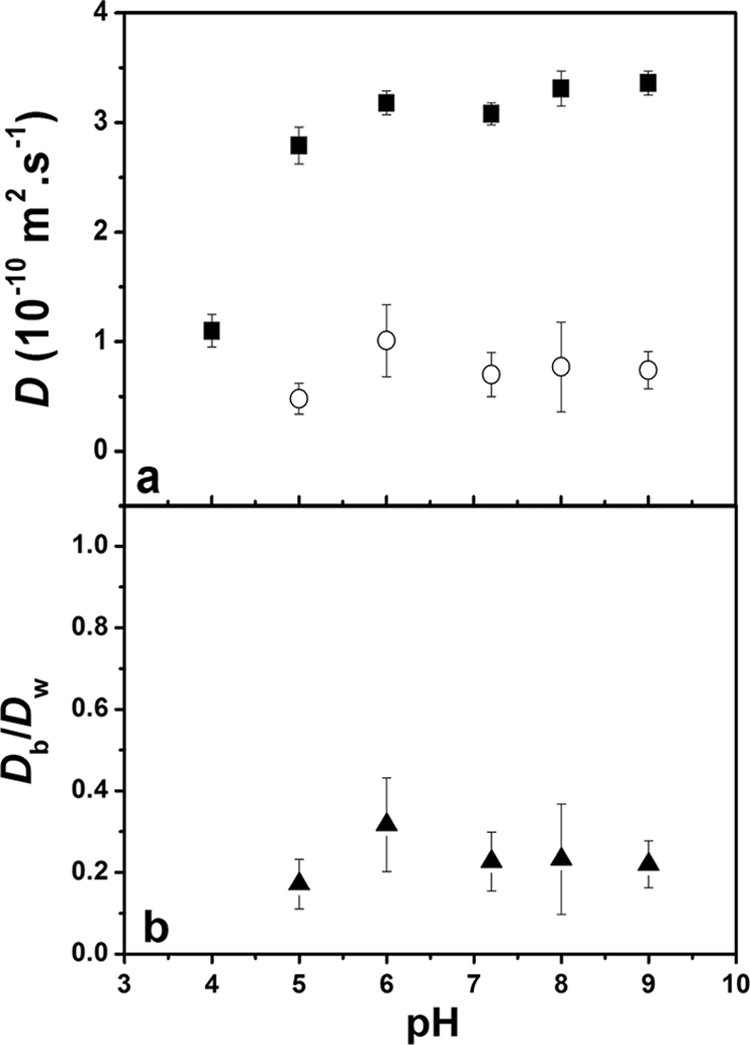
The effect of the biofilm pH, over the range of 4 to 9, was examined for two probes. TMRM contains a quaternary ammonium group, similar that found in a number of common antibacterial agents, while Oregon 1C has a protonable carboxylic acid (pKa ≈ 4.6). Therefore, the quaternary ammonium group of the TMRM should always remain positively charged (+1), while the Oregon 1C will remain negatively charged (−1) for all pHs except pH 4 (where it will have a global negative charge that is much closer to 0). Due to the large number of functional groups that are found in the biofilm, pH decreases may also decrease the overall negative charge of the biofilm. Over the pH range examined, diffusion coefficients of the TMRM varied little, with an average value of 2.3 × 10⁻¹⁰ m2·s−1, about 55% of that found in water (Fig. 3). On the other hand, the diffusion coefficient of Oregon 1C was relatively constant above pH 5, while it decreased significantly at pH 4, which was below the pKa for the protonation of the carboxylic acid (Fig. 4). Given that the diffusion coefficient decreased both in water and in the biofilm, it is likely that the protonation of the probe led to increased aggregation and, thus, probe size. Protonation of the probe at the lower pH would lead to decreased intramolecular repulsion among the fluorophores, facilitating probe aggregation and leading to a decrease in the diffusion coefficient. Given that the relative diffusion coefficients remained fairly stable for Oregon 1C and since no change in D was observed for TMRM, the data suggested that pH variations from 4 to 9 had relatively little direct effect on the charge density of the biofilm. Such observations are consistent with the nature of the functional groups found in the biofilms, the majority of which will not change their protonation state over this pH range (24). Another possible explanation would be that the biofilm is not highly enough charged to have a significant effect on the diffusion of the probes. In order to test the latter hypothesis, the role of biofilm charge was probed in two manners: by varying the ionic strength in order to increase the charge screening of functional groups in the biofilm and by varying the charge of similarly sized fluorescent probes.
FIG. 3.
(a) Absolute diffusion coefficients of TMRM in water (▪) and in S. mutans biofilms (○) as a function of pH. (b) Relative diffusion coefficients of TMRM as a function of pH. Ionic strength = 1 mM. Error bars show standard deviations.
FIG. 4.
(a) Absolute diffusion coefficients of Oregon 1C in water (▪) and in S. mutans biofilms (○) as a function of pH. (b) Relative diffusion coefficients of Oregon 1C as a function of pH. Ionic strength = 1 mM. Under the low-pH condition, missing data points are due to a fluorescence intensity that was too low to obtain a valid autocorrelation. Error bars show standard deviations.
Influences of ionic strength on diffusion in the biofilm.
Over the large range of experimental ionic strengths (0.1 to 100 mM), no significant effect was observed for the diffusion coefficients of either TMRM or Oregon 1C in water or in the biofilm (Fig. 5 and 6). In water, no effect on solution viscosity is expected over these ionic strength ranges. On the other hand, this increase in ionic strength would be expected to increasingly screen the charges of the biofilm, resulting in a reduction of the Debye length of the functional groups on the EPS. For example, at an ionic strength of 0.1 mM, the Debye length is on the order of 10 nm, while at 100 mM, the charge effect (Debye length) should only extend about 1 nm from the surface of the EPS. In other words, the effective pore size is predicted to increase by about 10 nm as the ionic strength is increased from 0.1 to 100 mM. Such an effect would be expected to have a significant role in substrate diffusion for substantially larger probes or a smaller effective pore size in the biofilm. Note that the majority of antibiotics have sizes that are similar to those of the probes used here. On the other hand, a significant reduction of the diffusion coefficient would be predicted for nanoencapsulated substrates and for denser biofilms.
FIG. 5.
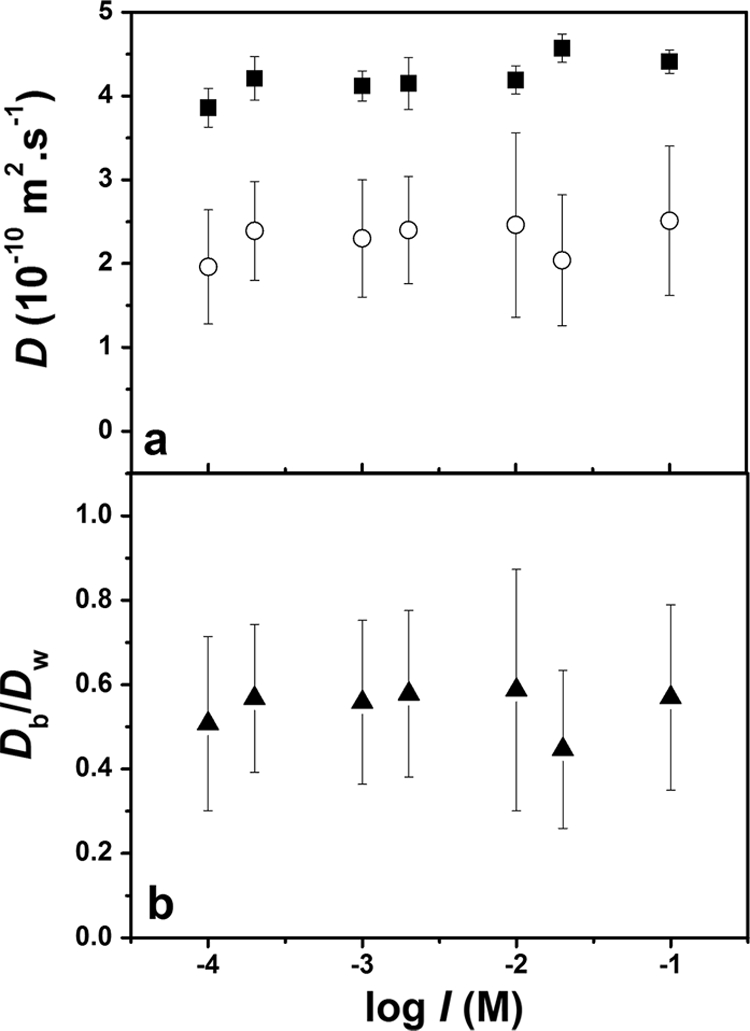
(a) Absolute diffusion coefficients of TMRM in water (▪) and in S. mutans biofilms (○) as a function of ionic strength. (b) Relative diffusion coefficients of TMRM as a function of ionic strength. pH = 7.2. Error bars show standard deviations.
FIG. 6.
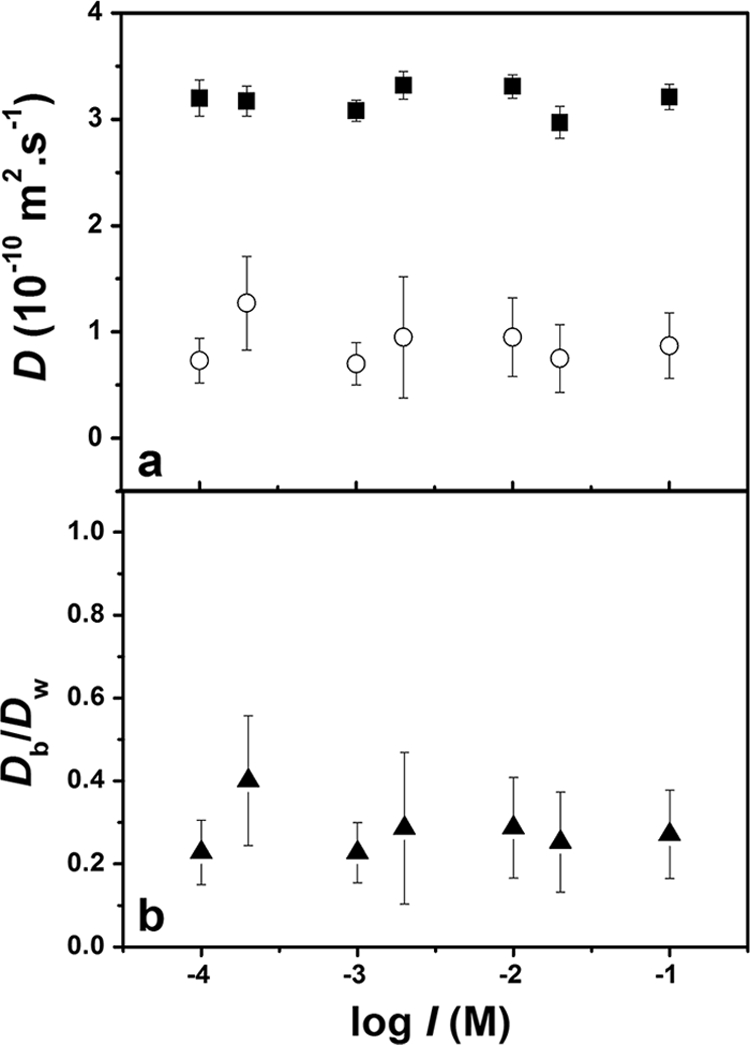
(a) Absolute diffusion coefficients of Oregon 1C in water (▪) and in S. mutans biofilms (○) as a function of ionic strength. (b) Relative diffusion coefficients of Oregon 1C as a function of ionic strength. pH = 7.2. Error bars show standard deviations.
Influence of substrate charge on diffusion in the biofilm.
Diffusion coefficients were also evaluated for a number of probes with similar structures but different overall charges (Fig. 7). In this case, the relative diffusion coefficients became smaller as the charge of the probes decreased from +1 to −2 (Fig. 7). Since biofilms of S. mutans are globally negatively charged, this suggests that increased electrostatic repulsion between the probe and the biofilm resulted in a reduced self-diffusion of the probes. Recall that FCS monitors fluorescence intensity fluctuations and that the adsorption of a probe to a stationary biofilm would be expected to increase the background fluorescence but would not be expected to significantly alter the value of the diffusion coefficient (i.e., FCS analyzes mobile fluorophores only). While the overall diffusive flux of the probe through the biofilm may decrease with increased probe adsorption, the trend of increased self-diffusion with increasing positive charge on the probe suggests that, on a molecular level, the opposite charges of the probe and the biofilm result in the positively charged probe being “pulled along” through the biofilm (or simply that there is less electrostatic “drag” compared to that affecting the anionic probes). Note that all of the probes for substrate charge had smaller sizes (<1 nm) and larger diffusion coefficients than the dextrans (Table 2). Nonetheless, the relative diffusion coefficient of the neutral probe (Db/Dw = 0.42) was smaller than those observed for the dextrans, possibly suggesting additional chemical interactions (e.g., hydrophobic interactions) of the small probes with the biofilms (22). Another reasonable explanation for the slower relative diffusion of the molecular probes could be attributed to an exclusion effect, i.e., the smaller probes get into smaller pores with a different microenvironment. Indeed, size exclusion was postulated previously (16) to have been responsible for the observation of increasing diffusion coefficients with increasing sizes of a polyethylene glycol probe in the Streptococcus mutans biofilm.
FIG. 7.

Relative diffusion coefficients of small charged molecules as a function of their charges. pH = 7.2, ionic strength = 1 mM. Inset: molecular structure of the probes (from left to right, Oregon 2C, Oregon 1C, RB, and TMRM [▪] and R6G [○]). Error bars show standard deviations.
Overall, relatively small decreases of self-diffusion were observed in the biofilms with respect to measurements made in water (the relative diffusion coefficients mainly varied between 0.17 and 0.73). Certainly, it is unlikely that a 5-fold reduction in diffusive flux could result in a 100- to 1,000-fold reduction in antibiotic effect (19). Positively charged and neutral probes had larger diffusion coefficients than negatively charged probes; however, ionic strength (charge screening of the biofilm) had little overall effect on the measured (self) diffusion coefficients. Nonetheless, measurements of mutual diffusion coefficients or diffusive fluxes may provide different insight. The overall diffusive fluxes result both from the self-diffusion of the probes and from any chemical gradients between the biofilm and the external bulk solution. Effects such as probe adsorption will decrease the overall diffusive flux, whereas increases in the local (free) concentration of the probes resulting from the negative Donnan potential of the biofilm should have the opposite effect (5, 8). Future experiments measuring overall diffusive fluxes would be highly desirable in this context.
Acknowledgments
We gratefully acknowledge the financial support of the Québec Fonds de Recherche sur la Nature et les Technologies (Team grant program) and the Natural Sciences Research Engineering Council of Canada (NSERC) Discovery Grant program.
Helpful discussions with M. Lafleur (Biophysics) and J. Barbeau (Dentistry), as well as Annie Leduc (Dentistry), were greatly appreciated.
Footnotes
Published ahead of print on 28 December 2010.
REFERENCES
- 1.Aragon, S. R., and R. Pecora. 1975. Fluorescence correlation spectroscopy as a probe of molecular dynamics. J. Chem. Phys. 64:1791-1803. [Google Scholar]
- 2.Armstrong, J. K., R. B. Wenby, H. J. Meiselman, and T. C. Fisher. 2004. The hydrodynamic radii of macromolecules and their effect on red blood cell aggregation. Biophys. J. 87:4259-4270. [DOI] [PMC free article] [PubMed] [Google Scholar]
- 3.Branda, S. S., Å. Vik, L. Friedman, and R. Kolter. 2005. Biofilms: the matrix revisited. Trends Microbiol. 13:20-26. [DOI] [PubMed] [Google Scholar]
- 4.Briandet, R., et al. 2008. Fluorescence correlation spectroscopy to study diffusion and reaction of bacteriophages inside biofilms. Appl. Environ. Microbiol. 74:2135-2143. [DOI] [PMC free article] [PubMed] [Google Scholar]
- 5.Buffle, J., K. J. Wilkinson, and H. P. van Leeuwen. 2009. Chemodynamics and bioavailability in natural waters. Environ. Sci. Technol. 43:7170-7174. [DOI] [PubMed] [Google Scholar]
- 6.Costerton, J. W., et al. 1994. Biofilms, the customized microniche. J. Bacteriol. 176:2137-2142. [DOI] [PMC free article] [PubMed] [Google Scholar]
- 7.Costerton, J. W., P. S. Stewart, and E. P. Greenberg. 1999. Bacterial biofilms: a common cause of persistent infections. Science 284:1318-1322. [DOI] [PubMed] [Google Scholar]
- 8.Davis, T. A., J. P. Pinheiro, and H. P. van Leeuwen. 2005. Measurement of Donnan potentials in gels by in situ microelectrode voltammetry. J. Electroanal. Chem. 584:100-109. [Google Scholar]
- 9.Fatin-Rouge, N., and J. Buffle. 2007. Study of environmental systems by means of fluorescence correlation spectroscopy, pp. 507-554. In K. J. Wilkinson and J. R. Lead (ed.), Environmental colloids and particles: behaviour, separation and characterisation. John Wiley and Sons, Chichester, United Kingdom.
- 10.Reference deleted.
- 11.Flemming, H.-C., T. R. Neu, and D. J. Wozniak. 2007. The EPS matrix: the “house of biofilm cells.” J. Bacteriol. 189:7945-7947. [DOI] [PMC free article] [PubMed] [Google Scholar]
- 12.Gendron, P.-O., F. Avaltroni, and K. J. Wilkinson. 2008. Diffusion coefficients of several rhodamine derivatives as determined by pulsed field gradient-nuclear magnetic resonance and fluorescence correlation spectroscopy. J. Fluoresc. 18:1093-1101. [DOI] [PubMed] [Google Scholar]
- 13.Gulot, E., et al. 2002. Heterogeneity of diffusion inside microbial biofilms determined by fluorescence correlation spectroscopy under two-photon excitation. Photochem. Photobiol. 75:570-578. [DOI] [PubMed] [Google Scholar]
- 14.Hall-Stoodley, L., J. W. Costerton, and P. Stoodley. 2004. Bacterial biofilms: from the natural environment to infectious diseases. Nat. Rev. Microbiol. 2:95-108. [DOI] [PubMed] [Google Scholar]
- 15.Lacroix-Gueu, P., R. Briandet, S. Lévêque-Fort, M.-N. Bellon-Fontaine, and M.-P. Fontaine-Aupart. 2005. In situ measurements of viral particles diffusion inside mucoid biofilms. C. R. Biol. 328:1065-1072. [DOI] [PubMed] [Google Scholar]
- 16.Marcotte, L., H. Therien-Aubin, C. Sandt, J. Barbeau, and M. Lafleur. 2004. Solute size effects on the diffusion in biofilms of Streptococcus mutans. Biofouling 20:189-201. [DOI] [PubMed] [Google Scholar]
- 17.Sandt, C., J. Barbeau, M.-A. Gagnon, and M. Lafleur. 2007. Role of the ammonium group in the diffusion of quaternary ammonium compounds in Streptococcus mutans biofilms. J. Antimicrob. Chemother. 60:1281-1287. [DOI] [PubMed] [Google Scholar]
- 18.Stewart, P. S. 2003. Diffusion in biofilms. J. Bacteriol. 185:1485-1491. [DOI] [PMC free article] [PubMed] [Google Scholar]
- 19.Stewart, P. S., and J. W. Costerton. 2001. Antibiotic resistance of bacteria in biofilms. Lancet 358:135-138. [DOI] [PubMed] [Google Scholar]
- 20.Stewart, P. S., and M. J. Franklin. 2008. Physiological heterogeneity in biofilms. Nat. Rev. Microbiol. 6:199-210. [DOI] [PubMed] [Google Scholar]
- 21.Sutherland, I. W. 2001. Biofilm exopolysaccharides: a strong and sticky framework. Microbiology 147:3-9. [DOI] [PubMed] [Google Scholar]
- 22.Takenaka, S., B. Pitts, H. M. Trivedi, and P. S. Stewart. 2009. Diffusion of macromolecules in model oral biofilms. Appl. Environ. Microbiol. 75:1750-1753. [DOI] [PMC free article] [PubMed] [Google Scholar]
- 23.Thurnheer, T., R. Gmür, S. Shapiro, and B. Guggenheim. 2003. Mass transport of macromolecules within an in vitro model of supragingival plaque. Appl. Environ. Microbiol. 69:1702-1709. [DOI] [PMC free article] [PubMed] [Google Scholar]
- 24.Wingender, J., T. R. Neu, and H.-C. Flemming. 1999. Microbial extracellular polymeric substances: characterization, structure and function. Springer, Berlin, Germany.