Abstract
Many studies have examined the evolution of bacterial mutants that are resistant to specific antibiotics, and many of these focus on concentrations at and above the MIC. Here we ask for the minimum concentration at which existing resistant mutants can outgrow sensitive wild-type strains in competition experiments at antibiotic levels significantly below the MIC, and we define a minimum selective concentration (MSC) in Escherichia coli for two antibiotics, which is near 1/5 of the MIC for ciprofloxacin and 1/20 of the MIC for tetracycline. Because of the prevalence of resistant mutants already in the human microbiome, allowable levels of antibiotics to which we are exposed should be below the MSC. Since this concentration often corresponds to low or trace levels of antibiotics, it is helpful to have simple tests to detect such trace levels. We describe a simple ultrasensitive test for detecting the presence of antibiotics and genotoxic agents. The test is based on the use of chromogenic proteins as color markers and the use of single and multiple mutants of Escherichia coli that have greatly increased sensitivity to either a wide range of antibiotics or specific antibiotics, antibiotic families, and genotoxic agents. This test can detect ciprofloxacin at 1/75 of the MIC.
The increase in drug-resistant bacteria is a major health concern, as multidrug-resistant infections have reached an alarming point (2, 17, 30). One contributor to this rise in resistant bacteria is the prevalence of antibiotics in household and farm products, as antibiotics such as fluoroquinolones are used to treat farm animals and to increase farming output (23). Much work has focused on the evolution of antibiotic resistance, including the occurrence and proliferation of mutants at different concentrations of antibiotics (e.g., see references 19 and 35). Drlica and coworkers (18, 19) have defined a mutant selection window (MSW) of concentrations at which resistant microorganisms are preferentially selected, beginning at or near the MIC and continuing up to a point where mutants cannot grow, the mutant prevention concentration (MPC). However, recent studies have shown that resistant mutants already are prevalent in the human microbiome. For instance, Sommer et al. (44) tested culturable bacteria obtained from the intestinal microflora of two individuals. On average, bacteria from individuals 1 and 2 were resistant to 9 and 5 antibiotics, respectively, of the 13 antibiotics tested. A total of 70% of the bacterial species from one individual were resistant to 10 of the 13 antibiotics tested. Continual exposure to trace amounts of antibiotics may be responsible. Cells certainly recognize such levels, as Davies and coworkers have shown that very low levels of antibiotics have signaling effects on cells, stimulating transcription from a multitude of operons (24, 51, 52). It is therefore relevant to ask, for each antibiotic, how low a concentration will still select for existing resistant mutants in competition experiments. For each antibiotic and each microorganism, we might define such a concentration in terms of a fraction of the MIC and label it the minimum selective concentration (MSC). We show here that for the two antibiotics studied, ciprofloxacin (Cip) and tetracycline (Tet), the MSC is significantly below the MIC in Escherichia coli.
The development of tests to detect residual levels of antibiotics in milk, eggs, farm soil, waste, and water is important for monitoring the levels of these compounds to which populations are exposed. For example, such tests have revealed the presence of levels of 0.7 to 124.5 ng/ml of ciprofloxacin in hospital wastewater (25). Milk is constantly screened, as the European Union requires the combined levels of two fluoroquinolones (enrofloxacin plus ciprofloxacin) in milk to be no greater than 100 ng/ml (see reference 7).
There are several types of assays for residual antibiotics, including physical chemical tests, immunological screens, biological tests, and in some cases, combinations of these. Some of these physical chemical tests, such as high-pressure liquid chromatography (HPLC) (e.g., see reference 14), liquid chromatography coupled to mass spectroscopy (14), and surface plasmon resonance (49), can detect several nanograms/milliliter of fluoroquinolones but require elaborate instrumentation and are less useful for initial determinations in rural areas or developing countries. Immunological methods can achieve a similar resolution (e.g., Charm MRL [maximum permissible residue level]) but are specific for each antibiotic class and also are expensive. Combinations of the two methods are being developed for detailed analysis, such as an alternating current impedance method combined with an immunosensor for ciprofloxacin (47). Biological tests have the advantage of often requiring much simpler methodology. Conventional tests depending on direct demonstration of growth inhibition, such as those with discs placed on a petri dish, are now being superseded by tests using different types of biosensors. A strain of Escherichia coli has been described that can detect low levels of tetracyclines by using an engineered strain with the luciferase gene under the control of a transposon tet operon that is induced by low levels of tetracyclines, but not other drugs, resulting in an increase in luminescence (27). On the other hand, luminescent engineered E. coli strains have been used to detect antibiotics by measuring the inhibition of luminescence (48). In both cases, one needs a series of measurements with a luminometer.
Bioassays that rely on simple color observation are the easiest to use by a wide group of users, as evidenced by the commercial use of the Delvotest (Gist-brocades/DSM), which makes use of spore-forming bacteria (Bacillus stearothermophilus) to generate a color change after growing in the presence of chromogenic dyes. The sensitivities of the test vary with the antibiotic being assayed. In milk, sensitivities range from 2 to 57 ng/g (or ml) for β-lactams, 434 to 1,140 ng/g for tetracyclines, 66 to 353 ng/g for sulfonamides, 23 to 2,482 ng/g for macrolides, 200 to 6,180 ng/g for aminoglycosides, and 2,730 to 3,750 ng/g for the fluoroquinolones ciprofloxacin and enrofloxacin (29, 41, 42). The detection levels in a similar test are considerably lower in animal food products following extraction by chemical methods (45). Ashwin and coworkers have reported an updated test for fluoroquinolone and quinolone residues in foods based on a chemical extraction procedure followed by a microbial inhibition assay (7). This test has a detection limit of 2.5 ng/g for ciprofloxacin and 10 ng/g for enrofloxacin. The focal point of the work described here is to ultimately develop a simple color test with more sensitivity than the Delvotest and other tests like it. The test outlined below is based on the difference in growth between two chromogenic strains, with one having greatly increased sensitivity to antibiotics compared to that of the wild-type counterpart strain. The degree of sensitivity and the specificity of the sensitivity can be designed into the test.
Green fluorescent protein (GFP) and members of its family have expanding usage in molecular biology and biotechnology (e.g., see reference 28), particularly those from a jellyfish, Aequorea victoria. GFP does not need external factors, except for molecular oxygen, to synthesize their chromophore (28, 54). GFP-like proteins from anthozoans, such as corals and zoanthids, also result in visible or fluorescent colors, ranging from purple-blue (see references 28 and 33 and references therein) to yellow and red (34). We have employed two of these proteins, amilCP with purple-blue color and amilGFP (3), as indicators for a chromogenic test.
MATERIALS AND METHODS
Bacterial strains.
The strains used are listed in Table 1. All strain backgrounds used for competition experiments are derived from strain J93 (22) and its I− Lac+ derivative, J93140. J93 carries a deletion of the lac genes (deletion RV) and appears to be the wild type for all other markers. J93140 was constructed by P1 transduction using strain CSH140 (36) as a donor. A ciprofloxacin-resistant (Cipr) derivative of J93140 (J93140C) was isolated by plating a sample of an overnight culture on LB plates with 50 ng/ml Cip. Resistant colonies were seen with a frequency of 10−8 or less. Purified resistant colonies were analyzed by PCR amplification of the gyrA gene and DNA sequencing of gyrA. The resistant mutant used for further experiments carried a mutation in gyrA that resulted in a SER → LEU change at coding position 83. A tetracycline-resistant (Tetr) derivative of strain J93140 was prepared by P1 transduction with lysates derived from the LacZ− strain CC107 (15) carrying the linked insert zah-281::Tn10 from strain CAG12049 (43). The resulting strain, J93140TZ, is LacZ− Tetr. For color test experiments, the starting strain from the Keio collection (8), BW25113 (16), was used. Single- and double-gene-knockout derivatives of this strain were also used. The tolC derivative of BW25113 is from the Keio collection (8) and carries a kan replacement of tolC. The tolC recC double mutant (46) carries a tet insert in recC (recC1010) derived from strain CGSC6727, courtesy of the E. coli Genetic Stock Center. The BW25113 derivatives carrying a kan replacement in recO or recG (8) were used to generate the recO uvrA or recG uvrA double mutant by transducing a tet insert in uvrA from strain N3055, a gift from Graham Walker. BW25113, designated the wild-type starting strain, was transformed with pGEM-T-11, and the mutant derivatives were transformed with pGEM-T-14, derivatives of pGEM-T (Promega) carrying the genes for the yellow and purple fluorescent and chromogenic proteins, respectively.
TABLE 1.
Bacterial strainsa
| Strain background | Genotype | Plasmid | Relevant phenotype | Reference |
|---|---|---|---|---|
| J93 | Δ(lac)RV | Lac− Cips | 22 | |
| J93140 | lacI | Lac+ Cips Tets | This work | |
| J93140C | lacI gyrA | Lac+ Cipr | This work | |
| J93140TZ | lacI lacZ zah-281::Tn10 | Lac− Tetr | This work | |
| BW25113 | Δ(araD-araB)567 ΔlacZ4787(::rrnB-3) rph-1 Δ(rhaD-rhaB)568 hsdR514 | 16 | ||
| pGEM-T-11 | This work | |||
| pGEM-T-14 | This work | |||
| JW5503-1 | BW25113 ΔtolC732::kan | pGEM-T-14 | This work | |
| BW25113 recC1010::Tn10 ΔtolC732::kan | pGEM-T-14 | This work | ||
| JW3627-1 | BW25113 ΔrecG756::kan uvrA::Tn10 | pGEM-T-14 | This work | |
| JW2549-1 | BW25113 ΔrecO737::kan uvrA::Tn10 | pGEM-T-14 | This work |
For further details, see Materials and Methods.
Competition tests.
For competition experiments, the pair J93 and J93140C was used for the experiments shown in Fig. 1 and 2, and the pair J93140 and J93140TZ was used for the experiments shown in Fig. 3 (see Results). Typically, a starting mix was diluted into LB medium with and without antibiotics, and approximately 2 × 10⁴ cells were added to 2 ml of medium in 16-mm test tubes and grown overnight in a 37°C incubator without shaking, reaching a density of approximately 4 × 10⁸ cells/ml. They were subsequently diluted and grown overnight again (approximately an additional 15 generations). This was repeated several times. Parallel cultures were monitored, and the experiments were repeated several times. Colonies were plated onto LB medium containing 40 μg/ml X-Gal (5-bromo-4-chloro-3-indolyl-β-d-galactopyranoside) (see reference 36), and several hundred were typically scored for each culture at each time point.
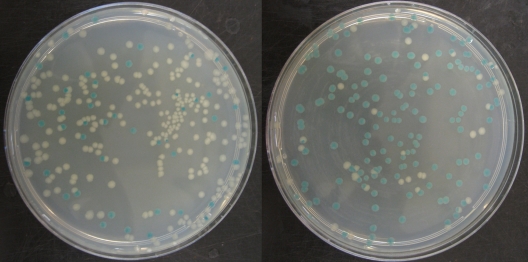
FIG. 1.
Scoring resistant mutants by colony color. Strains J93 (Lac− Cips) and J93140C (Lac+ Cipr) were grown for 25 generations in LB medium (left) and LB medium containing Cip at <1/5 of the MIC (right). Cips colonies are white (Lac−), and Cipr colonies are blue (Lac+).
Determination of MIC.
MICs were determined according to the method of Andrews (6), except that LB medium was used. An inoculum of 105 cells was added to a series of tubes with 1 ml medium with different concentrations of antibiotic. After 18 to 20 h of growth in an incubator at 37°C, the tubes were scored.
Color tests.
Mixtures were grown overnight in LB medium with 100 μg/ml ampicillin (to maintain the plasmid) in a rotor at 37°C at 60 rpm.
RESULTS
Competition experiments.
We constructed isogenic Lac+ and Lac− E. coli strain pairs and their ciprofloxacin-resistant (Cipr) or tetracycline-resistant (Tetr) derivatives. This enabled us to monitor the percentage of antibiotic-resistant cells in a culture at any point by plating on medium with X-Gal and scoring the white (Lac−) and blue (Lac+) colonies. Figure 1 shows an example of this using a Lac− Cips (ciprofloxacin-sensitive) strain (white) and a Lac+ Cipr derivative (blue) mixed together in a ratio of white/blue of between 5:1 and 10:1 and grown in LB medium (Fig. 1A) or LB medium plus Cip at less than one-fifth of the MIC for approximately 25 generations (Fig. 1B). It can be seen that the percentage of blue colonies greatly increases in response to the presence of low levels of Cip.
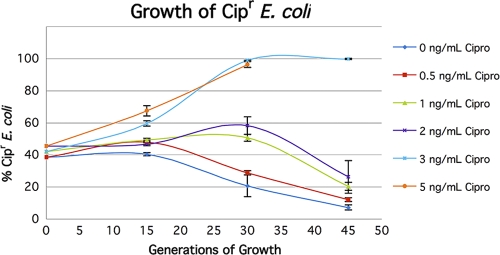
In order to quantitate these effects more precisely, we grew parallel cultures at different concentrations of Cip and Tet for a different set of isogenic strains (see Materials and Methods). Figure 2 shows the results for Cip, and Fig. 3 shows the results for Tet. It can be seen that in the absence of Cip, the Lac+ Cipr strain has a growth disadvantage that starts to manifest itself after 15 to 30 generations. Although this is in part due to the Lac+ phenotype, a major part is due to the presence of the mutation conferring resistance to Cip. The resistant mutant was selected spontaneously (see Materials and Methods), and DNA sequencing showed that the respective mutation results in a SER → LEU change at position 83 in the gyrA gene, a mutation that has been found and characterized previously (9, 46). In the strain background used here, this mutation changes the MIC from 16 ng/ml to 350 ng/ml. The effect on growth rates of this allele has been noted previously (9). Because of this effect, low levels of Cip need to overcome the selection in the opposite direction. Although concentrations as low as 1 ng/ml and 2 ng/ml give transient effects (Fig. 2), concentrations of 3 ng/ml (3/16 of the MIC) and higher overcome the reverse selection and allow the resistant cells to completely overtake the population.
FIG. 2.
Competition experiments between Cips and Cipr strains. Strains J93 (Lac− Cips) and J93140C (Lac+ Cipr) were grown together in LB medium with different concentrations of Cip, and parallel cultures were scored at intervals.
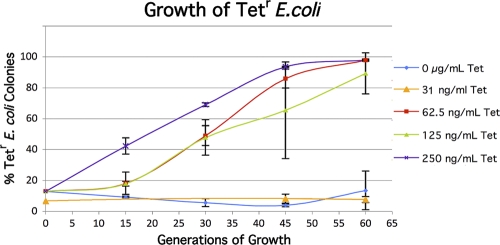
FIG. 3.
Competition experiments between tetracycline-sensitive (Tets) and Tetr strains. Cultures of J93140 (Lac+ Tets) and J93140TZ (Lac− Tetr) were grown together in LB medium with different concentrations of Tet, and parallel cultures were scored at intervals. The 31-ng/ml data series was obtained from a different starting mix, which is why the zero time point is slightly different than those of the other concentrations.
The strains used to monitor the change in the percentage of Tetr cells show much smaller changes in competition experiments in the absence of Tet, allowing one to show that concentrations representing 1/20 of the MIC still strongly select for resistant cells in the population (Fig. 3). The variation in parallel cultures does not prevent one from discerning a clear trend. Repeated experiments show a large effect at 62.5 ng/ml Tet but not at 31.25 ng/ml Tet. The MIC for Tet for the strain used is 1,250 ng/ml.
Construction and use of strains expressing chromogenic proteins.
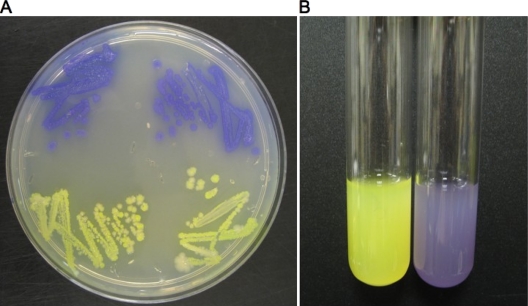
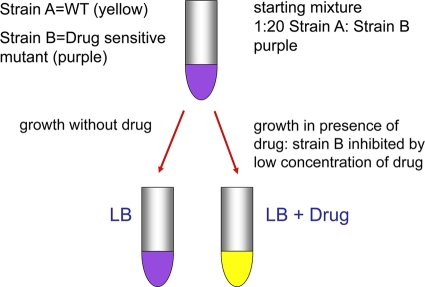
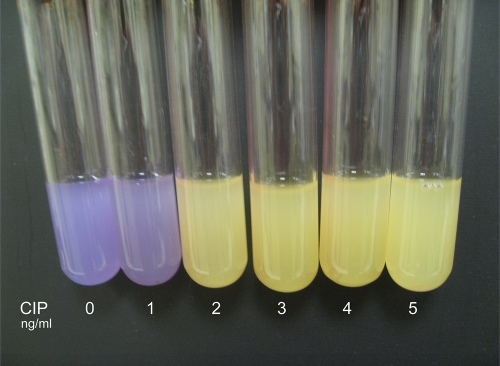
We engineered strains carrying plasmids encoding some of the newer fluorescent and colored proteins and have used these together with Escherichia coli strains carrying gene knockouts that render them more sensitive to one or more antibiotics. The resulting test is a prototype that provides proof of concept for more refined and improved tests. The principle of the test is as follows. Two strains are used together, a wild-type strain and a mutant that is more sensitive than the wild type to a particular antibiotic. Each strain carries a different fluorescent/colored protein. Figure 4 shows the Escherichia coli strains we have used for this test. In Fig. 4A, colonies of E. coli carrying the plasmid pGEM-T (Promega) encoding either the protein that turns bright yellow in growing cultures or a purple-colored protein (see Materials and Methods). Figure 4B shows the strains in culture. The wild-type strain carries the plasmid encoding the yellow protein, and the mutant strain carries the same plasmid but encoding the purple protein. Figure 5 shows the concept of the test. We engineered the wild-type strain to synthesize the yellow protein and a mutant with a defect in the key efflux system (because of a deletion of the tolC gene) to synthesize the purple protein. The latter strain is more sensitive to various antibiotics than the wild type. The two strains are mixed together with a ratio of mutant (purple)/wild type (yellow) of more than 20:1. This is to allow the mixture, when grown in broth without an antibiotic, to be purple, since the small amount of yellow wild type does not quench the purple color to a significant degree. However, when grown in broth containing an antibiotic to which the tolC mutant is more sensitive than the wild type and at a concentration that is subinhibitory to the wild type, the mutant is inhibited. Even if the inhibition is not complete, the wild type will outgrow the mutant during the time course of the test. Figure 6 shows the results of seeding a set of broth cultures with the same mixture of the wild type and mutant, with each tube containing concentrations of ciprofloxacin (Cip) ranging from 0 to 5 ng/ml. The tube on the far left contains broth with no Cip, the second tube 1 ng/ml Cip, and the third, fourth, fifth and sixth tubes 2, 3, 4, and 5 ng/ml Cip, respectively. It can be seen that at 0 and 1 ng/ml Cip, the tubes remain purple, since neither the wild type or the mutant are preferentially inhibited. However, already at 2 ng/ml Cip, one can see that the cultures turn bright yellow, because even at this concentration, only the tolC mutant is inhibited since it is 1 order of magnitude more sensitive than the wild type. The MIC for the wild type used here is between 16 and 20 ng/ml Cip.
FIG. 4.
Chromogenic proteins. Colonies and cultures of BW25113 carrying pGEM-T-11 or pGEM-T-14 are yellow or purple, respectively.
FIG. 5.
Concept of color test for detection of antibiotics and genotoxic agents. WT, wild type.
FIG. 6.
Color test for Cip. The color test depicted here includes a mixture of the wild type (yellow) and a tolC derivative (purple) grown in LB medium with the indicated concentrations of Cip.
The effects are not specific for Cip, since the mutant used is more sensitive to a battery of different antibiotics (32, 46). We applied the same test to tetracycline (Tet), fusidic acid (Fus), and erythromycin (Ery). The results are shown in Table 2. This test detects 50 ng/ml Tet, 500 ng/ml Fus, and between 625 and 1,250 ng/ml Ery.
TABLE 2.
Detection limits for Tet, Fus, and Erya
| Drug | Detection level(s) (ng/ml) | WT MIC (ng/ml) |
|---|---|---|
| Tet | 50 | 2.5 × 10³ |
| Fus | 500 | 3 × 10⁵ |
| Ery | 625-1,250 | 1.5 × 10⁵ |
The mutant genotype for Tet, Fus, and Ery is ΔtolC. WT, wild type.
Engineering hypersensitive strains with multiple mutants.
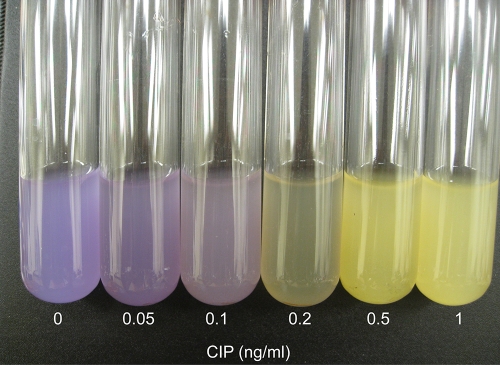
We have shown in recent work (46) that combining gene knockouts that affect sensitivity to an antibiotic via different pathways can result in a strain that is more sensitive than strains resulting from either single knockout. Therefore, to increase the sensitivity of the chromogenic test, we used a double knockout with deletions of both the tolC gene and the recC gene, since our experiments have shown that while tolC or recC alone reduce the MIC for Cip from 16 ng/ml to 2 to 4 ng/ml, the double mutant displayed a MIC of 0.3 ng/ml (46). Figure 7 shows the results of using this strain with the yellow chromogenic marker in place of the single tolC mutant used in Fig. 4 and 6. Here, the concentrations of Cip, reading from the left, are 0, 0.05, 0.1, 0.2, 0.5, and 1 ng/ml. Clearly, one can detect a significant reaction at 0.2 ng (200 pg)/ml.
FIG. 7.
Color test for Cip. The same test described in the legend to Fig. 6 but with a tolC recC derivative used in the mixture with the wild type.
We can use different combinations of sensitive mutations to target not only different antibiotics but also genotoxic agents. We found that strains carrying the double mutant uvrA recO are hypersensitive to the antibiotic and DNA-damaging agent nitrofurantoin (NIT) (10) and that strains with the double mutant uvrA recG are hypersensitive to the antitumor DNA cross-linking agent cisplatin (CPT) (10). We therefore transformed the plasmid (pGEM14) carrying the gene conferring the purple color phenotype into these double mutant strains and demonstrated that they can be incorporated into the same test. Table 3 shows the results. One can detect levels of NIT at 100 ng/ml, 1/20 of the MIC, and of CPT at 25 μg/ml, 1/4 of the MIC.
TABLE 3.
Detection limits for CPT and NITa
| Drug | Detection level (μg/ml) | WT MIC (μg/ml) |
|---|---|---|
| CPT | 25 | 100 |
| NIT | 0.1 | 2 |
The mutant genotype for both CPT and NIT is ΔrecG::kan uvrA::tet. WT, wild type.
Plate test.
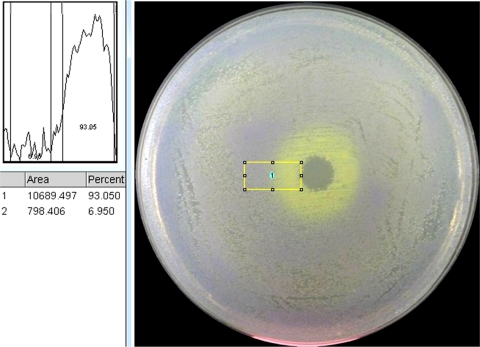
We have also developed a plate version of this test that can be used to screen for compounds that specifically inhibit one strain or mutant with respect to a second strain. Using the same principle as shown in Fig. 5, a mixture of two colored strains (here, a 50:1 ratio of sensitive purple to less-sensitive yellow) with different susceptibilities to a given antibiotic will generate a lawn on an LB plate with the color of the majority, in this case, purple. An antibiotic applied to the plate as a drop or disc when the cells are first plated will generate a clearing of the resulting lawn at the point of application, as the concentration is high enough to kill both strains. As the antibiotic diffuses, a concentration gradient occurs, such that at low concentrations at the outer edges of the plate, the cells grow normally and are purple. However, at some point, the concentration of the antibiotic is high enough for the mutant strain to be sensitive but not high enough to inhibit the wild type, so in this range, the cells that grow generate yellow colonies. The net result is a ring of yellow surrounded by a lawn of purple. Figure 8 shows this for Cip applied to the center of a plate spread with a mixture of wild-type cells (purple) and tolC recC cells (yellow). In the example shown here, a drop of a solution with 1,000 ng/ml Cip was used, although the detection limit for this test is at or below 20 ng/ml Cip. Additionally, the photograph of this plate (using a Canon 8.1-megapixel camera) was subjected to density analysis using ImageJ software (http://rsbweb.nih.gov/ij/), which illustrated an ∼87% difference in grayscale intensity between the inner yellow ring and the rest of the plate (Fig. 8).
FIG. 8.
Plate test. A mixture of the wild type (yellow) and a tolC recC derivative (purple) is spread on an LB plate, and a drop of a solution containing an antibiotic, in this case, Cip, is applied. See the text for details. The photograph (using a Canon 8.1-megapixel camera) was subjected to density analysis, which illustrated an ∼87% difference in grayscale intensity between the inner yellow ring and the rest of the plate.
DISCUSSION
The proliferation of multidrug-resistant pathogens is a major problem in public health. More people in the United States die each year from MRSA (methicillin-resistant Staphylococcus aureus) than from AIDS, according to data from 2006 (11, 12). The exposure to low levels of antibiotics is one of several causes of the spread of resistant microorganisms (30). Studies have shown that trace levels of antibiotics can activate transcription of numerous operons in bacteria (24, 51, 52). Examination of the human intestinal microbiome reveals a reservoir of microorganisms that are resistant to many of the antibiotics in use (44). Here we use competition tests between wild-type and resistant strains of E. coli to show that low levels of Cip (<1/5 of the MIC) or Tet (1/20 of the MIC) select for the outgrowth of resistant cells, underscoring the need to reduce the exposure to even very low levels of antibiotics. Some alleles, such as those conferring resistance to Cip, result in a loss of fitness relative to that of the wild type in the absence of antibiotic (0 ng/ml Cip) (Fig. 2) (see also reference 4), a phenomenon that has been well documented (e.g., see references 4, 5, 20, 26, 38, and 39). This underscores the value of reducing the exposure to antibiotics. Studies have shown that lowering the amount of antibiotics given to farm animals results in a measurable reduction in antibiotic-resistant microorganisms (1).
We also present a simple test that does not require expensive equipment to monitor the levels of different antibiotics. This test is already significantly more sensitive for Cip than many of the simpler tests, such as the Delvotest, the Copan milk test, the Brilliant black reduction test, the Eclipse 100 test, and the blue-yellow test (31, 41). Future work will be aimed at increasing the sensitivity of the test even further by different strategies, such as examining targeted triple mutants that lack three different functions involved in intrinsic resistance (e.g., repair, efflux, and protein synthesis functions) that we have identified in a recent study (32), using a synergistic codrug, such as an aminoglycoside in the case of Cip (see reference 50), or measuring the fluorescence of the respective marked strains. (Chait and coworkers have used fluorescence in a differential plate assay for compounds that select against antibiotic resistance [13]). It is possible to engineer combinations of mutations that yield specific sensitivities or resistance to different antibiotics, and we have done this for the DNA-damaging agents nitrofurantoin (NIT) and cisplatin (CPT) (Table 3). Methods for markerless deletion construction (8, 21, 53) could be used to convert these strains to derivatives lacking the antibiotic resistance markers that are associated with each deletion mutation. One might construct nonplasmid versions of the tester strains by moving the gene encoding the chromogenic proteins from the plasmid to the chromosome by techniques that have been developed for this precise purpose (37, 40).
Acknowledgments
This work was supported by a grant from the National Institutes of Health (ES0110875).
Footnotes
Published ahead of print on 3 January 2011.
REFERENCES
- 1.Aarestrup, F. M., et al. 2001. Effect of abolishment of the use of antimicrobial agents for growth promotion on occurrence of antimicrobial resistance in fecal enterococci from food animals in Denmark. Antimicrob. Agents Chemother. 45:2054-2059. [DOI] [PMC free article] [PubMed] [Google Scholar]
- 2.Alekshun, M. N., and S. B. Levy. 2007. Molecular mechanisms of antibacterial multidrug resistance. Cell 128:1037-1050. [DOI] [PubMed] [Google Scholar]
- 3.Alieva, N. O., et al. 2008. Diversity and evolution of coral fluorescent proteins. PLoS One 3:e2680. [DOI] [PMC free article] [PubMed] [Google Scholar]
- 4.Andersson, D. I. 2003. Persistence of antibiotic resistant bacteria. Curr. Opin. Microbiol. 6:452-456. [DOI] [PubMed] [Google Scholar]
- 5.Andersson, D. I., and B. R. Levin. 1999. The biological cost of antibiotic resistance. Curr. Opin. Microbiol. 2:489-493. [DOI] [PubMed] [Google Scholar]
- 6.Andrews, J. M. 2002. Determination of minimum inhibitory concentrations. Antimicrob. Agents Chemother. 48:5-16. [DOI] [PubMed] [Google Scholar]
- 7.Ashwin, H., et al. 2009. A rapid microbial inhibition-based screening strategy for fluoroquinolone and quinolone residues in foods of animal origin. Anal. Chim. Acta 637:241-246. [DOI] [PubMed] [Google Scholar]
- 8.Baba, T., et al. 2006. Construction of Escherichia coli K-12 in-frame single-gene knockout mutants: the Keio collection. Mol. Sys. Biol. 2:2006.0008. [DOI] [PMC free article] [PubMed] [Google Scholar]
- 9.Bagel, S., V. Hullen, B. Wiedemann, and P. Heisig. 1999. Impact of gyrA and parC mutations on quinolone resistance, doubling time, and supercoiling degree of Escherichia coli. Antimicrob. Agents Chemother. 43:868-875. [DOI] [PMC free article] [PubMed] [Google Scholar]
- 10.Becket, E., F. Chen, C. Tamae, and J. H. Miller. 2010. Determination of hypersensitivity to genotoxic agents among Escherichia coli single gene knockout mutants. DNA Repair 9:949-957. [DOI] [PMC free article] [PubMed] [Google Scholar]
- 11.CDC. 2006. Centers for Disease Control and Prevention Active Emerging Infections Program Network, methicillin-resistant Staphylococcus aureus. CDC, Atlanta, GA.
- 12.CDC. 2006. Centers for Disease Control and Prevention HIV/AIDS surveillance report, vol. 18. CDC, Atlanta, GA.
- 13.Chait, R., S. Shrestha, A. Shah, J.-B. Michel, and R. Kishony. 2010. A differential drug screen for compounds that select against antibiotic resistance. PLoS One 5:e15179. [DOI] [PMC free article] [PubMed] [Google Scholar]
- 14.Christodoulou, E. A., V. F. Samanidou, and I. N. Papadoyannis. 2008. Development of an HPLC multi-residue method for the determination of ten quinolones in bovine liver and porcine kidney according to the European Union Decision 2002/657/EC. J. Sep. Sci. 31:119-127. [DOI] [PubMed] [Google Scholar]
- 15.Cupples, C. G., M. Cabrera, C. Cruz, and J. H. Miller. 1990. A set of lacZ mutations in Escherichia coli that allow rapid detection of specific frameshift mutations. Genetics 125:275-280. [DOI] [PMC free article] [PubMed] [Google Scholar]
- 16.Datsenko, K. A., and B. L. Wanner. 2000. One-step inactivation of chromosomal genes in Escherichia coli K-12 using PCR products. Proc. Natl. Acad. Sci. U. S. A. 97:6640-6645. [DOI] [PMC free article] [PubMed] [Google Scholar]
- 17.Davies, J. 2007. Microbes have the last word. EMBO Rep. 8:616-621. [DOI] [PMC free article] [PubMed] [Google Scholar]
- 18.Dong, Y. Z., X. L. Zhao, J. Domagala, and K. Drlica. 1999. Effect of fluoroquinolone concentration on selection of resistant mutants of Mycobacterium bovis BCS and Staphylococcus aureus. Antimicrob. Agents Chemother. 43:1756-1758. [DOI] [PMC free article] [PubMed] [Google Scholar]
- 19.Drlica, K. 2003. The mutant selection window and antimicrobial resistance. J. Antimicrob. Chemother. 52:11-17. [DOI] [PubMed] [Google Scholar]
- 20.Enne, V. I., et al. 2005. Assessment of the fitness impacts on Escherichia coli on acquisition of antibiotic resistance genes encoded by different types of genetic element. J. Antimicrob. Chemother. 56:544-551. [DOI] [PubMed] [Google Scholar]
- 21.Feher, T., et al. 2008. Scarless engineering of the Escherichia coli genome. Methods Mol. Biol. 416:251-259. [DOI] [PubMed] [Google Scholar]
- 22.Funchain, P., et al. 2000. The consequences of growth of a mutator strain of Escherichia coli as measured by loss of function among multiple gene targets and loss of fitness. Genetics 154:959-970. [DOI] [PMC free article] [PubMed] [Google Scholar]
- 23.Gendrel, D., M. Chalumeau, F. Moulin, and J. Raymond. 2003. Fluoroquinolones in pediatrics: a risk for the patient or for the community? Lancet Infect. Dis. 3:537-546. [DOI] [PubMed] [Google Scholar]
- 24.Goh, E., et al. 2002. Transcriptional modulation of bacterial gene expression by subinhibitory concentrations of antibiotics. Proc. Natl. Acad. Sci. U. S. A. 99:17025-17030. [DOI] [PMC free article] [PubMed] [Google Scholar]
- 25.Hartmann, A., et al. 1999. Primary DNA damage but not mutagenicity correlates with ciprofloxacin concentrations in German hospital wastewaters. Arch. Environ. Contam. Toxicol. 36:115-119. [DOI] [PubMed] [Google Scholar]
- 26.Kishony, R., and S. Liebler. 2003. Environmental stresses can alleviate the average deleterious effect of mutations. J. Biol. 2:14-23. [DOI] [PMC free article] [PubMed] [Google Scholar]
- 27.Korpela, M. T., J. S. Kurittu, J. T. Karvinen, and M. T. Karp. 1998. A recombinant Escherichia coli sensor strain for the detection of tetracyclines. Anal. Chem. 70:4457-4462. [DOI] [PubMed] [Google Scholar]
- 28.Labas, Y. A., et al. 2002. Diversity and evolution of the green fluorescent protein family. Proc. Natl. Acad. Sci. U. S. A. 99:4256-4261. [DOI] [PMC free article] [PubMed] [Google Scholar]
- 29.Le Breton, M.-H., M.-C. Savoy-Perroud, and Jean-Marc Diserens. 2007. Validation and comparison of the Copan Milk Test and Delvotest SP-NT for the detection of antimicrobials in milk. Anal. Chim. Acta 586:280-283. [DOI] [PubMed] [Google Scholar]
- 30.Levy, S. B., and B. Marshall. 2004. Antibacterial resistance worldwide: causes, challenges and responses. Nat. Med. 10:S122-S129. [DOI] [PubMed] [Google Scholar]
- 31.Linage, B., et al. 2007. Performance of blue-yellow screening test for antimicrobial detection in ovine milk. J. Dairy Sci. 90:5374-5379. [DOI] [PubMed] [Google Scholar]
- 32.Liu, A., et al. 2010. Antibiotic sensitivity profiles determined with an Escherichia coli gene knockout collection: generating an antibiotic bar code. Antimicrob. Agents Chemother. 54:1393-1403. [DOI] [PMC free article] [PubMed] [Google Scholar]
- 33.Lukyanov, K. A., et al. 2000. Natural animal coloration can be determined by a nonfluorescent green fluorescent protein homolog. J. Biol. Chem. 275:25879-25882. [DOI] [PubMed] [Google Scholar]
- 34.Matz, M. V., et al. 1999. Fluorescent proteins from nonbioluminescent Anthozoa species. Nat. Biotechnol. 17:969-973. [DOI] [PubMed] [Google Scholar]
- 35.Michel, J.-B., P. J. Yeh, R. Chait, R. C. Moellering, Jr., and R. Kishony. 2008. Drug interactions modulate the potential for evolution of resistance. Proc. Natl. Acad. Sci. U. S. A. 105:14918-14923. [DOI] [PMC free article] [PubMed] [Google Scholar]
- 36.Miller, J. H. 1992. A short course in bacterial genetics: a laboratory manual and handbook for Escherichia coli and related bacteria. Cold Spring Harbor Laboratory Press, Cold Spring Harbor, NY.
- 37.Morris, D. D., et al. 1998. Cloning of the xynB gene from Dictyoglomus thermophilum Rt46B.1 and action of the gene product on kraft pulp. Appl. Environ. Microbiol. 64:1759-1765. [DOI] [PMC free article] [PubMed] [Google Scholar]
- 38.Paulander, W., S. Maisner-Patin, and D. I. Andersson. 2009. The fitness cost of streptomycin resistance depends on rpsL mutation, carbon source, and RpoS (σs). Genetics 183:539-546. [DOI] [PMC free article] [PubMed] [Google Scholar]
- 39.Petersen, A., F. M. Aarestrup, and J. E. Olsen. 2010. The in vitro fitness cost of antimicrobial resistance in Escherichia coli varies with the growth conditions. FEMS Microbiol. Lett. 299:53-59. [DOI] [PubMed] [Google Scholar]
- 40.Pinheiro, L. B., M. D. Gibbs, G. Vesey, J. J. Smith, and P. L. Bergquist. 2008. Fluorescent reference strains of bacteria by chromosomal integration of a modified green fluorescent protein gene. Appl. Microbiol. Biotechnol. 77:1287-1295. [DOI] [PubMed] [Google Scholar]
- 41.Sierra, D., et al. 2009. Detection limits of non-β-lactam antibiotics in goat's milk by microbiological residues screening tests. J. Dairy Sci. 92:4200-4206. [DOI] [PubMed] [Google Scholar]
- 42.Sierra, D., et al. 2009. Detection limits of four antimicrobial residue screening tests for β-lactams in goat's milk. J. Dairy Sci. 92:3585-3591. [DOI] [PubMed] [Google Scholar]
- 43.Singer, M., et al. 1989. A collection of strains containing genetically linked alternating antibiotic resistance elements for genetic mapping of Escherichia coli. Microbiol. Rev. 53:1-24. [DOI] [PMC free article] [PubMed] [Google Scholar]
- 44.Sommer, M. O. A., G. Dantas, and G. M. Church. 2009. Functional characterization of the antibiotic resistance reservoir in the human microflora. Science 325:1128-1131. [DOI] [PMC free article] [PubMed] [Google Scholar]
- 45.Stead, S., et al. 2004. Meeting maximum residue limits: an improved screening technique for the rapid detection of antimicrobial residues in animal food products. Food Addit. Contam. 21:216-221. [DOI] [PubMed] [Google Scholar]
- 46.Tamae, C., et al. 2008. Determination of antibiotic hypersensitivity among 4,000 single gene knockout mutants of Escherichia coli. J. Bacteriol. 190:5981-5988. [DOI] [PMC free article] [PubMed] [Google Scholar]
- 47.Tsekenis, G., et al. 2008. Detection of fluoroquinolone antibiotics in milk via a labeless immunoassay based upon an alternating current impedance protocol. Anal. Chem. 80:9233-9239. [DOI] [PubMed] [Google Scholar]
- 48.Vlasova, I. I., T. V. Asrieli, E. M. Gavrilova, and V. S. Danilov. 2004. New approach for specific determination of antibiotics by use of luminescent Escherichia coli and immune serum. Appl. Environ. Microbiol. 70:1245-1248. [DOI] [PMC free article] [PubMed] [Google Scholar]
- 49.Xiao, Y., H. Chang, A. Jia, and J. Hu. 2008. Trace analysis of quinolone and fluoroquinolone antibiotics from wastewaters by liquid chromatography-electrospray tandem mass spectrometry. J. Chromatogr. A 1214:100-108. [DOI] [PubMed] [Google Scholar]
- 50.Yeh, P., A. I. Tschumi, and R. Kishony. 2006. Functional classification of drugs by properties of their pairwise interactions. Nat. Genet. 28:489-494. [DOI] [PubMed] [Google Scholar]
- 51.Yim, G., F. de la Cruz, G. B. Spiegelman, and J. Davies. 2006. Transcription modulation of Salmonella enterica serovar Typhimurium promoters by sub-MIC levels of rifampin. J. Bacteriol. 188:7988-7991. [DOI] [PMC free article] [PubMed] [Google Scholar]
- 52.Yim, G., H. H. Wang, and J. Davies. 2007. Antibiotics as signaling molecules. Philos. Trans. R. Soc. Lond. B Biol. Sci. 362:1195-1200. [DOI] [PMC free article] [PubMed] [Google Scholar]
- 53.Yu, B. J., et al. 2008. Rapid and efficient construction of markerless deletions in the Escherichia coli genome. Nucleic Acids Res. 36:e84. [DOI] [PMC free article] [PubMed] [Google Scholar]
- 54.Zagranichny, V. E., et al. 2004. szFP538, a yellow fluorescent protein from coral, belongs to the DsRed subfamily of GFP-like proteins but possesses the unexpected site of fragmentation. Biochemistry 43:4764-4772. [DOI] [PubMed] [Google Scholar]


