Abstract
Salmonella enterica serovar Typhimurium was grown at salt concentrations ranging from 0.5 to 7.5% in minimal medium with and without added osmoprotectant and in a rich medium. In minimal medium, the cells showed an initial decline period, and consequently the definition of the lag time of the resultant log count curve was revised. The model of Baranyi and Roberts (Int. J. Food Microbiol. 23:277-294, 1994) was modified to take into account the initial decline period, based on the assumption that the log count curve of the total population was the sum of a dying and a surviving-then-growing subpopulation. The lag time was defined as the lag of the surviving subpopulation. It was modeled by means of a parameter quantifying the biochemical work the surviving cells carry out during this phase, the “work to be done.” The logarithms of the maximum specific growth rates as a function of the water activity in the three media differed only by additive constants, which gave a theoretical basis for bias factors characterizing the relationships between different media. Models for the lag and the “work to be done” as a function of the water activity showed similar properties, but in rich medium above 5% salt concentrations, the data showed a maximum for this work. An accurate description of the lag time is important to avoid food wastage, which is an issue of increasing significance in the food industry, while maintaining food safety standards.
Salmonella enterica causes severe enteritis in both humans and animals (19, 25). Human infection usually results from eating contaminated food, such as poultry, milk, beef, eggs, pork, and seafood (13); consequently, monitoring and control of contamination by Salmonella are necessary and important in the food industry.
One way of controlling Salmonella in food is to add salt to decrease the water activity and inhibit microbial growth. However, the effect of salt highly depends on the presence of osmoprotectants, which have been shown to affect the growth rate (7). The immediate response of cells to osmotic stress is to accumulate K+ and glutamine to maintain a viable turgor of the cell. These potentially harmful substrates are then replaced by compatible solutes, such as proline, trehalose, and glycine betaine, to stimulate growth (11). The compatible solutes either can be taken up from the growth medium if available or, if none are present, need to be synthesized de novo by the cell. Betaine (also known as glycine betaine or trimethylglycine) is one of the most common and effective osmolytes utilized by Salmonella spp. Although betaine cannot be synthesized by Salmonella enterica serovar Typhimurium, it can be transported from the growth medium under high external osmolality conditions (8). In the absence of osmoprotectants in the environment, trehalose is thought to be the main osmoprotectant synthesized by Escherichia coli and Salmonella.
Predictive microbiology has become a main tool to describe the growth of microorganisms in recent years. Predictive models concentrate mainly on the specific growth rate of the organisms, while it is still difficult to predict lag times (4). The initial decrease in cell numbers in an unfavorable environment can lead to too conservative predictions for the lag time and consequently for the overall growth. To decrease food waste, while controlling food safety problems, it is vital to study recovery and growth during lag, especially close to the growth/no-growth interface of environmental factors, which is becoming an increasingly important focus of food safety research. So far the lag has been defined for situations when the cells neither grew nor died initially (1, 20). It is commonly defined by extrapolating the tangent of the growth curve at the time of fastest growth back to the inoculum level (5). Baranyi and Roberts (1, 2) introduced an initial physiological parameter (α0) in their model to describe the effect of history on the lag period. The product of the maximum specific growth rate and the lag time, h0 (called “work to be done” [22] or the “relative lag time” [16]), is a reparameterization of α0, usually considered constant if the cells are in a favorable environment. The lag time depends not only on the new growth conditions but also on the physiological state of the cells which results from the growth conditions of the preinoculation environment (1, 16). In addition, after a stress or in stressful conditions, not all the cells are able to grow. Pirt (20) defined the lag as the apparent lag when not all the cells initially present are able to grow, as opposed to the true lag, when all the cells of the population can divide and multiply. With these definitions, Pirt (20) inferred that a subpopulation of cells is unable to grow. This was formalized by means of compartmental models (10, 15).
Studies show that the growth rate is decreased by the addition of salt (16, 24). Mellefont et al. (16, 17) studied the effect of the osmotic shift on the “work to be done” and used the relative lag time (the ratio of the lag time to the doubling time) to characterize the time required by the cells to grow. The experiments were carried out in a wide range of osmotic shifts to study their effects on the relative lag time.
Here, the growth of Salmonella is studied under a range of osmotic stresses in a chemically defined, minimal medium with or without the osmoprotectant glycine betaine and in a rich growth medium, containing osmoprotectants such as amino acids and trehalose naturally occurring in yeast extract. In particular, at high osmotic stress in minimal medium, the new environment is close to the growth/no-growth region, and initially the number of cells declines while the surviving cells gradually acclimatize and start to grow. In this case, the classical empirical definition of the lag by means of the inoculum level is not suitable. An extension of the model of Baranyi and Roberts (2) is proposed to analyze the effect of the salt concentration and the presence of osmoprotectants in the medium on the adaptation period of Salmonella.
MATERIALS AND METHODS
Strain and media.
Salmonella enterica serovar Typhimurium strain SL 1344 was maintained in tryptone soya broth (TSB; Oxoid catalog no. CM0129) with 40% glycerol stored at −80°C. Before each experiment, the Salmonella was resuscitated twice in TSB, incubated at 37°C, for 24 h.
The basic minimal medium (BMM) used for growth of S. Typhimurium consisted of 6.8 g liter−1 Na2HPO4, 3.0 g liter−1 KH2PO4, 0.5 g liter−1 NaCl, and 1.0 g liter−1 NH4Cl sterilized by autoclaving. Sterile solutions were prepared separately and added as follows: 20 ml 20% glucose, 2 ml 1 M MgSO4, 100 μl 1 M CaCl2, and 2 ml 0.01 M FeSO4, to give a final volume of 1 liter and concentrations of 4 g liter−1, 2 mM, 0.1 mM, and 0.1 mM, respectively.
A solution of 150 mM glycine betaine (Sigma Chemical Co., United Kingdom) was sterilized by filtration, and 1 ml was added to 1 liter BMM as an osmoprotectant.
Growth conditions.
The osmotic stress of three media, Luria-Bertani medium (LB; 10 g liter−1 tryptone, 5 g liter−1 yeast extract, 10 g liter−1 NaCl), BMM, and BMM plus betaine, was increased by adding NaCl: LB with up to 70 g liter−1 NaCl added (equivalent to 8% total NaCl), BMM with up to 55 g liter−1 NaCl added, and BMM plus betaine with up to 70 g liter−1 NaCl added.
Growth measurements.
Cultures (24 h at 37°C) in LB and BMM were diluted and inoculated into 100 ml of prewarmed (37°C) growth medium, from LB to LB and from BMM to BMM both with and without betaine. Sampling was carried out at appropriate intervals up to 15 days according to the growth conditions. The growth curves were measured by viable counts on agar plates (TSA, Oxoid CM0131). The experiments were repeated at least three times, and the results are reported as the averages from the replicate samples.
Modeling. (i) Primary models.
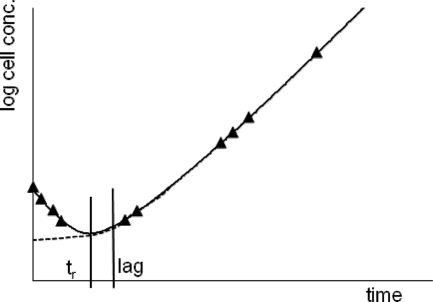
To take into account the initial decline in cell number, we assume that during the first part of the lag time, the cells build a certain protection (e.g., by producing osmoprotectants at low water activity), and as they do so, some of them die. When the protectant has reached the minimum level needed, the cells that have not died can start to grow, and a traditional growth model can be applied. The lag parameter is considered the lag of the whole process.
Our model is demonstrated in Fig. 1. There are two critical time points in the process: tr is the turning point when the protectant reaches a value after which preparation for growth can start. The lag is interpreted for the growing subpopulation as in the model of Baranyi and Roberts (1): it is the time when a substance, P, reaches the KP Michaelis-Menten value [when the factor P/(KP + P) reaches 0.5].
FIG. 1.
Regrowth following the decline phase with two characteristic time points: tr is the turning point when the cellular program turns from the objective function aimed at resisting inactivation to one aimed at preparing for multiplication, and lag is the time point when the underlying Michaelis-Menten factor assumes the value of 0.5.
The two-subpopulation assumption for the primary model was used because it has the advantage of having an algebraic solution:
 |
where y(t) is the natural logarithm of the cell concentration, μG and μD are the maximum specific growth and death rates, respectively, r0 is the fraction of the growing initial subpopulation (0 ≤ r0 < 1), and
 |
with λ being the lag time of the growing subpopulation (therefore, as per definition, of the whole population).
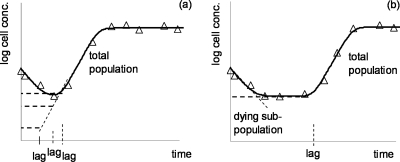
If there is a pronounced minimum of the “log count versus time” curve, then the standard errors for the lag tend to be high when using these formulae for curve fitting. This is because a whole domain of possible (r0, lag) pairs could result in the same optimum fitting (Fig. 2a). On the other hand, if the bottom of the curve is flat (Fig. 2b) then the standard error of the estimated lag is small; it can be uniquely determined. The lag estimate is highly sensitive to the cell concentration data around the minimum.
FIG. 2.
(a) The lag time estimation for a V-shaped log count curve leads to an ill-conditioned problem: only a correlation between the (r0, lag) pairs can be identified, not the parameters individually. (b) Assuming that the dying subpopulation follows linear kinetics, the flatter the shape of the curve around its minimum, the more robust is the estimation for r0 and lag.
Our nonlinear regression algorithm was constructed in such a way that it converged to the highest estimation of possible lag values. This is important only in the case depicted by Fig. 2a, which was the most frequently observed pattern.
(ii) Secondary model.
The maximum growth rate estimates (μG) were obtained by fitting the above model to measured log concentrations. The natural logarithms of these μG values were then fitted by a parabolic (second-order) function to the bw values, the rescaled version of the aw water activity values: bw = 1−aw.
The water activity was calculated from the NaCl concentration as
 |
(9). The natural logarithm of the h0 = μG·lag (work-to-be-done) parameter was similarly modeled as a function of the bw values, but using a linear (first-order) relationship only.
Computational implementation.
The nonlinear regression was performed by the respective routines of the Numerical Recipes (21), implemented in Visual Basic for Microsoft Excel.
RESULTS
Primary model and the initial decline in cell numbers.
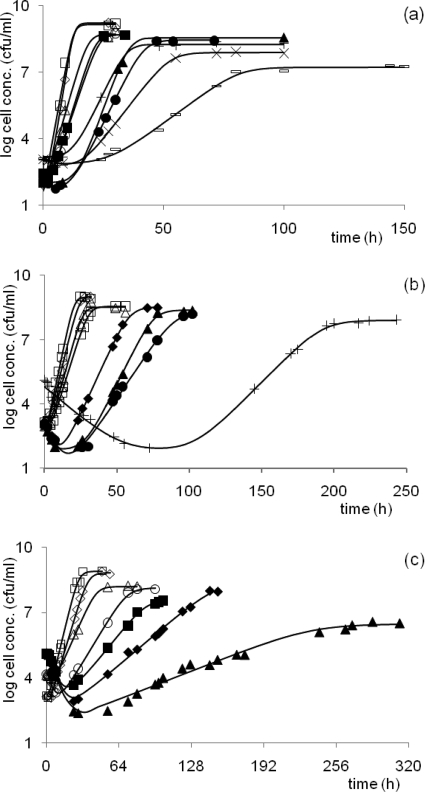
The estimated parameters, their standard errors, and the goodness-of-fit indicators are summarized in Table 1. The fitted curves are represented in Fig. 3. They show that the growth of S. Typhimurium was always faster and the lag shorter in rich LB medium than in BMM. When BMM was supplemented with betaine, the amount of growth was between those of the other two, indicating that betaine is an efficient osmoprotectant for growth in osmotic stress conditions.
TABLE 1.
Estimated maximum specific growth rate (h−1) and the h0 = μG·lag, the “work to be done” parameters, with their standard errors, as a function of the bw values, which were obtained by rescaling the salt concentrations
| % NaCl in: | bw | μG (h−1) | SE(μG) | h0 | SE(h0) |
|---|---|---|---|---|---|
| BMM | |||||
| 1 | 0.073 | 0.481 | 0.0143 | nsa | |
| 2 | 0.105 | 0.411 | 0.0177 | 1.45 | 4.65 |
| 3 | 0.130 | 0.270 | 0.0683 | 1.11 | 280 |
| 3.5 | 0.141 | 0.201 | 0.0181 | 2.13 | 273 |
| 4 | 0.151 | 0.147 | 0.0171 | 3.36 | 85.3 |
| 4.5 | 0.162 | 0.087 | 0.0159 | ns | |
| 5 | 0.171 | 0.069 | 0.0062 | 2.86 | 114 |
| BMM + betaine | |||||
| 1 | 0.073 | 0.773 | 0.0659 | 1.75 | 6.55 |
| 2 | 0.105 | 0.656 | 0.0619 | 1.46 | 6.32 |
| 3 | 0.130 | 0.568 | 0.0375 | 2.44 | 4.25 |
| 4 | 0.151 | 0.503 | 0.0206 | 2.61 | 3.57 |
| 4.5 | 0.162 | 0.343 | 0.0115 | 4.35 | 121 |
| 5 | 0.171 | 0.319 | 0.0146 | 8.90 | 10.8 |
| 5.5 | 0.180 | 0.236 | 0.0189 | 5.00 | 60.4 |
| 6.2 | 0.193 | 0.158 | 0.0243 | 16.40 | 80.1 |
| LB rich medium | |||||
| 1 | 0.073 | 1.940 | 0.4460 | 5.42 | 16.0 |
| 2 | 0.105 | 1.530 | 0.0539 | 2.90 | 9.21 |
| 3 | 0.130 | 0.863 | 0.0877 | ns | |
| 3.5 | 0.141 | 0.759 | 0.1900 | 2.03 | 25.9 |
| 4 | 0.151 | 0.882 | 0.2590 | 3.64 | 23.7 |
| 5 | 0.171 | 0.672 | 0.2020 | 9.11 | 194 |
| 5.5 | 0.180 | 0.509 | 0.0335 | 5.69 | 15.9 |
| 6.2 | 0.193 | 0.461 | 0.3110 | 4.16 | 855 |
| 7 | 0.207 | 0.323 | 0.0091 | 4.63 | 168 |
| 7.5 | 0.215 | 0.186 | 0.0151 | 5.03 | 19.3 |
ns, not significant and therefore not fitted (h0 = 0).
FIG. 3.
Growth of Salmonella in LB medium (a), BMM plus betaine (b), and BMM (c). NaCl concentrations: open square, 1%; open diamond, 2%; open triangle, 3%; open circle, 3.5%; closed square, 4%; closed diamond, 4.5%; closed triangle, 5%; closed circle, 5.5%; plus sign, 6.2%; times sign, 7.0%; and minus sign, 7.5%. The fitted primary model was obtained by assuming a dying and a growing initial subpopulation.
At low concentrations of salt, no initial decline was detected, and the lag, exponential, and stationary phases showed the well-known sigmoid characteristics in the different media. However, when the salt concentration was higher than 3.5% in BMM without betaine, or 4.5% in BMM with betaine, the cells suffered an initial decline in numbers, followed by recovery and growth. The magnitude of the initial decline and the recovery time depended on both the salt concentration and the presence of betaine. As the concentration of salt increased, the cells needed more time to recover back to the inoculum level in BMM both with and without betaine. There was no obvious initial decline period in the rich LB medium even at the highest salt concentrations.
Beyond the growth limits of the salt concentration, which also depended on the medium, the cells died without any recovery.
Effect of NaCl concentration on parameters μG and h0.
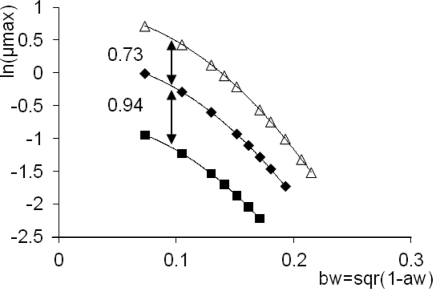
The maximum specific growth rates of S. Typhimurium in the three types of media, under various water activities, were studied by modeling the ln(μG) values as a function of the bw values listed in Table 1. The fitted μG versus bw plots suggested a parabolic relationship, where it might be sufficient to vary the constant term only, as a function of the medium. Indeed, as an F-test proved, the model ln(μG) = a × bw2 + b × bw + ci (i = 1, 2, 3), where c1 refers to BMM, c2 refers to BMM plus betaine, and c3 refers to LB medium, satisfactorily described the system.
In all three media, the h0 = μG·lag parameter increased as the amount of salt increased, as shown in Fig. 4, which is an important observation, since h0 is frequently taken as a constant in the literature. ComBase Predictor (3), one of the most used predictive food microbiology software packages, also takes h0 as a constant, although the user can set it arbitrarily via the α0 = exp(−h0) value, which is considered the initial physiological state, the “readiness” of the cells for the new environment. Koutsoumanis and Sofos (12) also observed that, unlike in the case of temperature-dependent secondary models, the h0 “work to be done” parameter increases with osmotic stress.
FIG. 4.
Effect of water activity on the natural logarithm of the specific growth rates in LB medium (open triangle), BMM plus betaine (diamond), and BMM (square). The difference between the fitted parabolic equations is constant.
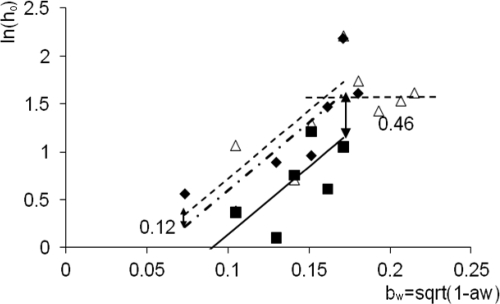
For less than 5% salt concentrations, we fitted the secondary models to the estimated h0 parameters obtained from the primary regression (Fig. 5): ln(h0) = m × bw + di (i = 1, 2, 3).
FIG. 5.
Natural logarithm of h0 (the “work to be done”) as a function of water activity in LB medium (open triangles fitted by the dashed line), BMM plus betaine (diamond and dashed/dotted line) and BMM (squares and continuous line). Up to bw values of 0.17 (equivalent to NaCl concentrations of 5%), the difference between the fitted linear equations is constant. Above 5% NaCl concentrations, the amount of work to be done is the same.
As mentioned in Materials and Methods, the variability of h0 was expected to be much higher than that of μG, so it would be unwise to introduce a more complex relationship. However, the positive correlation between the bw explanatory and the ln(h0) response variables proved to be significant; what is more, again the F-test showed that the assumption that the slopes were the same for all three media did not make the regression significantly poorer.
The final model is summarized as follows: ln(μG) = −62.2 × bw2 + 2.17 × bw + ci (i = 1, 2, 3), ln(h0) = 14.2 × bw + di (i = 1, 2, 3), where the indices 1, 2, and 3 refer to BMM, BMM plus betaine, and LB, respectively (c1 = −0.773, d1 = −1.28 [for BMM]; c2 = 0.165, d2 = −0.822 [for BMM plus betaine]; c3 = 0.891, d3 = −0.699 [for LB]).
The model for the lag time is simply the difference: ln(λ) = ln(h0) − ln(μG) = 62.2 × bw2 +12.03 × bw + (di − ci) (i = 1, 2, 3).
An important consequence of the parallel models above is as follows. A question that frequently arises is how to use predictive models in practice for food, when the model is based on data generated in rich laboratory medium. Figures 4 and 5 indicate a theoretical backing for an explanation.
The model for i = 3 is based on LB rich medium. Consider this as a predictive model to be used and the other two (i = 1, 2) as the different defined substrates. The logarithms of both the growth rate and the lag of the three systems differ only in a constant. Therefore, a prediction can be obtained for the specific growth rate in BMM by multiplying the prediction in LB by exp(c1 − c3) = 0.19. Similarly, the factor between the maximum specific growth rates in BMM plus betaine and LB is constant. This notion is equivalent to a constant bias factor introduced by Ross (23).
Similar conclusions could be drawn for the lag time, but with caution. As mentioned, the lag time refers to an unknown fraction of the inoculum that survived the initial decline. Therefore, for the lag time, the above simplification can produce very conservative estimations, especially if there is a significant initial decline in cell numbers.
DISCUSSION
Salmonella suffered an initial decline in cell numbers when inoculated into a minimal medium at low water activity. However, when the stress was not lethal, the cells could adapt and subsequently grow in the new condition. Other similar studies (14, 18) have also reported that in sublethally stressful environments, cell populations suffer an initial loss and then may recover.
As a response to osmotic shocks, the cells go through three overlapping phases: dehydration, adjustment and rehydration, and remodeling (26). Cells will stop respiration and most ion transport in just a few minutes after exposure to the shock. They then accumulate K+, glutamate, and compatible solutes and resume respiration in the following 20 to 60 min. After one or more hours, they start to express osmoresponsive genes, like proP and proU, and then establish the new cycle. This indicates that there is a large amount of and various biochemical work to be done in a new environment. Whether this work can be done and how much can be done determine the lag phase. The amount of work can also be affected by changing the concentration of K+ and glutamate or adding compatible solutes like betaine to help the cells adapt to the new condition more quickly and easily, which is in accord with our experimental results in LB and BMM with and without betaine.
In LB medium, the cells did not show an initial decrease even in the environment with the highest salt concentration, whereas there is an apparent initial decrease in BMM with and without betaine when the salt concentration is high. This may be due to whether or not some sensitive enzymes or proteins that are essential for survival in the high osmotic conditions can be produced (6). In rich medium, the cells can survive by readily absorbing sufficient nutrients from the environment to overcome the shock. However, in minimal medium, the cells are already stressed and are therefore unable to build a new cycle when subjected to the osmotic shock. Consequently, the more vulnerable cells with less essential protein or enzyme cannot absorb these from the minimal medium and will gradually die.
Below 5% salt concentrations, the “work to be done” parameter, h0, increased with decreasing water activity in all three media. However, the linear models fitted to the “ln(h0) versus bw” data had the same slope for all three media. When the salt concentration in BMM was higher than 5%, the cells were unable to grow, while in BMM plus betaine, the cells could grow in 6.2% salt. The amount of work to be done increased sharply close to the growth/no-growth boundary. Mellefont et al. (16, 18) also observed that the ratio of the lag to the division time increased dramatically as the water activity was close to the growth/no-growth interface.
In LB medium, on the other hand, h0 remained at the same level when the salt concentration was higher than 5%, while the specific growth rate decreased. This suggests that there is a maximum level of biochemical work that the cells can do to survive in the rich medium or, equivalently, that a minimum level is required for their α0 initial physiological suitability to the new environment.
To conclude, we propose a model that takes into account an initial decrease in cell number and allows the interpretation of the adaptation to osmotic stress in different media.
Acknowledgments
This work was funded by an Institute Strategic Programme Grant of the BBSRC, and K.Z. gratefully acknowledges the support of the China Scholarship Council.
Footnotes
Published ahead of print on 30 December 2010.
REFERENCES
- 1.Baranyi, J., and T. A. Roberts. 1994. A dynamic approach to predicting bacterial growth in food. Int. J. Food Microbiol. 23:277-294. [DOI] [PubMed] [Google Scholar]
- 2.Baranyi, J., and T. A. Roberts. 1995. Mathematics of predictive food microbiology. Int. J. Food Microbiol. 26:199-218. [DOI] [PubMed] [Google Scholar]
- 3.Baranyi, J., and M. Tamplin. 2004. ComBase: a common database on microbial responses to food environments. J. Food Prot. 67:1967-1971. [DOI] [PubMed] [Google Scholar]
- 4.Baty, F., and M.-L. Delignette-Muller. 2004. Estimating the bacterial lag time: which model, which precision? Int. J. Food Microbiol. 91:261-277. [DOI] [PubMed] [Google Scholar]
- 5.Brul, S., S. van Gerwen, and M. Zwietering. 2007. Modelling microorganisms in food. Woodhead, Cambridge, United Kingdom.
- 6.Cairney, J., I. R. Booth, and C. F. Higgins. 1985. Osmoregulation of gene expression in Salmonella typhimurium: proU encodes an osmotically induced betaine transport system. J. Bacteriol. 164:1224-1232. [DOI] [PMC free article] [PubMed] [Google Scholar]
- 7.Cayley, S., B. A. Lewis, and M. T. Record, Jr. 1992. Origins of the osmoprotective properties of betaine and proline in Escherichia coli K-12. J. Bacteriol. 174:1586-1595. [DOI] [PMC free article] [PubMed] [Google Scholar]
- 8.Csonka, L. N. 1989. Physiological and genetic responses of bacteria to osmotic stress. Microbiol. Rev. 53:121-147. [DOI] [PMC free article] [PubMed] [Google Scholar]
- 9.Gibson, A. M., J. Baranyi, I. Pitt, M. J. Eyles, and T. A. Roberts. 1994. Predicting fungal growth: the effect of water activity on four species of Aspergillus. Int. J. Food Microbiol. 23:419-431. [DOI] [PubMed] [Google Scholar]
- 10.Hills, B. P., and B. M. Mackey. 1995. Multi-compartment kinetic models for injury, resuscitation, induced lag and growth in bacterial cell populations. Food Microbiol. 12:333-346. [Google Scholar]
- 11.Koo, S. P., and I. R. Booth. 1994. Quantitative analysis of growth stimulation by glycine betaine in Salmonella typhimurium. Microbiology 140:617-621. [DOI] [PubMed] [Google Scholar]
- 12.Koutsoumanis, K. P., and J. N. Sofos. 2005. Effect of inoculum size on the combined temperature, pH and aw limits for growth of Listeria monocytogenes. Int. J. Food Microbiol. 104:83-91. [DOI] [PubMed] [Google Scholar]
- 13.Koyuncu, S., M. G. Andersson, and P. Haggblom. 2010. Accuracy and sensitivity of commercial PCR-based methods for detection of Salmonella enterica in feed. Appl. Environ. Microbiol. 76:2815-2822. [DOI] [PMC free article] [PubMed] [Google Scholar]
- 14.Mackey, B. M., and C. M. Derrick. 1982. The effect of sublethal injury by heating, freezing, drying and gamma-radiation on the duration of the lag phase of Salmonella typhimurium. J. Appl. Bacteriol. 53:243-251. [DOI] [PubMed] [Google Scholar]
- 15.McKellar, R. C. 1997. A heterogeneous population model for the analysis of bacterial growth kinetics. Int. J. Food Microbiol. 36:179. [DOI] [PubMed] [Google Scholar]
- 16.Mellefont, L. A., and T. Ross. 2003. The effect of abrupt shifts in temperature on the lag phase duration of Escherichia coli and Klebsiella oxytoca. Int. J. Food Microbiol. 83:295-305. [DOI] [PubMed] [Google Scholar]
- 17.Mellefont, L. A., T. A. McMeekin, and T. Ross. 2004. The effect of abrupt osmotic shifts on the lag phase duration of foodborne bacteria. Int. J. Food Microbiol. 92:111-120. [DOI] [PubMed] [Google Scholar]
- 18.Mellefont, L. A., T. A. McMeekin, and T. Ross. 2005. Viable count estimates of lag time responses for Salmonella typhimurium M48 subjected to abrupt osmotic shifts. Int. J. Food Microbiol. 105:399-410. [DOI] [PubMed] [Google Scholar]
- 19.Murchie, L., B. Xia, R. H. Madden, P. Whyte, and L. Kelly. 2008. Qualitative exposure assessment for Salmonella spp. in shell eggs produced on the island of Ireland. Int. J. Food Microbiol. 125:308-319. [DOI] [PubMed] [Google Scholar]
- 20.Pirt, S. J. 1975. Principles of microbe and cell cultivation. Blackwell, Oxford, United Kingdom.
- 21.Press, W. H., B. P. Flannery, S. A. Teukolsky, and W. T. Vetterling. 1990. Numerical recipes. Cambridge University Press, Cambridge, United Kingdom.
- 22.Robinson, T. P., M. J. Ocio, A. Kaloti, and B. M. Mackey. 1998. The effect of the growth environment on the lag phase of Listeria monocytogenes. Int. J. Food Microbiol. 44:83-92. [DOI] [PubMed] [Google Scholar]
- 23.Ross, T. 1996. Indices for performance evaluation of predictive models in food microbiology. J. Appl. Microbiol. 81:501-508. [DOI] [PubMed] [Google Scholar]
- 24.Ross, T., D. A. Ratkowsky, L. A. Mellefont, and T. A. McMeekin. 2003. Modelling the effects of temperature, water activity, pH and lactic acid concentration on the growth rate of Escherichia coli. Int. J. Food Microbiol. 82:33-43. [DOI] [PubMed] [Google Scholar]
- 25.Sauli, I., et al. 2005. Estimating the probability and level of contamination with Salmonella of feed for finishing pigs produced in Switzerland—the impact of the producing pathway. Int. J. Food Microbiol. 100:289-310. [DOI] [PubMed] [Google Scholar]
- 26.Wood, J. M. 1999. Osmosensing by bacteria: signals and membrane-based sensors. Microbiol. Mol. Biol. Rev. 63:230-262. [DOI] [PMC free article] [PubMed] [Google Scholar]


