Abstract
Measurement of peripheral blood cytokines and other immunomodulatory proteins is a useful and popular tool for assessing human immune responses to a wide range of assaults. A common challenge in this work is obtaining fresh, high-quality samples and limiting the time between blood collection and the separation of plasma or serum from cells. In this study we sought to determine the effect of sample age at the time of processing on the measured levels of 41 soluble immune mediators. Two cohorts were examined: healthy lab donors and trauma patients, who have significant immune perturbation. Whole-blood samples were aliquoted, and plasma was isolated, at days 0, 1, 2, and 3 after collection. Multiplexing techniques were used to measure protein concentrations, and general estimating equations were used to determine if there was a significant change over time. Over the 3-day period examined, only 15 of the 41 proteins showed no significant change in either cohort. Among the remaining proteins both increases and decreases were observed, with changes ranging from 2.4% per day to 325% per day. Proteins with significant changes in one cohort did not always show significant changes in the other group. These results support the need to separate plasma or serum from whole blood as quickly as possible and/or to standardize the length of time to processing within a given study of peripheral blood protein concentrations. When this is not possible, care should be taken to account for differences due to sample age.
Measurement of cytokines in peripheral blood is a common technique for assessing the quality and magnitude of immune responses in human subjects. Concentrations of various cytokines measured in the serum or plasma have been shown in a number of diseases to correlate with pathogenesis, stage of infection, and disease outcomes (5, 10, 11, 14, 16-18, 20, 22). Blood specimens are relatively easy to obtain from a wide range of patients, and multiplexing techniques have made it possible to measure the levels of large numbers of cytokines rapidly using very small sample volumes.
Consistency in sample collection and processing is important when one is assaying cytokine levels, since a number of factors have been shown to influence measured concentrations. The concentrations detected for some cytokines can differ in matched plasma and serum samples, and the use of different anticoagulants can further contribute to variation (1, 4, 7, 9, 13, 21). In addition, the storage temperature and the number of freeze-thaw cycles can influence measurements for some proteins in plasma or serum after processing, though generally these differences are small (1, 9, 21). The time between the collection of samples and their processing into components has also been shown to impact levels of tumor necrosis factor alpha (TNF-α), interleukin-6 (IL-6), IL-1α, and alpha interferon (IFN-α) (8, 9, 13, 21).
A common issue in assessing human immune responses is the difficulty of obtaining fresh, high-quality samples. Manufacturers' protocols for commonly used multiplex kits recommend isolating plasma from whole blood within 30 min of collection, but this is not always feasible. Blood samples are not always collected and processed in the same location, and as a result, processing into plasma can be delayed for hours or even days. When patient samples are shipped, further delays can occur over weekends and holidays. In this study, we examined the effect of the time to processing on measured concentrations of immunomodulatory proteins in plasma. Forty-one different proteins were measured using multiplexing techniques on samples collected from healthy lab donors and trauma patients.
MATERIALS AND METHODS
Sample collection.
For healthy lab donors, blood was collected into 4-ml plastic Vacutainer spray-coated K2EDTA tubes (Becton Dickinson [BD], Franklin Lakes, NJ). Whole blood was drawn from 10 healthy donors, with 4 tubes collected from each donor. One tube from each donor was processed immediately, one at 24 h, one at 48 h, and one at 72 h after the draw. Ten trauma patients were recruited at the University of California—Davis Medical Center (Sacramento, CA) as part of a larger study, and samples were drawn into 10-ml plastic Vacutainer spray-coated K2EDTA tubes (BD) upon the patients' arrival in the emergency department. All study subjects and controls provided informed consent under institutional review board (IRB)-approved protocols. Trauma samples were shipped via overnight courier service (FedEx) to the Blood Systems Research Institute (BSRI; San Francisco, CA) and were gently mixed by inversion, and three 0.4-ml aliquots were made in Microtainer serum (without additive) tubes (BD). These tubes were chosen because they are made from the same material as the Vacutainer collection tubes, have minimal excess air space, and would not contribute additional anticoagulants. Samples were selected based on their arrival at BSRI no more than 24 h after collection and the availability of sufficient volume. One sample was processed immediately (1 day after the draw), one 24 h later, and one 48 h later. Samples with a delayed processing time were stored at room temperature until processing.
Sample processing.
Samples were centrifuged at 2,000 rpm for 10 min. The plasma fraction was transferred to a new tube, which was centrifuged again to remove any residual cells or debris. The plasma was then transferred to a new tube and was aliquoted in small, single-use volumes to avoid multiple freeze-thaw cycles. These samples were stored at −80°C until use.
Cytokine detection.
Cytokines were measured using a Luminex 100 platform (Luminex, Austin, TX) and BioManager software (Bio-Rad, Hercules, CA) for analysis. The following multiplexing kits were purchased from Millipore (Billerica, MA): (i) the Milliplex MAP Human Cytokine/Chemokine kit, containing IL-1α, IL-1 receptor antagonist (IL-1Ra), IL-9, IL-12p40, IL-15, IL-17, epidermal growth factor (EGF), eotaxin, fibroblast growth factor-2 (FGF-2), fractalkine, IP-10 (CXCL10), monocyte chemotactic protein 1 (MCP-1), MCP-3, macrophage-derived chemokine (MDC), macrophage inflammatory protein 1α (MIP-1α), MIP-1β, soluble IL-2 receptor alpha (sIL-2Rα), tumor necrosis factor alpha (TNF-α), TNF-β, and vascular endothelial growth factor (VEGF); (ii) the Milliplex MAP High Sensitivity Human Cytokine kit, containing IL-1β, IL-2, IL-4, IL-5, IL-6, IL-7, IL-8, IL-10, IL-12p70, IL-13, gamma interferon (IFN-γ), granulocyte-macrophage colony-stimulating factor (GM-CSF), and TNF-α; (iii) the Milliplex MAP Human Sepsis/Apoptosis kit, containing soluble vascular cell adhesion molecule 1 (sVCAM-1), soluble intercellular adhesion molecule 1 (sICAM-1), sFas, sFas ligand (sFasL), macrophage migration inhibitory factor (MIF), and total plasminogen activator inhibitor-1 (tPAI-1); and (iv) the Milliplex MAP Human Cardiovascular Disease (CVD) Panel 1 kit, containing soluble E-selectin (sE-selectin), matrix metallopeptidase 9 (MMP-9), and myeloperoxidase (MPO). Kits were run according to the manufacturer's instructions, with the exception of sample collection and processing as described above. Incubation of beads and test samples for all kits was performed overnight at 4°C for maximum sensitivity. Samples were run in single wells only to allow all samples for each assay to be run on a single plate and thus avoid plate-to-plate variability. Extrapolated values were required for a subset of samples for the following analytes: IL-5 and GM-CSF for the High Sensitivity Human Cytokine kit; FGF-2, IL-9, IL-15, IL-17, MCP-3, and TNF-α for the Human Cytokine/Chemokine kit; and MIF and sFasL for the Human Sepsis/Apoptosis kit.
Statistical analysis.
Changes in cytokine concentrations over time were assessed using general estimating equations (GEE), where the age of the sample at processing was used as the independent variable and the protein concentration was the dependent variable. Undetectable values were assigned a value of zero for the purposes of analysis. The analysis was performed using Stata Special Edition, version 10.1 (Stata, College Station, TX). Concentrations were plotted over time using Prism, version 5.0a (GraphPad Software, Inc., La Jolla, CA).
RESULTS
Healthy-donor responses.
To assess the impact of blood sample age at the time of processing on measured plasma protein levels, 4 tubes of blood were collected from each of 10 healthy lab donors and were processed at different time intervals. One set was processed immediately after collection and one each at 24 h, 48 h, and 72 h after collection. Forty-one different cytokines, chemokines, and growth factors were measured in the plasma fractions using 4 different multiplexing assays. TNF-α was measured twice using both high-sensitivity and standard sensitivity kits. A GEE model was used to examine the impact of sample age on protein concentration while controlling for differences in concentrations between individuals. Linear, quadratic, and cubed curves were tested for best overall fit. While for some cytokines there were individuals with nonlinear trends, overall, a linear description of the change over time provided the best model fit with the strongest χ2 values, so linear models were used. The coefficients (which represent the predicted change in the absolute value of the measured concentration for each day in storage), standard error, P values, and mean concentration at day 0 for all 42 proteins measured (including 2 different assays for TNF-α) are reported in Table 1 (left columns), organized by assay kit.
TABLE 1.
Summary of coefficients reported by GEE modelsa
| Assay kit and protein | Healthy lab donors |
Trauma patients |
||||||
|---|---|---|---|---|---|---|---|---|
| Coefficient | P > |z| | SE | Mean concn on day 0 | Coefficient | P > |z| | SE | Mean concn on day 1 | |
| Milliplex MAP Human Cytokine/Chemokine kit | ||||||||
| IL-1α | −37.9 | 0.11 | 24.0 | 225 | −29.3 | 0.012 | 11.7 | 99.7 |
| IL-1Ra | 140 | <0.001 | 21.1 | 50.3 | 778 | <0.001 | 141 | 1,190 |
| IL-2Rα | −15.5* | 0.12 | 10.0 | 91.2 | −13 | 0.12 | 8.30 | 112 |
| IL-9 | 0.843 | 0.91 | 7.46 | 9.92 | −0.774* | 0.16 | 0.55 | 3.45 |
| IL-12(p40) | −19.5 | 0.023 | 8.57 | 117 | −11.2 | 0.008 | 4.25 | 63.6 |
| IL-15 | −0.376 | 0.28 | 0.35 | 4.87 | −0.592 | 0.11 | 0.37 | 2.35 |
| IL-17 | −3.91 | 0.17 | 2.86 | 33.6 | −1.07 | 0.03 | 0.49 | 5.07 |
| EGF | 23.4 | 0.004 | 8.16 | 80.5 | 9.12 | 0.001 | 2.87 | 34.5 |
| Eotaxin | 4.8 | 0.025 | 2.14 | 105 | 1.21 | 0.71 | 3.22 | 97.4 |
| FGF-2 | −2.22 | 0.22 | 1.81 | 24.5 | −2.05 | 0.02 | 0.88 | 18.9 |
| Fractalkine | −27.6 | 0.29 | 25.9 | 218 | −17.1 | 0.016 | 7.14 | 130 |
| IP-10 | −49.2 | <0.001 | 8.41 | 359 | −25.5 | 0.001 | 7.70 | 252 |
| MCP-1 | −34.6 | <0.001 | 6.82 | 259 | −50.4 | <0.001 | 9.94 | 360 |
| MCP-3 | −2.58 | 0.15 | 1.79 | 19.3 | −1.23 | 0.04 | 0.60 | 12.1 |
| MDC | −75.6 | 0.009 | 28.9 | 1,510 | −81.1 | 0.001 | 24.7 | 1,204 |
| MIP-1α | −15.6 | 0.002 | 4.94 | 108 | −4.83 | 0.11 | 2.98 | 37.7 |
| MIP-1β | −7.39 | 0.15 | 5.14 | 88.5 | 1.3 | 0.81 | 5.31 | 94.7 |
| TNF-α | −0.034 | 0.93 | 0.39 | 5.85 | 0.118 | 0.68 | 0.29 | 7.31 |
| TNF-β | −0.241 | 0.54 | 0.40 | 42.4 | −0.096* | 0.4 | 0.11 | 7.46 |
| VEGF | −15.6 | 0.18 | 11.6 | 182 | 2.15 | 0.86 | 12.4 | 103 |
| Milliplex MAP High Sensitivity Human Cytokine kit | ||||||||
| IL-1β | −1.7 | 0.26 | 1.50 | 1.2 | 1.44 | <0.001 | 0.33 | 1.79 |
| IL-2 | −11.6 | 0.33 | 11.9 | 4.35 | −0.41 | 0.019 | 0.17 | 2.55 |
| IL-4 | 11.9 | 0.82 | 51.7 | 225 | 0.677 | 0.45 | 0.90 | 77.8 |
| IL-5 | −0.347 | 0.14 | 0.24 | 1.02 | 0.015* | 0.38 | 0.02 | 0.194 |
| IL-6 | −1.416 | 0.87 | 8.58 | 21.8 | −2.48 | 0.004 | 0.87 | 30.3 |
| IL-7 | −1.46 | 0.45 | 1.92 | 5.2 | −0.156 | 0.38 | 0.18 | 2.35 |
| IL-8 | 14.3 | <0.001 | 3.66 | 9.39 | 26.1 | <0.001 | 5.37 | 13 |
| IL-10 | −2.3 | 0.28 | 2.11 | 37.6 | −19.6 | 0.007 | 7.31 | 146 |
| IL-12(p70) | −55 | 0.69 | 136 | 14 | −0.332 | 0.11 | 0.21 | 2.28 |
| IL-13 | 1.79 | 0.91 | 15.0 | 111 | 2.98 | 0.14 | 2.00 | 52.6 |
| GM-CSF | −6.79 | 0.59 | 12.6 | 9.49 | −0.096 | 0.4 | 0.11 | 1.92 |
| IFN-γ | −5.27 | 0.031 | 2.45 | 7.04 | −0.47* | 0.07 | 0.26 | 1.68 |
| TNF-α | −4.64 | 0.54 | 7.50 | 5.42 | 0.783 | 0.003 | 0.27 | 8.48 |
| Milliplex MAP Human Sepsis/Apoptosis kit | ||||||||
| MIF | 679 | <0.001 | 83.9 | 209 | 910 | 0.69 | 2,283 | 2,667 |
| sFas | 242 | <0.001 | 55.5 | 6,280 | 57.5 | 0.66 | 130 | 5,502 |
| sFasL | 2.74* | 0.1 | 1.64 | 5.51 | 7.7 | 0.011 | 3.03 | 35.5 |
| sICAM-1 | 1,820 | 0.09 | 1,068 | 130,000 | 163 | 0.95 | 2,695 | 135,000 |
| sVCAM-1 | 7,400 | 0.12 | 4,781 | 495,000 | 5,700 | 0.71 | 15,294 | 519,000 |
| tPAI-1 | 9,490 | <0.001 | 902 | 18,900 | 7,400 | <0.001 | 1,734 | 56,000 |
| Milliplex MAP Human Cardiovascular Disease (CVD) Panel 1 kit | ||||||||
| MMP-9 | 112,000 | <0.001 | 27,141 | 125,000 | 163,000 | 0.009 | 62,180 | 790,000 |
| MPO | 4,170 | <0.001 | 1,109 | 14,700 | 23,100 | 0.47 | 32,307 | 147,000 |
| sE-selectin | −0.647 | 0.03 | 0.30 | 27 | −0.53 | 0.28 | 0.49 | 23.1 |
Coefficients (predicted change in concentration per day in pg/ml) with associated standard error (SE) and P values (P > |z|) from each GEE model are listed along with mean concentrations in pg/ml from the freshest samples available. Boldface indicates a P value of <0.05. An asterisk indicates that ≥50% of data points within the cohort were below the limit of detection of the assay.
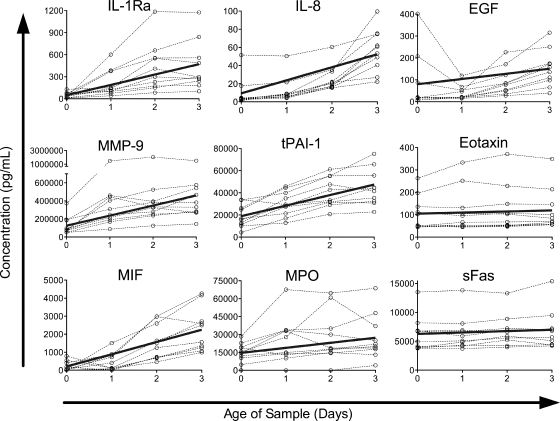
The concentrations of nine proteins increased significantly among the healthy-donor population over the 4-day period (Fig. 1). The magnitudes of these increases differed widely, with small increases in sFas (3.9%/day) and eotaxin (4.6%/day); moderate to large increases in MPO (28%/day), EGF (29%/day), tPAI-1 (50%/day), and MMP-9 (90%/day); and very large increases in IL-8 (152%/day), IL-1Ra (278%/day), and MIF (325%/day).
FIG. 1.
Proteins with significant increases in concentration over time in a healthy-donor cohort. Protein concentrations in healthy-donor samples versus time since collection are plotted by individual for all proteins in which the model detected a significant increase over time (P < 0.05). Data for each individual are connected by dashed lines. Solid lines represent the predicted change over time, calculated by the equation y = (mean at t = 0) + (coefficient) × x.
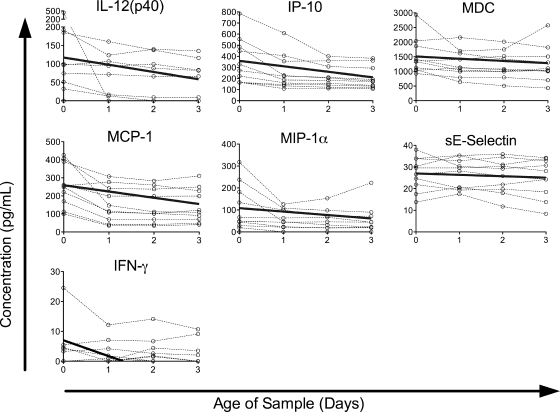
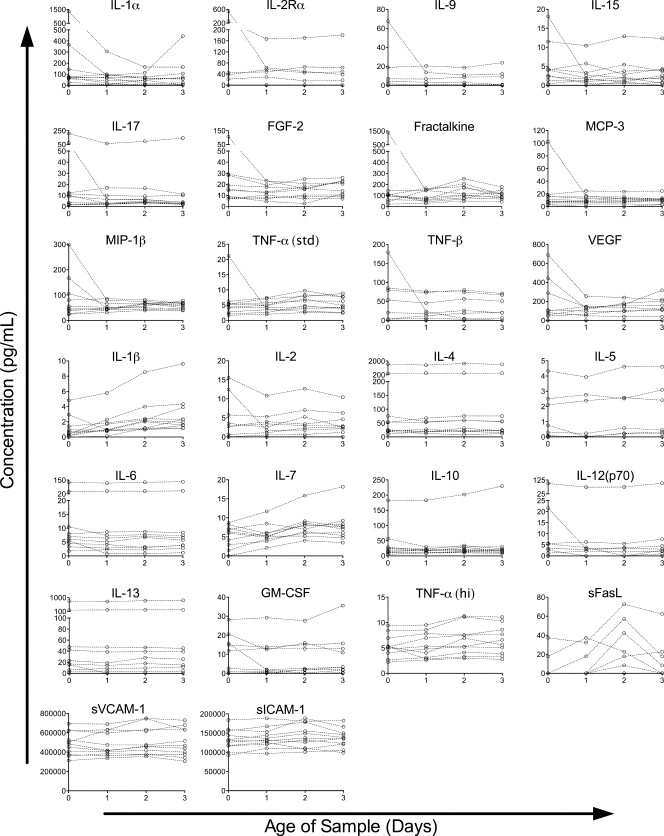
The concentrations of seven other proteins showed significant decreases over time, though the decreases were generally smaller in magnitude than the increases (Fig. 2). Small decreases were seen in sE-selectin (2.4%/day) and MDC (5.0%/day); moderate decreases in MCP-1 (13%/day), IP-10 (14%/day), MIP-1α (14%/day), and IL-12(p40) (17%/day); and a larger decrease in IFN-γ (75%/day). The remaining proteins assayed did not show a significant change over time (Fig. 3), though in some cases this may be an issue of assay sensitivity. The levels of two proteins, IL-2Rα and sFasL, were below the limit of detection of our assay in the majority of healthy-donor samples assayed. In most cases, the failure to detect a significant change over time appeared to be due to stable detected levels, but for some cytokines, such as IL-1α and VEGF, it may be due to trends running in different directions among individuals.
FIG. 2.
Proteins with significant decreases in concentration over time in a healthy-donor cohort. Protein concentrations in healthy-donor samples versus time since collection are plotted by individual for all proteins in which the model detected a significant decrease over time (P < 0.05). Data for each individual are connected by dashed lines. Solid lines represent the predicted change over time, calculated by the equation y = (mean at t = 0) + (coefficient) × x.
FIG. 3.
Proteins without significant changes in concentration over time in a healthy-donor cohort. Protein concentrations in healthy-donor samples versus time since collection are plotted by individual for all proteins in which the model failed to detect a significant change over time (P ≥ 0.05). Data for each individual are connected by dashed lines.
Trauma patient responses.
In addition to healthy donors, we also analyzed changes due to sample age for a cohort of patients for whom we expected higher levels of cytokines in the plasma. We studied a subset of trauma patients taken from a larger cohort currently under study, since trauma has been shown to modulate the immune response strongly (6, 15). Ten samples were collected over 14 weeks, with 3 aliquots per sample. One aliquot was processed immediately (24 h after collection), the second 24 h later (48 h after collection), and the third 48 h later (72 h after collection). The same 42 analytes as for the healthy-donor samples were assessed. The coefficients, standard error, P values, and mean concentrations at day 1 for the trauma patient samples are reported alongside those for healthy-donor samples in Table 1 (right columns).
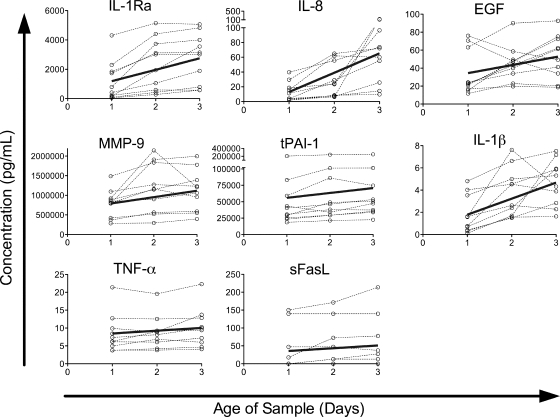
The concentrations of eight proteins increased as the samples aged (Fig. 4). Five of these were the same as those seen in the healthy donor population: IL-1Ra (65%/day), IL-8 (200%/day), EGF (26%/day), MMP-9 (21%/day), and tPAI-1 (13%/day). The increases in IL-8 and EGF were in the same range as that observed in the healthy-donor populations, whereas the percentages of increase for IL-1Ra, MMP-9, and tPAI-1 were much smaller than those observed for the healthy donors. However, the starting concentrations of these cytokines were much higher in the trauma patients, and the actual increases in IL-1Ra and MMP-9, though not in tPAI-1, were also significantly larger in the trauma patients. The concentrations of three cytokines increased in the trauma population only: IL-1β (80%/day), TNF-α (9.2%/day), and sFasL (22%/day). Four of the cytokines that had increased in the healthy-donor samples (eotaxin, MIF, MPO, and sFas) did not show significant changes in the trauma patients, although the trend was in the same direction.
FIG. 4.
Proteins with significant increases in concentration over time in a trauma patient cohort. Protein concentrations in trauma patient samples versus time since collection are plotted by individual for all proteins in which the model detected a significant increase over time (P < 0.05). Data for each individual are connected by dashed lines. Solid lines represent the predicted change over time, calculated by the equation y = (mean at t = 1) + (coefficient) × (x − 1).
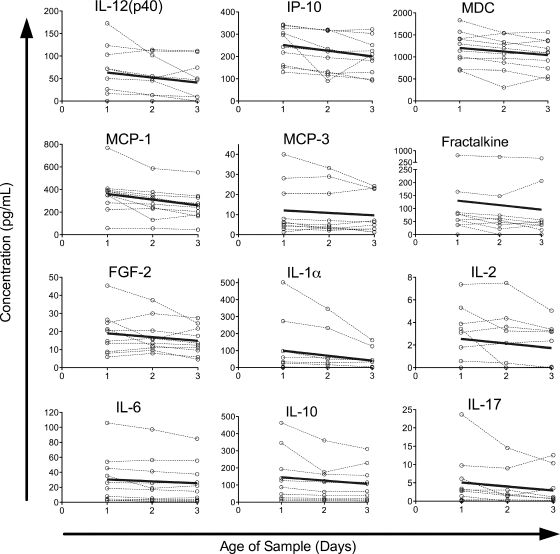
The concentrations of 12 proteins decreased over time in the trauma patient cohort (Fig. 5). This is almost twice as many as those seen in the healthy-donor cohort (seven). Four of the 12 decreases were seen in the healthy population as well, with very similar small to moderate percentages of decrease: IL-12(p40) (18%/day), IP-10 (10%/day), MCP-1 (14%/day), and MDC (6.7%/day). The remaining eight proteins whose concentrations decreased in the trauma patient cohort did not show significant decreases in the healthy population, though these all trended in the same direction in the healthy population (see Table 1). All of these decreases were in the small-to-moderate range: IL-1α (29%/day), IL-2 (16%/day), IL-6 (8.2%/day), IL-10 (13%/day), IL-17 (21%/day), MCP-3 (10%/day), fractalkine (13%/day), and FGF-2 (11%/day).
FIG. 5.
Proteins with significant decreases in concentration over time in a trauma patient cohort. Protein concentrations in trauma patient samples versus time since collection are plotted by individual for all proteins in which the model detected a significant decrease over time (P < 0.05). Data for each individual are connected by dashed lines. Solid lines represent the predicted change over time, calculated by the equation y = (mean at t = 1) + (coefficient) × (x − 1).
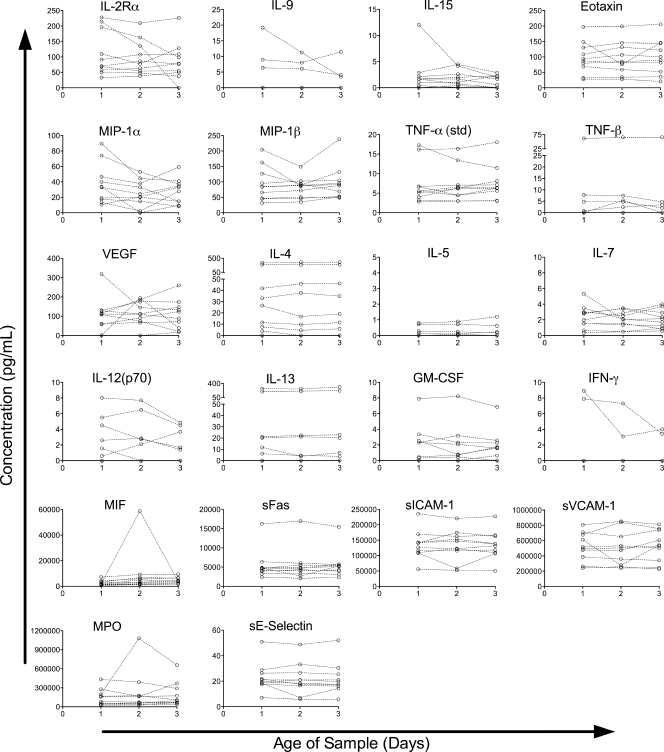
The concentrations of three of the cytokines that had decreased in the healthy donors (IFN-γ, MIP-1α, and sE-selectin) did not show significant changes in the trauma patient cohort, although the trends were in the same direction. A total of 22 assays did not detect a change over time in the trauma patient cohort (Fig. 6). Four of the proteins assayed, IL-5, IL-9, IFN-γ, and TNF-β, were below the limit of detection in the majority of samples in the trauma patient cohort. Others, such as IL-2Rα and MIP-1α, appeared to have slopes in opposing directions among individuals, leading to no clear trend. In most of the cases where no significant trend was found, the proteins assayed appeared to remain relatively stable within this cohort.
FIG. 6.
Proteins without significant changes in concentration over time in a trauma patient cohort. Protein concentrations in trauma patient samples versus time since collection are plotted by individual for all proteins in which the model failed to detect a significant change over time (P ≥ 0.05). Data for each individual are connected by dashed lines.
DISCUSSION
A majority of the analytes we examined (27 out of 42) did not have stable concentrations in our blood samples as the blood aged prior to processing. The remaining 15 appeared to be relatively stable, in that we did not see a statistically significant increase or decrease as the samples aged. For most of these 15 cytokines, the levels appeared relatively stable over time within individual samples as well as in the overall group, but for others, the failure to see a significant increase or decrease over time may have been due to low expression levels. The concentration of IFN-γ, for example, decreased significantly in healthy-donor samples but not in trauma patient samples. Closer examination of individual trends, however, showed that IFN-γ concentrations were below detection in 8 of the 10 trauma patient samples and did decrease over time in the other 2. The failure to see a significant change can also be driven by too much variation in the direction of change between subjects to allow the detection of a consistent trend. This may have been the case with a small number of proteins assayed, though it appeared to be the exception in our cohorts. There were also some individuals whose samples trended opposite those of the population as a whole with regard to some of the cytokines that did show a significant change over time, such as EGF, but the trend was still strong enough on the population level to yield a statistically significant overall trend. Of those cytokines whose concentrations did change with time, some increased, while others decreased, and significant changes observed in one cohort did not always mirror what was observed in the other cohort, although the trends were generally in the same direction. We did not observe any consistent trends in particular classes of cytokines that would suggest general consumption or production of a given group of cytokines, such as pro- or anti-inflammatory mediators.
Previous studies of the stability of cytokine measurements over time have not looked at such large numbers of cytokines but have seen similar trends. Decreases in IL-6 and increases in TNF-α concentrations have been observed over time in samples collected into EDTA in other cohorts by use of enzyme-linked immunosorbent assay (ELISA) or radioimmunoassay detection methods (9, 13). Another study observed decreases over time in the concentrations of both IL-6 and TNF-α, but that study used blood samples spiked with these cytokines, and exogenous cytokines may behave differently (21). TNF-α concentrations also decreased over time in samples collected into heparin (8), but collection into heparin tubes has been shown to impact cytokine production and cell activation (19).
The increases observed could be caused by a number of different mechanisms. One explanation is that cells that were already stimulated to produce a given protein in vivo continued to produce the protein in the tube ex vivo. Another possibility is that the conditions in the tube stimulated de novo production of proteins. Contributing conditions could include temperature change, contact with the plastic tube, contact with the EDTA used as an anticoagulant, failure to contact tissue ligands, nutrient exhaustion, and close cell-cell contact of white cells as blood separates. Finally, as cells begin to die in the tube, proteins may be released, either as a distress response of cells in extremis or as a release of cytoplasmic contents as cell membrane integrity breaks down.
The observed decreases in protein concentrations could also be caused by more than one mechanism. Cells present in the tube might consume or bind some proteins. The decreases over time observed in IL-2 levels, for example, might be explained by T cell consumption. In addition, some of the environmental factors described above, such as temperature changes and the presence of cytoplasmic and lysosomal contents as cells die may lead to increased protein degradation or to changes in protein structure that reduce detection by the assay.
While the trends were generally similar for the two cohorts, they were not the same, and certainly many of the proteins showed a significant change in only one of the two cohorts examined here. Furthermore, while the direction of change was always the same in cases where there was a significant change in both cohorts, the slope of the line was often quite different. There are a number of possible explanations for these differences. One possibility is that the cells from a sample in one cohort are differentially activated or inhibited at the time of collection and continue to produce and/or consume proteins at different rates as a result. Furthermore, these cells may react differently to the altered environmental conditions to which they are exposed in the tube as a result of their distinct preconditioning in vivo. This could lead to differences in cytokine production and consumption, and even in cell survival in the tube. Another explanation for some of the differences is that a sample with high expression of a given protein has something to lose, whereas a sample that already has low levels does not. This might be the case for IL-12(p40), IP-10, or MCP-1, where a higher mean concentration at baseline correlates with a steeper decline in concentration within that group.
Differences were also observed between kits; a significant increase in the TNF-α concentration was detected in the trauma cohort with the high-sensitivity kit but not with the standard sensitivity kit. This is likely due to low values that were more accurately measured with the high-sensitivity kit. With the standard sensitivity kit, the TNF-α levels measured were low enough that extrapolated values were required for some samples.
In addition to sample age at the time of processing, other factors may add further variability, such as temperature changes or agitation of samples associated with shipping, previously shown to impact cellular function (2, 3, 12). Ideally, whole-blood samples should be processed immediately following collection, but when this is not feasible, steps should be taken to minimize both the window between collection and processing and the variability between samples. This could be accomplished by keeping the window between collection and processing as short as possible and constant between samples.
Gaining access to fresh, high-quality samples is a common challenge in human research. Blood samples are often collected off site or under conditions that do not facilitate immediate processing, and often samples from various subjects are collected over long periods. It is therefore of critical importance to understand the amount of variability that can be introduced by using older blood samples and to minimize this variability when possible.
Acknowledgments
This work was supported by NIH R01 HL-083388-01A1.
Footnotes
Published ahead of print on 15 December 2010.
REFERENCES
- 1.Aziz, N., P. Nishanian, R. Mitsuyasu, R. Detels, and J. L. Fahey. 1999. Variables that affect assays for plasma cytokines and soluble activation markers. Clin. Diagn. Lab. Immunol. 6:89-95. [DOI] [PMC free article] [PubMed] [Google Scholar]
- 2.Betensky, R. A., et al. 2000. Shipment impairs lymphocyte proliferative responses to microbial antigens. Clin. Diagn. Lab. Immunol. 7:759-763. [DOI] [PMC free article] [PubMed] [Google Scholar]
- 3.Bull, M., et al. 2007. Defining blood processing parameters for optimal detection of cryopreserved antigen-specific responses for HIV vaccine trials. J. Immunol. Methods 322:57-69. [DOI] [PMC free article] [PubMed] [Google Scholar]
- 4.Cannon, J. G., et al. 1988. Interleukin-1β in human plasma: optimization of blood collection, plasma extraction, and radioimmunoassay methods. Lymphokine Res. 7:457-467. [PubMed] [Google Scholar]
- 5.Carlstedt, F., L. Lind, and B. Lindahl. 1997. Proinflammatory cytokines, measured in a mixed population on arrival in the emergency department, are related to mortality and severity of disease. J. Intern. Med. 242:361-365. [DOI] [PubMed] [Google Scholar]
- 6.Cook, M. C. 2001. Immunology of trauma. Trauma 3:79-88. [Google Scholar]
- 7.Engelberts, I., A. Moller, G. J. Schoen, C. J. van der Linden, and W. A. Buurman. 1991. Evaluation of measurement of human TNF in plasma by ELISA. Lymphokine Cytokine Res. 10:69-76. [PubMed] [Google Scholar]
- 8.Exley, A. R., and J. Cohen. 1990. Optimal collection of blood samples for the measurement of tumor necrosis factor alpha. Cytokine 2:353-356. [DOI] [PubMed] [Google Scholar]
- 9.Flower, L., R. H. Ahuja, S. E. Humphries, and V. Mohamed-Ali. 2000. Effects of sample handling on the stability of interleukin 6, tumour necrosis factor-alpha and leptin. Cytokine 12:1712-1716. [DOI] [PubMed] [Google Scholar]
- 10.Gårdlund, B., et al. 1995. Plasma levels of cytokines in primary septic shock in humans: correlation with disease severity. J. Infect. Dis. 172:296-301. [DOI] [PubMed] [Google Scholar]
- 11.Humar, A., et al. 1999. Elevated serum cytokines are associated with cytomegalovirus infection and disease in bone marrow transplant recipients. J. Infect. Dis. 179:484-488. [DOI] [PubMed] [Google Scholar]
- 12.Kierstead, L. S., et al. 2007. Enhanced rates and magnitude of immune responses detected against an HIV vaccine: effect of using an optimized process for isolating PBMC. AIDS Res. Hum. Retroviruses 23:86-92. [DOI] [PubMed] [Google Scholar]
- 13.Leroux-Roels, G., F. Offner, J. Philippe, and A. Vermeulen. 1988. Influence of blood-collecting systems on concentrations of tumor necrosis factor in serum and plasma. Clin. Chem. 34:2373-2374. [PubMed] [Google Scholar]
- 14.Mohty, M., et al. 2005. Inflammatory cytokines and acute graft-versus-host disease after reduced-intensity conditioning allogeneic stem cell transplantation. Blood 106:4407-4411. [DOI] [PubMed] [Google Scholar]
- 15.Molina, P. E. 2005. Neurobiology of the stress response: contribution of the sympathetic nervous system to the neuroimmune axis in traumatic injury. Shock (Augusta, Ga.) 24:3-10. [DOI] [PubMed] [Google Scholar]
- 16.Moretti, E., B. Basso, L. Cervetta, A. Brigada, and G. Barbieri. 2002. Patterns of cytokines and soluble cellular receptors in the sera of children with acute Chagas' disease. Clin. Diagn. Lab. Immunol. 9:1324-1327. [DOI] [PMC free article] [PubMed] [Google Scholar]
- 17.Nijm, J., A. Wikby, A. Tompa, A. G. Olsson, and L. Jonasson. 2005. Circulating levels of proinflammatory cytokines and neutrophil-platelet aggregates in patients with coronary artery disease. Am. J. Cardiol. 95:452-456. [DOI] [PubMed] [Google Scholar]
- 18.Prakash, D., et al. 2006. Clusters of cytokines determine malaria severity in Plasmodium falciparum-infected patients from endemic areas of Central India. J. Infect. Dis. 194:198-207. [DOI] [PubMed] [Google Scholar]
- 19.Riches, P., R. Gooding, B. C. Millar, and A. W. Rowbottom. 1992. Influence of collection and separation of blood samples on plasma IL-1, IL-6 and TNF-α concentrations. J. Immunol. Methods 153:125-131. [DOI] [PubMed] [Google Scholar]
- 20.Stacey, A. R., et al. 2009. Induction of a striking systemic cytokine cascade prior to peak viremia in acute human immunodeficiency virus type 1 infection, in contrast to more modest and delayed responses in acute hepatitis B and C virus infections. J. Virol. 83:3719-3733. [DOI] [PMC free article] [PubMed] [Google Scholar]
- 21.Thavasu, P. W., S. Longhurst, S. P. Joel, M. L. Slevin, and F. R. Balkwill. 1992. Measuring cytokine levels in blood. Importance of anticoagulants, processing, and storage conditions. J. Immunol. Methods 153:115-124. [DOI] [PubMed] [Google Scholar]
- 22.van Deuren, M., et al. 1995. Correlation between proinflammatory cytokines and antiinflammatory mediators and the severity of disease in meningococcal infections. J. Infect. Dis. 172:433-439. [DOI] [PubMed] [Google Scholar]


