Abstract
The objective of this study was to observe early markers of cell-mediated immunity in naïve calves infected with Mycobacterium avium subsp. paratuberculosis and how expression of these markers evolved over the 12-month period of infection. Groups for experimental infection included control (noninfected), oral (infected orally with M. avium subsp. paratuberculosis strain K-10), oral/DXM (pretreatment with dexamethasone before oral inoculation), intraperitoneal (i.p.) inoculation, and oral/M (oral inoculation with mucosal scrapings from a cow with clinical disease) groups. One of the earliest markers to emerge was antigen-specific gamma interferon (IFN-γ). Only i.p. inoculated calves had detectable antigen-specific IFN-γ responses at 7 days, with responses of the other infection groups becoming detectable at 90 and 120 days. All infection groups maintained robust IFN-γ responses for the remainder of the study. At 1 month, calves in the oral and oral/M groups had higher antigen-stimulated interleukin-10 (IL-10) levels than calves in the other treatment groups, but IL-10 secretion declined by 12 months for all calves. T-cell activation markers such as CD25, CD26, CD45RO, and CD5 were significantly upregulated in infected calves compared to noninfected controls. Oral inoculation of calves resulted in significantly increased antigen-specific lymphocyte proliferation at 9 and 12 months, as well as inducible nitric oxide synthase (iNOS) secretion at 6 and 12 months. These results demonstrate that infection of naïve calves with M. avium subsp. paratuberculosis invoked early immunologic responses characterized by robust antigen-specific IFN-γ responses and induction of CD25 and CD45RO expression on T-cell subsets. These were followed by antigen-specific lymphocyte proliferation, iNOS secretion, and expression of CD26 and CD5bright markers in the latter part of the 12-month study.
Deciphering host immune responses upon exposure to Mycobacterium avium subsp. paratuberculosis, differentiating the responses due to exposure from true infection, and then further characterizing responses at different stages of infection have been daunting and complex tasks that remain elusive. Early measures of host immune responses to infection with mycobacteria, including M. avium subsp. paratuberculosis, have been dominated by a strong bias toward Th1-mediated gamma interferon (IFN-γ) production. Higher levels of antigen-specific IFN-γ secreted by peripheral blood mononuclear cells (PBMCs) have been reported for animals in the early stages of M. avium subsp. paratuberculosis infection, whether it be natural or experimental infection (11, 18, 22, 24). Since IFN-γ is a key effector cytokine involved in the activation of T cells and macrophages, maturation of dendritic cells, upregulation of major histocompatibility complex (MHC) class I and II molecules, and production of reactive oxygen and nitrogen species by macrophages, it is purported to be not only an immune response variable but also a correlate of immune protection (7, 16). However, it is unlikely that the paradigm of host immune responses in the early stages of infection and subsequent resistance to infection is quite so simplistic. Rather, a complex coordination of immune responses is more probable, with these responses shifting as the host transitions through the different stages of infection and disease (subclinical to clinical).
Animal infection models are useful because they can provide a more insightful examination of responses of the naïve host to a singular pathogen. Two recent reviews summarized the efficacy of animal models for paratuberculosis in a wide range of species, including cattle, sheep, goats, deer and other wildlife, and rodents such as mice, rats, and rabbits (2, 8). The majority of experimental models for ruminants have utilized oral inoculation of live Mycobacterium avium subsp. paratuberculosis in order to establish infection, thereby mimicking the fecal-oral route of transmission generally observed in the field. Many of these studies utilized laboratory-adapted strains of M. avium subsp. paratuberculosis in the inocula, while a few studies demonstrated more effective results with clinical isolates of M. avium subsp. paratuberculosis (21, 23). Establishing a reproducible and effective challenge model for cattle, with well-defined host immune responses, is key to the interpretation of future work evaluating vaccines or therapeutics.
In the present study, we compared the effectiveness of oral suspensions of a clinical isolate of M. avium subsp. paratuberculosis and a low-passage laboratory strain. We further sought to evaluate the potential of dexamethasone (DXM) administration as an immunosuppressant to enhance infectivity in calves. Lastly, we adapted an intraperitoneal (i.p.) challenge model to neonatal calves and compared it to traditional oral inoculation methods. Although oral inoculation is the most favored mode of infection for M. avium subsp. paratuberculosis challenge models in ruminants, intraperitoneal inoculation has been used successfully in murine models (10). In addition, recent studies that involved surgical intervention to introduce M. avium subsp. paratuberculosis directly into the ileum resulted in colonization of tissues both locally and systemically (1, 25). We desired to mimic this effect without surgery by inoculating M. avium subsp. paratuberculosis directly into the peritoneal cavity. In the present study, measurements of the host cell-mediated immune responses to M. avium subsp. paratuberculosis infection were performed to ascertain the nature and vigor of responses shortly after exposure and over a protracted infection period. The upregulation of these early response variables was correlated with the degree of infectivity in the calves, as determined by the number of positive tissue sites.
MATERIALS AND METHODS
Animals.
Neonatal Holstein dairy calves were obtained from herds in Minnesota at 1 to 2 days of age. The farms were status level 4 herds enrolled in the Voluntary Bovine Johne's Control Program, with no reportable incidence of Johne's disease in the last 4 to 5 years and a 99% probability that they were free of paratuberculosis. Calves were housed in biosafety level 2 containment barns for the duration of the study, with control calves housed in a barn separate from the experimentally infected animals. Calves were allowed to acclimate to their environment for 1 week prior to the initiation of the study. Standard commercial milk replacer (Land O'Lakes, Shoreview, MN) was fed to calves twice per day at 10-h intervals during the acclimation and experimental infection periods. At 6 weeks of age, calves were weaned onto calf starter (Kent Feeds, Muscatine, IA) and then gradually switched over to a mixed pelleted ration for the remainder of the study. Blood and fecal samples were collected on 2 consecutive days prior to initiation of the study, followed by sampling on days 7, 14, and 28 and monthly thereafter for 12 months. All calves, regardless of inoculation route, were confirmed to be infected by culture of intestinal tissues and associated lymph nodes, as well as the spleen and liver, taken at necropsy (21).
Experimental infection of calves.
At 1 week of age, calves were assigned to the following treatment groups: (i) control noninfected (control) group (n = 4), (ii) oral group (n = 4), (iii) oral/DXM group (n = 4), (iv) i.p. group (n = 4), and (v) oral-mucosal (oral/M) group (n = 3). On day 0 of the study, the oral group was fed milk replacer containing, on average, 1 × 10¹¹ live M. avium subsp. paratuberculosis organisms of low-passage strain K-10, twice per day for 14 consecutive days. The oral/DXM group was treated similarly, except that the calves were administered 0.25 mg of DXM/kg of body weight (Azium; Schering Corp., Kenilworth, NJ) intravenously (i.v.) for 3 days prior to the first bacterial challenge on day 0 and then administered the same dosage of DXM on days 28 and 56 of the study. Intraperitoneal inoculation of calves was performed on days 0, 7, 14, and 21 of the study. Inoculation of a 1-ml volume of M. avium subsp. paratuberculosis (1011 bacteria) was performed through a 3-mm incision in the right flank after anesthetizing calves with 3 ml of 2% lidocaine HCl (IVX Animal Health, St. Joseph, MO) as previously described (21). Calves in the i.p. group were fed milk replacer twice per day without bacteria and were weaned onto solid diets at the same time points as calves in other treatment groups. The oral/M group calves were inoculated by being fed milk replacer containing 2.6 × 10¹² live M. avium subsp. paratuberculosis organisms obtained by scraping the ileal mucosa of a clinically infected cow. Calves were dosed on days 0, 7, and 14 of the study. All procedures performed on the animals were approved by the Institutional Animal Care and Use Committee of the National Animal Disease Center (NADC), Ames, IA.
Bacteria.
As previously described (21), Mycobacterium avium subsp. paratuberculosis strain K-10 was used for the inoculums for the oral, oral/DXM, and i.p. treatment groups. Calves in the oral/M treatment group were administered a clinical isolate of M. avium subsp. paratuberculosis obtained by scraping the ileal mucosa of a naturally infected cow in end-stage disease (cow 509). Aliquots of the mucosa (20 g) were dispensed into 50-ml sterile conical tubes and either prepped immediately for use in the study or frozen at −20°C for future use. The sample volume was brought up to 30 ml with phosphate-buffered saline (PBS) containing penicillin (200,000 IU/liter) and chloramphenicol (200 mg/liter), and samples were incubated for 30 min at room temperature. After incubation, samples were homogenized (Ultra-Turrax T25; IKA, Wilmington, NC), brought up to a final volume of 40 ml, and added to the milk replacer at the morning feeding.
The number of viable M. avium subsp. paratuberculosis cells in the inoculum preparations was verified by performing serial 10-fold dilutions of the stocks in PBS, followed by plating onto Herrold's egg yolk medium (HEYM; BD) in duplicate and culturing for 12 weeks at 39°C. Total colony counts were performed for each dilution, and the average count obtained for the highest dilution showing viable M. avium subsp. paratuberculosis cells was used to calculate the final concentration of the stock bacteria. Counts of viable bacteria recovered on HEYM from the inoculum preparations (6 for strain K-10 and 3 for the clinical isolate) averaged between 1 × 10¹⁰ and 1 × 10¹¹/ml for both the K-10 strain and the clinical isolate. Based upon average recovery of M. avium subsp. paratuberculosis by culture, approximate dosages of viable M. avium subsp. paratuberculosis during the study were 3.6 × 10¹² for oral and oral/DXM group calves, 4 × 10¹¹ for i.p. group calves, and 8 × 10¹² for oral/M group calves.
Blood collection and culture conditions.
Blood was collected from the jugular vein in 2× acid-citrate-dextrose (ACD; 1:10). For each animal, blood was collected on 2 consecutive days prior to initiation of the study, followed by sampling on days 7, 14, and 28 and monthly thereafter for 12 months. PBMCs were isolated from the buffy coat fractions of blood. PBMCs were resuspended in complete medium (RPMI-1640 [Gibco, Grand Island, NY] with 10% fetal calf serum [Atlanta Biologics, Atlanta, GA], 100 U of penicillin G sodium [Gibco] per ml, 100 μg of streptomycin sulfate [Gibco] per ml, 0.25 μg of amphotericin B [Gibco] per ml, and 2 mM l-glutamine [Gibco]). Cells were cultured at 2.0 × 10⁶/ml in replicate 48-well flat-bottomed plates (Corning Incorporated, Corning, NY) at 39°C in 5% CO2 in a humidified atmosphere. Duplicate wells were set up for each animal for each in vitro treatment. In vitro treatments consisted of no stimulation (NS; medium only), concanavalin A (ConA) (10 μg/ml; Sigma Chemical Co., St. Louis, MO), and a whole-cell sonicate of M. avium subsp. paratuberculosis (MPS; 10 μg/ml). After 24 h, one set of plates were removed and centrifuged at 400 × g for 5 min. Supernatants were removed without disturbing the cells in culture and were stored at −20°C prior to cytokine measurement. The replicate set of plates was incubated for 6 days, and cells were harvested for flow cytometric analyses.
Cytokine and inducible nitric oxide synthase (iNOS) analyses.
Bovine IFN-γ was measured by using a Bovigam test kit (Prionics, La Vista, NE) as described by the manufacturer. A standard curve was generated using recombinant bovine IFN-γ (3.12 to 100 ng/ml; Thermo Scientific, Rockford, IL). Bovine interleukin-10 (IL-10) was quantified by coating MaxiSorp microtiter plates (Nunc, Rochester, NY) with mouse anti-bovine IL-10 (MCA2110; Serotec, Raleigh, NC) in coating buffer (15 mM sodium carbonate, 34 mM sodium bicarbonate, pH 9.6; 100 μl per well at 2 μg/ml) overnight at room temperature (RT). Plates were washed 5 times with PBS containing 1% Tween 80 (washing buffer). The samples and serial 2-fold dilutions of a bovine IL-10 standard (0.3125 to 20 ng/ml) (a generous gift from Jayne Hope, Compton, United Kingdom) were added to duplicate wells and incubated at RT for 1 h. Plates were then washed 5 times with washing buffer before being incubated with the detection antibody, mouse anti-bovine IL-10-biotin (MCA2111B; Serotec, Raleigh, NC). Plates were washed 5 times with washing buffer, 100 μl of avidin-horseradish peroxidase (HRP) conjugate (diluted 1:800) (Pharmingen, San Diego, CA) was added to each well, and the plates were incubated for 45 min at RT. After another wash cycle, plates were incubated with substrate solution (40 mM ABTS [2,2′-azino-diethylbenzthiozoline-6-sulfonic acid] in citrate buffer [50 mM, pH 4.0]) and H2O2 (30% solution as a 1:30 dilution). Color development was quantified after 30 min by measuring the absorbance at 405 nm with a Wallac Victor 1420 multilabel counter plate reader (Perkin-Elmer, Gaithersburg, MD).
To determine the amount of nitric oxide produced (NO), the stable oxidation product nitrite was quantitated. For this analysis, 24-h cell culture supernatants from NS and ConA- and MPS-stimulated PBMCs were evaluated. The samples and serial 2-fold dilutions of sodium nitrate standard (0.028 to 18 μM) were added in duplicate to a 96-well round-bottom plate (Corning, Corning, NY). The culture supernatant (100 μl) was mixed with 100 μl of Greiss reagent (0.5% sulfanilamide; Sigma Chemical Co., St. Louis, MO) in 2.5% phosphoric acid (Mallinckrodt Chemical, Inc., Hazelwood, MO) and 0.05% N(1-naphthyl)ethylenediamine dihydrochloride (Sigma Chemical Co., St. Louis, MO). The mixture was allowed to incubate at RT for 10 min, and color development was measured at 505 nm. The concentration of nitrite in the supernatant was quantified by comparison with absorbance values of sodium nitrite standards within a linear curve fit.
Lymphocyte blastogenesis.
Peripheral blood mononuclear cells were plated at a density of 2 × 10⁵ cells/well in 96-well tissue culture plates in complete culture medium alone (NS) or containing 10 μg/ml of ConA or MPS as described above. Plates were incubated for 72 h, and then [3H]methylthymidine (5 μCi/well) was added for an additional 18 h. Cells were harvested on filter mats by use of a Tomtec harvester (Tomtec, Orange, CT) and were counted on a Wallac 1450 Microbeta Plus liquid scintillation counter (Wallac, Gaithersburg, MD). Results are expressed in counts per minute (cpm).
Flow cytometric analysis.
Briefly, 6-day culture plates were centrifuged at 1,500 rpm for 5 min, and the supernatant was decanted. Cells were gently resuspended in 300 μl of PBS (0.15 M, pH 7.4). In 96-well round-bottom plates (Corning Incorporated, Corning, NY), 50 μl of the cell suspension was added to wells containing 50 μl of primary monoclonal antibody (MAb) to CD4, CD8, γδ, CD25, CD26, CD5, or CD45RO (Table 1). All wells received 10 μg/ml of DAPI (4′,6-diamidino-2-phenylindole; Sigma) to differentiate live from dead cells and allow gating on viable cells. Cells were then incubated at 4°C for 30 min. After incubation, plates were centrifuged at 1,250 rpm for 2 min at 4°C and the supernatant decanted. One hundred microliters of secondary antibody cocktail consisting of fluorescein-conjugated anti-mouse IgM (Southern Biotech, Birmingham, AL), R-phycoerythrin (PE)-conjugated goat F(ab)2 anti-mouse IgG2a (Southern Biotech, Birmingham, AL), and peridinin-chlorophyll-protein complex-conjugated rat anti-mouse IgG1 (Becton Dickinson, San Jose, CA), diluted 1:312, 1:625, and 1:42, respectively, in PBS with 1% fetal calf serum and 0.04% sodium azide, was then added to designated wells, and the plate was centrifuged again at 1,250 rpm for 2 min at 4°C. The cells were then suspended in 200 μl of BD FacsLyse (BD Biosciences, San Jose, CA) for immediate flow cytometric analysis. Samples were evaluated using 30,000 events per sample on a FACScan flow cytometer with Cell Quest software (Becton Dickinson). Analysis was conducted by gating on mononuclear cells, based on forward and side scatter characteristics (FlowJo; Tree Star, Inc., San Carlos, CA). The percentages of CD4-, CD8-, γδ-, CD25-, CD26-, CD45RO-, and CD5bright-positive cells were determined and are presented for MPS-stimulated PBMCs. Marker expression was fairly consistent for NS and ConA-stimulated PBMCs, regardless of infection group, so these data are not presented.
TABLE 1.
Primary antibodies used for this studya
| Antigen | MAb clone | Isotype | Working MAb concnb (μg/ml) | Specificity |
|---|---|---|---|---|
| CD4 | GC50A1 | IgM | 14 | T-helper cell |
| CD5 | B29a | IgG2a | 7 | Activation marker |
| CD8 | BAQ111A | IgM | 14 | T-cytotoxic/suppressor cell |
| CD25 | CACT116A | IgG1 | 15 | IL-2 receptor |
| CACT108A | IgG2a | 15 | ||
| LCTB2A | IgG3 | 15 | ||
| CD26 | CACT114A | IgG2b | 15 | Activation marker |
| CD45RO | GC42A1 | IgG1 | 10 | Memory/activation marker |
| N12 | CACT61A | IgM | 14 | γδ-Cell receptor |
Obtained from VMRD Inc. (Pullman, WA).
Diluted in PBS with 1% fetal calf serum and 0.04% sodium azide.
For intracellular IFN-γ and IL-10 analyses, PBMCs were incubated as described above with medium only, ConA, or MPS for 48 h. During the terminal 5 h of incubation, brefeldin A (final concentration, 10 μg/ml) (Sigma), ionomycin A (final concentration, 1 μg/ml) (Sigma), and phorbol myristate acetate (final concentration, 50 ng/ml) (Sigma) were added to each well. Aliquots (50 μl) of stimulated cells were transferred to 4 replicate wells in a 96-well round-bottom plate and incubated with 50 μl each of primary MAbs for phenotype analysis (CD4, CD8, and γδ antibodies in Table 1) or with PBS as an isotype control for 15 min at room temperature. Plates were centrifuged at 1,250 rpm for 5 min, supernatants were decanted, and cells were washed once with 200 μl/well of PBS. Cells were then incubated with 50 μl of secondary antibody (fluorescein-conjugated anti-mouse IgM; Southern Biotech) for 15 min at room temperature in the dark. After incubation and one wash with PBS, cells were incubated with fixation medium (Caltag Laboratory, Burlingame, CA) for 15 min at room temperature in the dark. After 2 washes with PBS, permeabilization medium (Caltag Laboratory) and 50 μl of cytokine MAb (anti-bovine IFN-PE or anti-bovine IL-10; Serotec) or PBS (isotype control) were incubated with cells for 15 min at room temperature in the dark. After two washes with PBS, 50 μl of secondary MAb [R-phycoerythrin-conjugated goat F(ab)2 anti-mouse IgG2b; Southern Biotech] was added to wells for IL-10 staining and incubated for 15 min in the dark. Cells were washed once with PBS and resuspended in 200 μl of FacsLyse solution. Data were acquired immediately for 20,000 events/sample, using an LSR flow cytometer and Cell Quest software.
For all cell culture analyses, nonstimulated (medium control) cultures were included to measure constitutive responses to infection and ConA-stimulated cultures were included as positive controls to determine general cell reactivity. However, due to the number of treatment groups and time points within the study, it was not possible to depict or discuss all of these data, and the focus here is primarily on antigen-specific responses.
Statistical analysis.
Percentages of each cell population were analyzed by using the PROC MIXED analysis of SAS (PROC MIXED in SASPC Windows, version 9.1.3). Values are reported as least-squares means ± standard errors of the means (SEM) unless noted otherwise. When significant effects (P < 0.05) owing to treatment, day, or treatment-day interactions were detected, mean comparisons between the control group and infected treatment groups were conducted by the Tukey-Kramer post hoc test.
RESULTS
Previously, our laboratory published data from this study demonstrating that the route of experimental inoculation with M. avium subsp. paratuberculosis (oral versus intraperitoneal) and the strain of M. avium subsp. paratuberculosis used for inoculation (laboratory strain versus clinical isolate) impacted the degree of tissue colonization over a 12-month infection period (21). In that paper, we reported that calves orally inoculated with a clinical isolate of M. avium subsp. paratuberculosis (oral/M group) had the largest number of positive tissue sites (15/22 sites), whereas i.p. group calves had the smallest number (8.5/15 sites) (Table 2). For the most part, bacterial burdens within tissues were low, with the exception of 1 oral/M group calf who had a large number of M. avium subsp. paratuberculosis organisms. Interestingly, calves treated with dexamethasone prior to oral inoculation with M. avium subsp. paratuberculosis (oral/DXM group) had the largest numbers of tissues with lesions, followed by oral and oral/M group calves and, lastly, i.p. group calves. Since the degree of tissue pathology was fairly minor in this study, it did not appear to influence the immune parameters measured. However, oral/M group calves did have more robust responses for some immune measures, suggesting that the degree of tissue infectivity had a demonstrable effect on host response.
TABLE 2.
Average numbers of tissues positive by culture and histopathology among tissues obtained from calves at necropsy 12 months following oral or intraperitoneal challenge with live Mycobacterium avium subsp. paratuberculosisa
| Tissued | % Positive tissues for treatment group (unless stated otherwise) |
|||
|---|---|---|---|---|
| Oral | i.p. | Oral/DXM | Oral/M | |
| Jejunum + LN (proximal, mid-, and distal)b | 54 | 25 | 42 | 67 |
| Ileum + LN (proximal, mid-, and distal)c | 17 | 25 | 17 | 50 |
| Duodenum + LN | 50 | 50 | 38 | 50 |
| Ileocecal valve | 50 | 100 | 50 | 67 |
| Ileocecal LN | 25 | 50 | 0 | 33 |
| Spleen | 50 | 100 | 50 | 33 |
| Iliac LN | 75 | 50 | 50 | 33 |
| Spiral colon + LN | 63 | 25 | 38 | 50 |
| Transcending colon + LN | 13 | 13 | 25 | 50 |
| Descending colon + LN | 25 | 0 | 13 | 17 |
| Avg no. of positive tissue sites | 10.3 | 8.5 | 9.5 | 15 |
| Avg no. of tissues with lesions | 19 | 8 | 31 | 15 |
The total number of tissue sites sampled per calf was 22.
Three sections of the jejunum (proximal, mid-, and distal sections) plus three associated lymph nodes (n = 6) were sampled.
Three sections of the ileum (proximal, mid-, and distal sections) plus one associated lymph node (n = 4) were sampled.
Tissue + LN, the lymph node (LN) associated with that tissue site was also collected (n = 2 tissue sites).
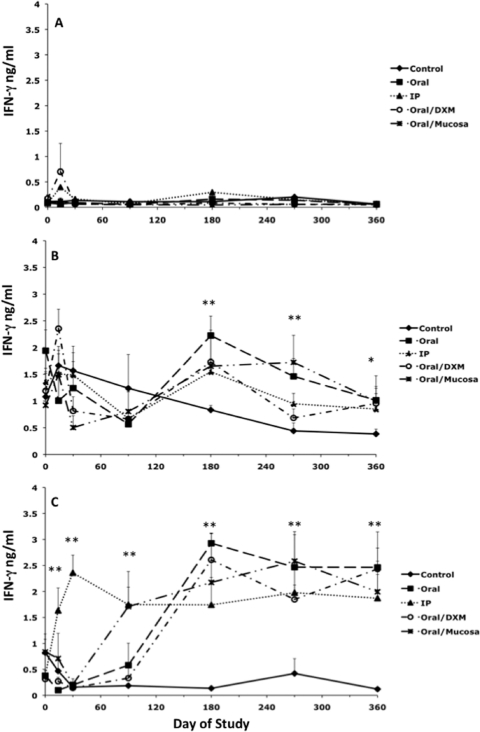
A temporal analysis of secreted IFN-γ after stimulation of cells with medium alone (NS), ConA, or MPS is presented in Fig. 1. Secretion of IFN-γ was negligible for NS cultures at all time points, regardless of treatment group (Fig. 1A), whereas responses to ConA stimulation were robust for all treatment groups throughout the study (Fig. 1B). Early time points were included within these analyses to demonstrate the rapidity of PBMC responses to antigen stimulation. Infection of calves by the i.p. route led to the earliest detection of antigen-specific IFN-γ responses, with significantly more (P < 0.01) IFN-γ secretion beginning on day 7 for i.p. group calves than for control calves, an effect that continued throughout the 12-month study (Fig. 1C). Responses for oral/M group calves began to emerge by day 90 (P < 0.01), with other treatment groups following this trend by day 180 and continuing to remain at this high level of responsiveness (P < 0.01) throughout the study. Overall, a highly significant (P < 0.01) day effect was noted for infected calves during the experimental period. As expected, antigen-specific IFN-γ responses were negligible for control calves.
FIG. 1.
Secretion of IFN-γ (ng/ml) by PBMCs isolated from control noninfected calves (⧫) and calves infected with Mycobacterium avium subsp. paratuberculosis by the following methods: oral (▪), intraperitoneal (▴), oral with dexamethasone administration (○), and oral with mucosal scrapings from a cow with clinical disease (✳). IFN-γ secretion during the 12-month study was measured in nonstimulated PBMCs (A), PBMCs stimulated with ConA (B), and PBMCs stimulated with a whole-cell sonicate of Mycobacterium avium subsp. paratuberculosis (MPS) (C). Data are expressed as means ± SEM. Significant differences between control and infection groups within given time points are represented by asterisks (**, P < 0.01; *, P < 0.05).
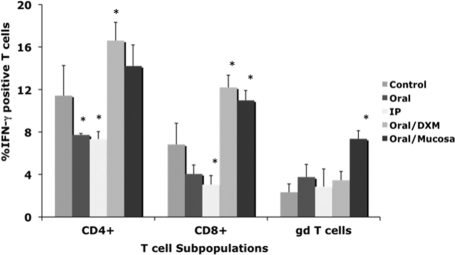
Differences in intracellular IFN-γ within T-cell subpopulations (CD4, CD8, and γδ T cells) due to M. avium subsp. paratuberculosis infection were variable until 12 months (Fig. 2). Oral/M group calves had the most consistent (P < 0.05) responses for all T-cell subsets. Increased (P < 0.05) intracellular IFN-γ in CD4 and CD8 cells was also observed for oral/DXM group calves at 12 months, whereas it was decreased (P < 0.05) for oral and i.p. group calves.
FIG. 2.
Percentages of IFN-γ+ T cells among PBMCs isolated from control noninfected calves and calves infected with Mycobacterium avium subsp. paratuberculosis by the following methods: oral, intraperitoneal, oral with dexamethasone administration, and oral with mucosal scrapings from a cow with clinical disease. Percentages of IFN-γ+ T cells were determined at 12 months for CD4, CD8, and γδ T-cell subpopulations stimulated with a whole-cell sonicate of Mycobacterium avium subsp. paratuberculosis (MPS). Data are expressed as means ± SEM. Significant differences between control and infection groups within the 12-month time point are represented by asterisks (*, P < 0.05).
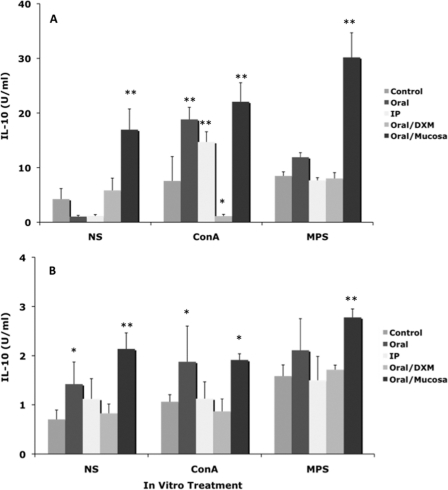
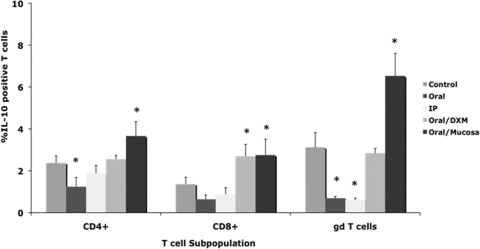
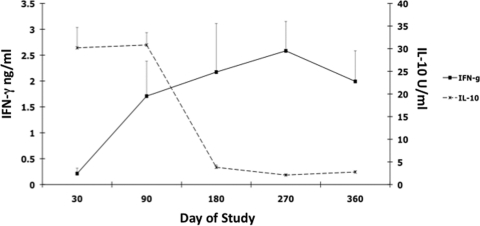
Inoculating calves with a clinical isolate of M. avium subsp. paratuberculosis (oral/M group) invoked more (P < 0.01) IL-10 secretion than infection with the laboratory strain (Fig. 3). IL-10 secretion was more robust in the early time points of the 12-month study, with reductions of almost 90% between 1 and 12 months for most treatment groups, regardless of in vitro stimulant (Fig. 3). For the most part, intracellular IL-10 responses for infected calves were not different from those for controls during the study (Fig. 4). Although effects were noted for other infection groups, oral/M group calves had more consistent responses, with moderate increases in intracellular IL-10 noted at 6 months (data not shown) and significantly (P < 0.01) higher intracellular IL-10 for CD4, CD8, and γδ T cells at 12 months (Fig. 4). Interestingly, the trend for declining IL-10 observed for oral/M group calves paralleled the increase in antigen-specific IFN-γ responses between 1 and 12 months of the study (Fig. 5).
FIG. 3.
Secretion of IL-10 (U/ml) at 1 month (A) and 12 months (B) by PBMCs isolated from control noninfected calves and calves infected with Mycobacterium avium subsp. paratuberculosis by the following methods: oral, intraperitoneal, oral with dexamethasone administration, and oral with mucosal scrapings from a cow with clinical disease. Note that the scales on the x axes in panels A and B are different. PBMCs were nonstimulated (NS) or stimulated with ConA or a whole-cell sonicate of Mycobacterium avium subsp. paratuberculosis (MPS). Data are expressed as means ± SEM. Significant differences between control and infection groups within given time points are represented by asterisks (**, P < 0.01; *, P < 0.05).
FIG. 4.
Percentages of IL-10+ T cells among PBMCs isolated from control noninfected calves and calves infected with Mycobacterium avium subsp. paratuberculosis by the following methods: oral, intraperitoneal, oral with dexamethasone administration, and oral with mucosal scrapings from a cow with clinical disease. Percentages of IL-10+ T cells were measured at 12 months within CD4, CD8, and γδ T-cell subpopulations stimulated with a whole-cell sonicate of Mycobacterium avium subsp. paratuberculosis (MPS). Data are expressed as means ± SEM. Significant differences between control and infection groups within given time points are represented by asterisks (*, P < 0.05).
FIG. 5.
Diagram demonstrating the phasic nature of secreted antigen-specific IFN-γ and IL-10 during the 12-month study by PBMCs isolated from calves infected with Mycobacterium avium subsp. paratuberculosis from mucosal scrapings from a cow with clinical disease (oral/M group).
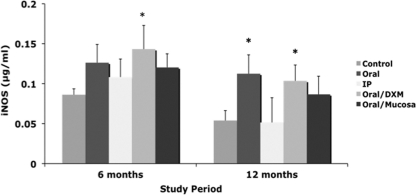
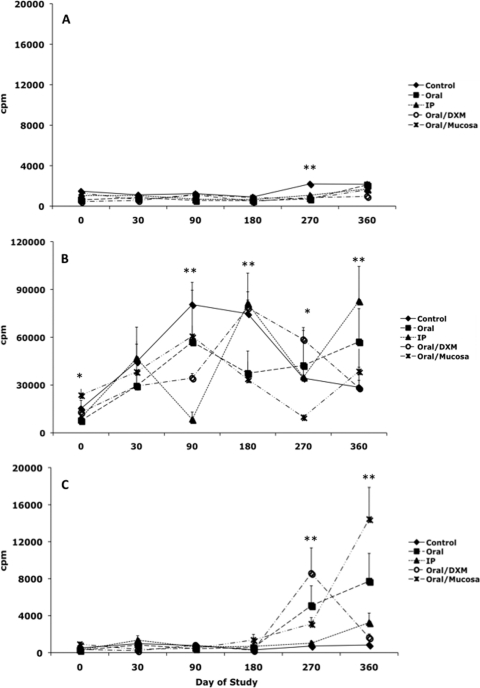
Secretion of iNOS by MPS-stimulated PBMCs was elevated for infected calves at 6 months compared to control calves, but this was significant only for oral/DXM group calves (Fig. 6). By 12 months, iNOS secretion was higher for all orally inoculated calves, but this was significant only for oral (P < 0.01) and oral/DXM (P < 0.05) group calves. Earlier time points did not yield any definitive effects due to infection, and therefore these data are not shown. Antigen-specific lymphocyte proliferation responses to MPS were not observed until day 270 and were significantly (P < 0.01) higher for oral, oral/DXM, and oral/M group calves than for control calves (Fig. 7 C). By 360 days, proliferation responses had declined for oral/DXM group calves but continued to increase for oral, i.p., and oral/M group calves, with oral/M group calves having the highest (P < 0.01) responses to MPS.
FIG. 6.
Secretion of iNOS by PBMCs isolated from control noninfected calves and calves infected with Mycobacterium avium subsp. paratuberculosis by the following methods: oral, intraperitoneal, oral with dexamethasone administration, and oral with mucosal scrapings from a cow with clinical disease. PBMCs were stimulated with a whole-cell sonicate of Mycobacterium avium subsp. paratuberculosis (MPS) at 6 and 12 months. Data are expressed as means ± SEM. Significant differences between control and infection groups within given time points are represented by asterisks (*, P < 0.05).
FIG. 7.
Lymphocyte proliferation responses (cpm) by PBMCs isolated from control noninfected calves (⧫) and calves infected with Mycobacterium avium subsp. paratuberculosis by the following methods: oral (▪), intraperitoneal (▴), oral with dexamethasone administration (○), and oral with mucosal scrapings from a cow with clinical disease (✳). Lymphocyte proliferation responses during the 12-month study were measured in nonstimulated PBMCs (A), PBMCs stimulated with ConA (B), and PBMCs stimulated with a whole-cell sonicate of Mycobacterium avium subsp. paratuberculosis (MPS) (C). Data are expressed as means ± SEM. Significant differences between control and infection groups within given time points are represented by asterisks (**, P < 0.01; *, P < 0.05).
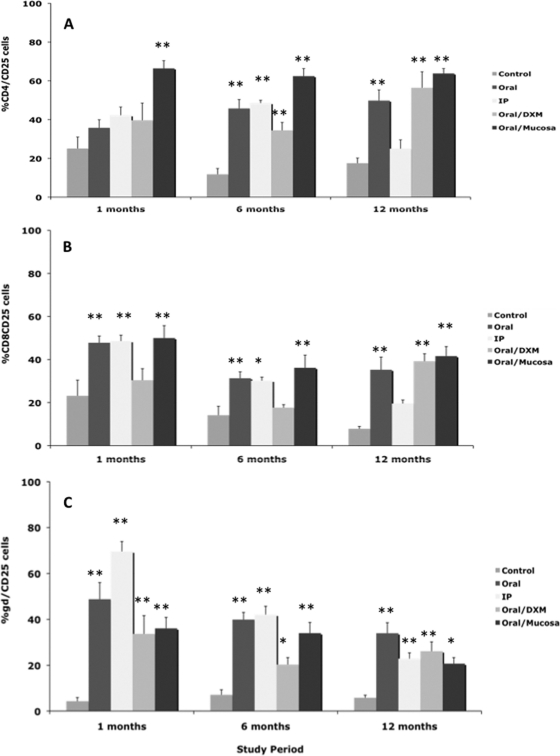
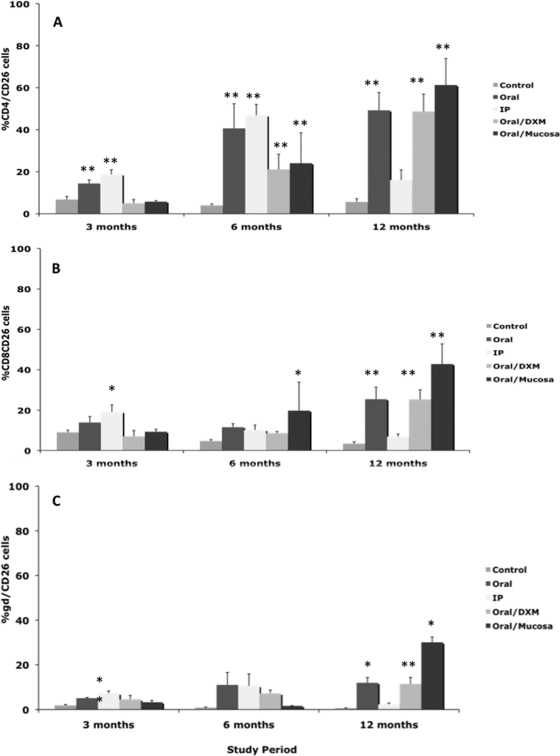
An upregulation of CD25 expression on CD4, CD8, and γδ T-cell subpopulations in M. avium subsp. paratuberculosis-infected calves was observed by 1 month (Fig. 8 A, B, and C). CD25 expression on CD4 T cells was significantly (P < 0.01) higher only for oral/M group calves at 1 month but was highly upregulated on CD8 and γδ T cells for other infection groups (Fig. 8A, B, and C). A similar pattern of upregulation of CD25 on CD4, CD8, and γδ T cells was observed for infected calves at 6 and 12 months, but expression had begun to decline at 12 months for i.p. group calves compared to other infection groups (Fig. 8). Expression of CD26 was also determined within T-cell subsets, but due to technical difficulty, the earliest reportable time point was 3 months (Fig. 9). At 3 months, expression of CD26 was relatively low (<20% of cells) but was consistently higher (P < 0.01) for i.p. group calves across all T-cell subsets. Following 6 months of infection, CD4 and CD26 expression was highly (P < 0.05) upregulated for all infected calves compared to controls. More robust CD26 responses were noted at 12 months, with consistent upregulation noted on CD4, CD8, and γδ T-cell subpopulations for oral, oral/DXM, and oral/M group calves but not i.p. group calves.
FIG. 8.
Percentages of CD25+ T cells among PBMCs isolated from control noninfected calves and calves infected with Mycobacterium avium subsp. paratuberculosis by the following methods: oral, intraperitoneal, oral with dexamethasone administration, and oral with mucosal scrapings from a cow with clinical disease. Percentages of CD25+ T cells during the 12-month study were measured within CD4 (A), CD8 (B), and γδ (C) T-cell subpopulations stimulated with a whole-cell sonicate of Mycobacterium avium subsp. paratuberculosis (MPS). Data are expressed as means ± SEM. Significant differences between control and infection groups within given time points are represented by asterisks (**, P < 0.01; *, P < 0.05).
FIG. 9.
Percentages of CD26+ T cells among PBMCs isolated from control noninfected calves and calves infected with Mycobacterium avium subsp. paratuberculosis by the following methods: oral, intraperitoneal, oral with dexamethasone administration, and oral with mucosal scrapings from a cow with clinical disease. Percentages of CD26+ T cells during the 12-month study were measured within CD4 (A), CD8 (B), and γδ (C) T-cell subpopulations stimulated with a whole-cell sonicate of Mycobacterium avium subsp. paratuberculosis (MPS). Data are expressed as means ± SEM. Significant differences between control and infection groups within given time points are represented by asterisks (**, P < 0.01; *, P < 0.05).
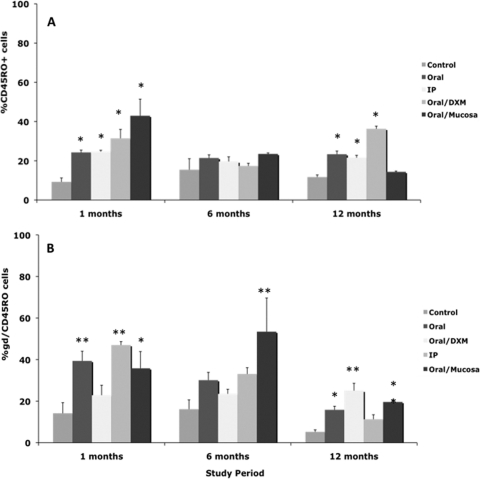
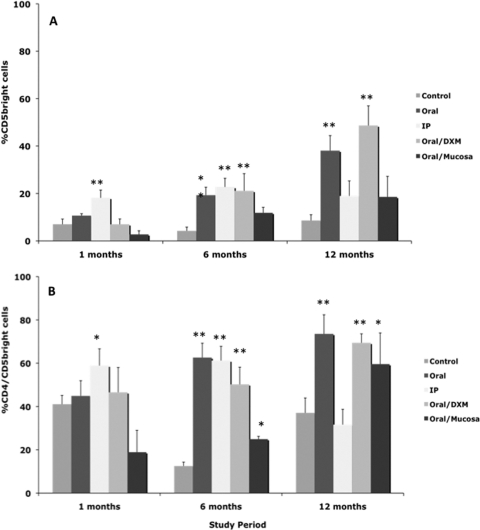
Expression of CD45RO on total PBMCs after stimulation with MPS also proved to be a useful marker of infection in calves at points as early as 1 month (Fig. 10 A). Similar trends for upregulated CD45RO expression on MPS-stimulated PBMCs from infected calves compared to control calves were observed on other sampling dates as well (data not shown). The majority of these responses can be credited to a similar increase in expression of CD45RO on the γδ T-cell subpopulation (Fig. 10B), whereas variable responses were noted on CD4 and CD8 T cells (data not shown). Expression of the CD5bright marker was also upregulated on MPS-stimulated PBMCs from infected calves compared to control calves throughout the 12-month study (Fig. 11). The percentage of CD5bright cells in the total PBMC population increased over the period of the study, ranging from 2.7 to 18.2% at 1 month to 8.6 to 48.7% at 12 months. This increase in CD5bright expression on total PBMCs paralleled an increase in the CD4 subpopulation for infected calves (Fig. 11B). The upregulation of CD5bright on CD4 cells was most significant (P < 0.01) at 6 and 12 months.
FIG. 10.
Percentages of CD45RO+ T cells among PBMCs isolated from control noninfected calves and calves infected with Mycobacterium avium subsp. paratuberculosis by the following methods: oral, intraperitoneal, oral with dexamethasone administration, and oral with mucosal scrapings from a cow with clinical disease. Percentages of CD45RO+ T cells during the 12-month study were measured within total PBMCs (A) and γδ T cells (B) stimulated with a whole-cell sonicate of Mycobacterium avium subsp. paratuberculosis (MPS). Data are expressed as means ± SEM. Significant differences between control and infection groups within given time points are represented by asterisks (**, P < 0.01; *, P < 0.05).
FIG. 11.
Percentages of CD5bright T cells among PBMCs isolated from control noninfected calves and calves infected with Mycobacterium avium subsp. paratuberculosis by the following methods: oral, intraperitoneal, oral with dexamethasone administration, and oral with mucosal scrapings from a cow with clinical disease. Percentages of CD5bright T cells during the 12-month study were measured within total PBMCs (A) and CD4+ T cells (B) stimulated with a whole-cell sonicate of Mycobacterium avium subsp. paratuberculosis (MPS). Data are expressed as means ± SEM. Significant differences between control and infection groups within given time points are represented by asterisks (**, P < 0.01; *, P < 0.05).
DISCUSSION
The early acquisition of antigen-specific IFN-γ responses by calves in the present study clearly demonstrated the utility of using secreted IFN-γ as an indicator of infection with M. avium subsp. paratuberculosis. Antigen-specific IFN-γ responses were robust for all infected calves, regardless of treatment group, by 6 months of infection. This suggests that bacterial load is not a major factor in the elicitation of an IFN-γ response, since tissue infectivity was higher for oral/M group calves. Previously, it was demonstrated that antigen-specific IFN-γ responses could be useful to differentiate early (paucibacillary) and late (multibacillary) stages of paratuberculosis in older cows ranging from 3 to 9 years old (17). In the present study, calves were deemed infected if there was recovery of viable M. avium subsp. paratuberculosis from at least one tissue, and all calves fit this criterion, regardless of inoculation route (21). This did not allow the interpretation of IFN-γ responses after “exposure” of calves to M. avium subsp. paratuberculosis without actual infection, as it is thought that exposure may invoke similarly robust but more transient IFN-γ responses (5). The appearance of IFN-γ responses on day 7 for i.p. inoculated calves was surprising and suggests that a peripheral signal to M. avium subsp. paratuberculosis was stimulated appropriately through draining lymph nodes in the peritoneal cavity. Although there was no indication at the end of the 12-month study that i.p. group calves had greater colonization in the draining lymph nodes than calves in the other treatment groups, effects may have been transient. In addition, any impact due to potential differences in virulence between the K-10 strain and the clinical isolate of M. avium subsp. paratuberculosis used for the inoculums was not detected in the degree of IFN-γ responses between treatment groups. Overtly, there was no significant correlation between host immune responses and tissue pathology in individual calves. A moderate correlation seemed apparent for IFN-γ responses, but since few calves had marked pathological lesions, it was difficult to discern if this effect was real.
An upregulation of intracellular IFN-γ within CD4+ T cells was shown previously for experimentally infected calves (24), but in the present study, it was also noteworthy for CD8+ T cells, suggesting that these subpopulations may be key responders for IFN-γ secretion in active M. avium subsp. paratuberculosis infection. Overall, intracellular IFN-γ did not appear to have tremendous value as an early indicator of M. avium subsp. paratuberculosis infection, as it was variable throughout the study.
An upregulation of antigen-specific iNOS has been associated with subclinical M. avium subsp. paratuberculosis infection in cattle (12), and iNOS was upregulated in infected calves in the latter part of the present study. As a product of activated macrophages, the iNOS response aligned itself with the robust IFN-γ responses noted for infected calves after 180 days, suggesting that these two markers may be induced to activate macrophages and control M. avium subsp. paratuberculosis replication within the host. A concurrent decline in IL-10 responses was noted for all calves by 12 months, including a lesser decline for control calves; however, the degree and the somewhat linear manner in which IL-10 declined for oral/M group calves suggest that this effect was due to the method of inoculation rather than to an age-related effect. During the transition from subclinical to a more advanced clinical state of paratuberculosis, a switch from Th1- to Th2-mediated immune responses, characterized by increased Th2 cytokines (IL-4 and IL-10), is generally noted (6, 11). Although IL-10 is known to inhibit IFN-γ production through a negative-feedback mechanism designed to limit proinflammatory tissue damage, conversely, IFN-γ is also an effective inhibitor of IL-10 (9). Interestingly, the paradigm demonstrating robust protracted IFN-γ responses and transient IL-10 responses in this study (Fig. 4) is paralleled for IFN-γ and IL-4 responses in calves infected with M. bovis (14).
Despite the fact that some nontraditional modes of experimental infection were attempted in this study, we were still skeptical that infected calves would transition to an advanced disease state within the 12-month period. Not surprisingly, all infected calves remained asymptomatic during the study, shedding very little M. avium subsp. paratuberculosis in their feces, and very small numbers of M. avium subsp. paratuberculosis were recovered from tissues at necropsy. Whether IFN-γ was a factor in the maintenance of the experimental calves in an asymptomatic state is unknown. Regardless, the cumulative results of increased antigen-specific IFN-γ, iNOS, and lymphocyte proliferative responses suggest that T cells were highly activated, promoting subsequent activation of monocyte/macrophage populations.
This was further evidenced by the upregulation of activation markers on T-cell subsets after stimulation of cells with antigen. Increased expression of CD25, CD26, and CD45RO on CD4+ T cells has been demonstrated previously for naturally infected cattle and for experimentally infected calves (13, 19, 24), and this effect was repeated in this study. We also demonstrated a significant presence of CD4 CD5bright cells in infected calves, particularly toward the latter part of the study. Previously, we had shown that the CD5 activation marker was able to delineate between stages of disease in naturally infected cattle, with greater expression noted for subclinically infected cattle (20). In the present study, we also observed dominant populations of memory CD8 and γδ T cells, an effect that contrasted with those for other experimental M. avium subsp. paratuberculosis infection models (25). Overall, CD25 was the most prolific marker present on all T-cell subsets, with substantial upregulation in infected calves throughout the study. Although this could be indicative of regulatory T-cell populations, the fact that we observed declining antigen-specific IL-10 responses during the study indicates otherwise. In a recent study evaluating host immune responses for naturally infected sheep in different stages of disease, it was noted that sheep with paucibacillary disease had larger numbers of CD25 cells in the blood than asymptomatic sheep (culture positive and histopathology negative) and sheep with multibacillary disease (7a). This would align itself with the histopathologic results obtained for calves in the present study, as we were able to demonstrate lesions in all infection groups but not in all calves within each group. Perhaps the frequency of CD25 expression within CD4, CD8, and γδ T cells indicates a phenotype suggestive of an activated immune response that is helpful in limiting disease within the host but is disassociated from IL-10 responses.
It is interesting that we observed CD26 expression much later in the study than CD25 expression and that this expression aligned itself most closely with CD4+ T cells. CD26 has a known function as an activation marker for T cells, B cells, NK cells, and macrophages but has also been cited as a maturation marker for T lymphocytes (4). Upon stimulation of Th1 and Th2 cell lines, it was demonstrated that CD26 expression was 3- to 6-fold higher on Th1 cells, which further correlated with higher intracellular IFN-γ levels (4). This association of CD26 expression with IFN-γ production was also noted for tissue biopsy specimens from patients with tuberculoid leprosy but not for those from patients with lepromatous leprosy, indicating that CD26 is a marker of early stages of M. leprae infection, much like the case reported here (15).
Another interesting note was the predominant expression of the CD45RO marker on the γδ T-cell subset, rather than the previously described CD4 marker. Although limited information is available for cattle, it appears that CD45RO is primarily a marker of antigen memory on CD4 and CD8 T cells and may act more like an activation marker on γδ T cells (3). Additionally, the γδ CD45RO+ cell population decreased over the study, an effect that is in agreement with a previous report that this phenotype is most notable in neonates and declines with age (3). In the present study, the experimental methods of infection resulted in an asymptomatic state, with tissues positive for M. avium subsp. paratuberculosis and lesions characteristic of granulomatous disease. Activation of host immune responses occurred in all infected calves, regardless of experimental route, but occurred more frequently in calves orally inoculated with M. avium subsp. paratuberculosis, with oral/M group calves maintaining the most comparable responses across CD4+, CD8+, and γδ T-cell subsets. Early immunologic responses included robust antigen-specific IFN-γ responses as well as induction of antigen-specific CD25 and CD45RO expression. In contrast, immune responses such as antigen-specific lymphocyte proliferation, iNOS secretion, and expression of CD26 and CD5bright markers were upregulated in the latter part of the 12-month study. These data indicate that introduction of naïve animals to M. avium subsp. paratuberculosis may invoke very specific markers of early immune responses that can potentially be used for diagnosis of infection. A clear statement of how host immunity was affected by the M. avium subsp. paratuberculosis burden within tissues cannot be made based upon this study alone. It is highly likely that even a short-term study of 12 months resulted in animals that were transiently infected and perhaps cleared the infection or were able to reduce the burden in specific tissues. This theory suggests that more intensive studies need to be performed to evaluate host immune responses and correlate them to temporal changes in tissue infectivity over a protracted experimental period.
Acknowledgments
We thank Trudy Tatum, Tonia McNunn, Megan Parlett, and Margaret Walker for their excellent technical assistance, as well as Paul Amundson and Jerri Grove for their excellent care of the animals in this study.
This study was supported by a USDA-NRICAP (Johne's Disease Integrated Program) grant.
Footnotes
Published ahead of print on 12 January 2011.
REFERENCES
- 1.Allen, A. J., et al. 2009. Development of a bovine ileal cannulation model to study the immune response and mechanisms of pathogenesis of paratuberculosis. Clin. Vaccine Immunol. 16:453-463. [DOI] [PMC free article] [PubMed] [Google Scholar]
- 2.Begg, D. J., and R. J. Whittington. 2008. Experimental animal infection models for Johne's disease, an infectious enteropathy caused by Mycobacterium avium subsp. paratuberculosis. Vet. J. 176:129-145. [DOI] [PubMed] [Google Scholar]
- 3.Bembridge, G. P., et al. 1995. CD45RO expression on bovine T cells: relation to biological function. Immunology 86:537-544. [PMC free article] [PubMed] [Google Scholar]
- 4.Boonacker, E. P., E. A. Wierenga, H. H. Smits, and C. J. F. Van Noorden. 2002. CD26/DPPIV signal transduction function, but not proteolytic activity, is directly related to its expression level on human Th1 and Th2 cell lines as detected with living cell cytochemistry. J. Histochem. Cytochem. 50:1169-1177. [DOI] [PubMed] [Google Scholar]
- 5.Buddle, B. M., D. N. Wedlock, M. Denis, and M. A. Skinner. 2005. Identification of immune response correlates for protection against bovine tuberculosis. Vet. Immunol. Immunopathol. 108:45-51. [DOI] [PubMed] [Google Scholar]
- 6.Coussens, P. M., N. Verman, M. A. Coussens, M. D. Elftman, and A. M. McNulty. 2004. Cytokine gene expression in peripheral blood mononuclear cells and tissues of cattle infected with Mycobacterium avium subsp. paratuberculosis: evidence for an inherent proinflammatory gene expression pattern. Infect. Immun. 72:1409-1422. [DOI] [PMC free article] [PubMed] [Google Scholar]
- 7.Delvig, A. A., J. J. Lee, Z. M. Chrzanowska-Lightowlers, and J. H. Robinson. 2002. TGF-beta1 and IFN-gamma cross-regulate antigen presentation to CD4 T cells by macrophages. J. Leukoc. Biol. 72:163-166. [PubMed] [Google Scholar]
- 7a.Gillan, S., R. O'Brien, A. D. Hughes, and J. F. Griffin. 2010. Identification of immune parameters to differentiate disease states among sheep infected with Mycobacterium avium subsp. paratuberculosis. Clin. Vaccine Immunol. 17:108-117. [DOI] [PMC free article] [PubMed] [Google Scholar]
- 8.Hines, M. E., II, et al. 2007. Experimental challenge models for Johne's disease: a review and proposed international guidelines. Vet. Microbiol. 122:197-222. [DOI] [PubMed] [Google Scholar]
- 9.Hu, X., et al. 2006. IFN-γ suppresses IL-10 production and synergizes with TLR2 by regulating GSK3 and CREB/AP-1 proteins. Immunity 24:563-574. [DOI] [PubMed] [Google Scholar]
- 10.Huntley, J. F., J. R. Stabel, M. L. Paustian, T. A. Reinhardt, and J. P. Bannantine. 2005. Expression library confers protection against Mycobacterium avium subsp. paratuberculosis infection. Infect. Immun. 73:6877-6884. [DOI] [PMC free article] [PubMed] [Google Scholar]
- 11.Khalifeh, M. S., and J. R. Stabel. 2004. Effects of gamma interferon, interleukin-10, and transforming growth factor beta on the survival of Mycobacterium avium subsp. paratuberculosis in monocyte-derived macrophages from naturally infected cattle. Infect. Immun. 74:1974-1982. [DOI] [PMC free article] [PubMed] [Google Scholar]
- 12.Khalifeh, M. S., A. M. Al-Majali, and J. R. Stabel. 2009. Role of nitric oxide production in dairy cows naturally infected with Mycobacterium avium subsp. paratuberculosis. Vet. Immunol. Immunopathol. 131:97-104. [DOI] [PubMed] [Google Scholar]
- 13.Koo, H. C., et al. 2004. Analysis of the immune response to Mycobacterium avium subsp. paratuberculosis in experimentally infected calves. Infect. Immun. 72:6870-6883. [DOI] [PMC free article] [PubMed] [Google Scholar]
- 14.Rhodes, S. G., and S. P. Graham. 2002. Is “timing” important for cytokine polarization? Immunol. Trends 23:246-249. [DOI] [PubMed] [Google Scholar]
- 15.Scheel-Toellner, D., et al. 1995. CD26 expression in leprosy and other granulomatous diseases correlates with the production of interferon-gamma. Lab. Invest. 73:685-690. [PubMed] [Google Scholar]
- 16.Shankar, G., L. A. Pestano, and M. L. Bosch. 2003. Interferon-gamma added during bacillus Calmette-Guerin induced dendritic cell maturation stimulates potent Th1 immune responses. J. Transl. Med. 1:7. [DOI] [PMC free article] [PubMed] [Google Scholar]
- 17.Stabel, J. R. 1996. Production of gamma-interferon by peripheral blood mononuclear cells: an important diagnostic tool for detection of subclinical paratuberculosis. J. Vet. Diagn. Invest. 8:345-350. [DOI] [PubMed] [Google Scholar]
- 18.Stabel, J. R. 2000. Cytokine secretion by peripheral blood mononuclear cells from cows infected with Mycobacterium paratuberculosis. Am. J. Vet. Res. 61:754-760. [DOI] [PubMed] [Google Scholar]
- 19.Stabel, J. R., K. Kimura, and S. Robbe-Austerman. 2007. Augmentation of secreted and intracellular gamma interferon following johnin purified protein derivative sensitization of cows naturally infected with Mycobacterium avium subsp. paratuberculosis. J. Vet. Diagn. Invest. 19:43-51. [DOI] [PubMed] [Google Scholar]
- 20.Stabel, J. R., and M. S. Khalifeh. 2008. Differential expression of CD5 on B lymphocytes in cattle infected with Mycobacterium avium subsp. paratuberculosis. Vet. Immunol. Immunopathol. 126:211-219. [DOI] [PubMed] [Google Scholar]
- 21.Stabel, J. R., et al. 2009. Pathogenesis of Mycobacterium avium subsp. paratuberculosis in neonatal calves after oral or intraperitoneal experimental infection. Vet. Microbiol. 136:306-313. [DOI] [PubMed] [Google Scholar]
- 22.Stewart, D. J., et al. 2006. A long-term study in Angora goats experimentally infected with Mycobacterium avium subsp. paratuberculosis: clinical disease, faecal culture and immunological studies. Vet. Microbiol. 113:13-24. [DOI] [PubMed] [Google Scholar]
- 23.Stewart, D. J., et al. 2007. A long-term bacteriological and immunological study in Holstein-Friesian cattle experimentally infected with Mycobacterium avium subsp. paratuberculosis and necropsy culture results for Holstein-Friesian cattle, Merino sheep and Angora goats. Vet. Microbiol. 122:83-96. [DOI] [PubMed] [Google Scholar]
- 24.Waters, W. R., et al. 2003. Early induction of humoral and cellular immune responses during experimental Mycobacterium avium subsp. paratuberculosis infection of calves. Infect. Immun. 71:5130-5138. [DOI] [PMC free article] [PubMed] [Google Scholar]
- 25.Wu, C. W., et al. 2007. Invasion and persistence of Mycobacterium avium subsp. paratuberculosis during early stages of Johne's disease in calves. Infect. Immun. 75:2110-2119. [DOI] [PMC free article] [PubMed] [Google Scholar]


