

Abstract
Purified Shiga toxin (Stx) alone is capable of producing systemic complications, including hemolytic-uremic syndrome (HUS), in animal models of disease. Stx includes two major antigenic forms (Stx1 and Stx2), with minor variants of Stx2 (Stx2a to -h). Stx2a is more potent than Stx1. Epidemiologic studies suggest that Stx2 subtypes also differ in potency, but these differences have not been well documented for purified toxin. The relative potencies of five purified Stx2 subtypes, Stx2a, Stx2b, Stx2c, Stx2d, and activated (elastase-cleaved) Stx2d, were studied in vitro by examining protein synthesis inhibition using Vero monkey kidney cells and inhibition of metabolic activity (reduction of resazurin to fluorescent resorufin) using primary human renal proximal tubule epithelial cells (RPTECs). In both RPTECs and Vero cells, Stx2a, Stx2d, and elastase-cleaved Stx2d were at least 25 times more potent than Stx2b and Stx2c. In vivo potency in mice was also assessed. Stx2b and Stx2c had potencies similar to that of Stx1, while Stx2a, Stx2d, and elastase-cleaved Stx2d were 40 to 400 times more potent than Stx1.
Shiga toxin (Stx)-producing Escherichia coli (STEC) causes approximately 110,000 cases of food-borne illness each year in the United States (http://www.cdc.gov/nczved/divisions/dfbmd/diseases/ecoli_o157h7/#who), and these cases range in severity from mild diarrhea to hemorrhagic colitis. Approximately 10% of those infected develop life-threatening sequelae (3, 48, 52), including hemolytic-uremic syndrome (HUS) (38) and neurological complications (13). This disease disproportionately affects children under 5 years of age and the elderly (as mentioned on the above-cited CDC URL).
Stx, the primary virulence factor of STEC, is an AB5 toxin (39). The B pentamer targets cells expressing the glycolipid globotriaosylceramide (Gb3) (25) and is responsible for delivery of the A subunit to the cytoplasm. In the cytoplasm, the enzymatically active A subunit inhibits protein synthesis (39) by cleaving the N-glycosidic bond of adenine 4324 in 28S rRNA, preventing tRNA binding (11). Stx includes two major antigenic forms (Stx1 and Stx2) (54), which share approximately 60% amino acid identity. Epidemiological studies suggest that Stx2 is more often associated with severe disease and development of HUS than Stx1 (2, 12, 17, 24, 40, 41). Studies in primates have shown that administration of Stx2 alone can produce the symptoms of HUS, while administration of Stx1 at the same dose does not cause HUS (50, 53). In mouse models, Stx2 is 100 times more potent than Stx1 (56).
Toxin variants or subtypes share significant amino acid identity with either Stx1 or Stx2. Stx2 subtypes are also associated with different clinical outcomes (17, 33, 44, 59). A recent proposal to clarify Stx nomenclature has been published online (15), and it suggests using classification based on types (Stx1 or Stx2), followed by subtypes based on nucleotide and amino acid sequence similarity (e.g., Stx2a to Stx2g), to classify toxins. Stx homology trees based on DNA relatedness have clearly established a close relationship among Stx2a, Stx2c, and Stx2d and have shown that Stx2b and Stx2e to Stx2g are less closely related (15). In this study, we use the nomenclature proposed in 2009 (15) and refer to the prototype Stx2 variant from strain EDL933 as Stx2a. It is important to note that there is considerable confusion in the historic literature, especially for the Stx2c and Stx2d designations, and some GenBank entries are clearly misidentified according to the new typing scheme.
Stx2 subtypes may display only a few amino acid changes (Fig. 1 A and B), but these differences appear to influence disease outcome (15). Strains producing subtype Stx2a, Stx2c, or Stx2d are often associated with development of hemorrhagic colitis (HC) and HUS (2, 24, 40, 41). Stx2a, Stx2c, and Stx2d display subtle differences in receptor preference (27), which may influence potency. Strains that produce other (more distantly related) subtypes (Stx2b and Stx2e) are less frequently associated with human disease. To date, Stx2e has been associated with potentially fatal edema disease in neonatal piglets (32). The molecular basis for the difference in potency is most clear for the Stx2e subtype. Compared to that of Stx2a, the B subunit of Stx2e has nine amino acid changes and lacks the two C-terminal amino acids. These changes alter receptor binding preference: Stx2e binds to the glycolipid globotetraosylceramide (Gb4) instead of Gb3, which is preferred by Stx1 and most other Stx2 subtypes (57). Interestingly, alteration of only two amino acids in Stx2e (Q64E/K66Q) restored the preference for Gb3 (30). While epidemiologic data suggest that particular Stx2 subtypes are more strongly associated with severe disease, no studies to date have confirmed this with purified toxins in the absence of confounding factors, such as differences in strain background, other virulence factors, and toxin production.
FIG. 1.

Sequence alignments and structural models of Stx2 subtypes. Stx2 sequences were aligned using BLASTP (NCBI/BLAST), with periods indicating identity and dashes indicating absent amino acids. Numbering starts with the first amino acid of the mature peptide; numbers correspond to bold amino acids. (A) Only the C-terminal 65 amino acids, corresponding to the region of greatest variability, of the 297-amino-acid A subunit are shown. (B) Alignment of the entire B subunit. (C) The mutagenesis function of PYMOL was used to substitute amino acids of the subtypes into the Stx2a crystal structure (1R4P). The structures are oriented to display the receptor binding face and are color coded as follows: blue, amino acids of the Stx2a B pentamer predicted to mediate receptor binding, based on the crystal structure of Stx2e subtype GT3 bound to Gb3 (31); gray, amino acids not thought to participate in binding; yellow, amino acid polymorphisms in the B subunit of Stx2b to Stx2d; red, the C terminus of the A subunit; green, amino acid polymorphisms in the A subunit of Stx2b and Stx2d. Red boxes indicate the toxin amino acid variants purified for this study; the B subunits of Stx2c used in the study and the Stx2c type are identical.
Receptor recognition is primarily mediated by the B pentamer; however, the A subunit has some role in binding. The C terminus of the A subunit of Stx2a extends through the pore formed by the B pentamer (Fig. 1C, in red) and could occlude binding to a region identified as site 3 in Stx1 (30). Indirect evidence for a role of site 3 in Stx2 binding came from characterization of Stx2d. The Stx2d subtype has been classified on the basis of activation by elastase (35), as elastase has been shown to remove two amino acids (GE) from the C terminus of the A subunit (Fig. 1A). Elastase-treated culture supernatant from strains expressing activable Stx2d shows increased Vero cell cytotoxicity (35), and the increased potency of strains expressing Stx2d in mouse models of infection (35) and human disease (1) is thought to be due to toxin activation by intestinal elastase. The biochemical basis for increased cytotoxicity remains unknown, but it has been hypothesized that removal of the C-terminal amino acids of the A subunit may make receptor site 3 more accessible.
In this study, the potencies of purified Stx1 and Stx2a to Stx2d subtypes were examined in vitro using two different parameters, protein synthesis inhibition and cellular metabolic toxicity, and in vivo by examining toxicity to mice.
MATERIALS AND METHODS
Bacterial strains and growth conditions.
The sources of the strains and purified toxins used in this study are summarized in Table 1. Stx was purified from cultures grown in Mueller-Hinton broth (cation stabilized; Difco). L broth or L agar containing 100 μg/ml ampicillin and 30 μg/ml chloramphenicol, as appropriate, was used for routine propagation. Tissue culture-grade phosphate-buffered saline (PBS) was obtained from Mediatech (Manassas, VA).
TABLE 1.
Sources of Stx-producing strains or purified toxins and primers used for sequencing
| Toxin or primer | Strain | Source and/or reference | Protein accession no. (NCBI) |
|
|---|---|---|---|---|
| A subunit | B subunit | |||
| Toxins | ||||
| Stx1 | BEI (purified toxin)b | AAA98347 | AAA98348 | |
| Stx1 N32S | 14 | AAA98347 | AAA98348a | |
| Stx1 L41Q | 5 | AAA98347 | AAA98348a | |
| Stx2a (type) | EDL933 | BEI (purified toxin)b | AAD25445 | AAD25446 |
| Stx2b (type) | EH250 | Statens Serum Institut (45) | AAD12174.1 | AAD12175.1 |
| Stx2c (type) | E32511 | Sequence comparison only (28) | ABR09932.1 | ABR09933.1 |
| Stx2c | C394-03 | Statens Serum Institut (44) | AAD12174.1 | AAD12175.1 |
| Stx2d (type) | B2F1 | Alison O'Brien (55) | AAM88312.2 | AAM88313.2 |
| Stx2d | 3024-94 | Alison O'Brien (7) | HQ585061 | HQ585062 |
| Stx2dΔGE | 3024-94 | This work | ||
| PCR primers | ||||
| CF1 (stxA2a forward) | GGAATACCGTCATATGAAGTGTATATT | |||
| CF2 (stxA2a reverse) | CATACTTGGATCCTTATTCACCCGTTG | |||
| CF7 (stxB2a forward) | GGGAGTTACATATGAAGAAGATGGTTTA | |||
| CF9 (stxB2a reverse) | AAGCTTGAATTCGGATCCTCAGTCATTATTA | |||
| T7 forward | TAATACGACTCACTATAGGG | |||
| T7 terminator | GCTAGTTATTGCTCAGCGG | |||
Sequence of wild-type Stx1 toxin without the indicated mutation.
The following reagents were obtained through the NIH Biodefense and Emerging Infections Research Resources Repository, NIAID, NIH: recombinant Stx from E. coli (NR-857) and recombinant Stx type 2 from E. coli (NR-4478).
DNA sequencing, analysis, and protein modeling.
Coding sequences obtained from published databases are listed in Table 1. To determine the sequences of the stx2d A and B subunit genes present in E. coli strain 3024-94 (7), total DNA was extracted and sequences corresponding to the stxA2d and stxB2d subunits were amplified separately by PCR using the primers indicated in Table 1. Amplified DNA from three independent experiments was digested with NdeI and BamHI, cloned into pET21b, and transformed into E. coli DH5α. Plasmid inserts were sequenced in the forward and reverse directions using T7 forward and T7 terminator primers (Table 1). Identical sequences were obtained for all three trials. Sequence alignments were made using the NCBI BLAST program (Fig. 1A and B). To generate the predicted molecular structures for Stx2b, Stx2c, Stx2d, and elastase-cleaved Stx2d (Stx2dΔGE; see below), in silico mutagenesis was performed in PYMOL (DeLano Scientific, Palo Alto, CA) using the coordinates of the Stx2a crystal structure (1R4P) (Fig. 1C).
Stx purification.
Stx is encoded as a late phage gene; to improve yields, toxin was purified from cultures treated with ciprofloxacin to induce the phage lytic cycle. Overnight cultures were diluted 1/100 in fresh Mueller-Hinton broth and grown to an optical density at 600 nm of approximately 0.5. Ciprofloxacin (10 ng/ml) was added, and the cultures were incubated overnight at 37°C with shaking. Cells were removed by centrifugation, and supernatants were filter sterilized and subjected to ammonium sulfate precipitation. Stx was purified from the 40 to 80% ammonium sulfate fraction by using AffiGel Blue chromatography, anion-exchange (Q-Sepharose or UnoQ) chromatography, and size exclusion (Superdex 75) chromatography. Protein was quantified by using the bicinchoninic acid (BCA) assay (Pierce). Only two bands corresponding to the A and B subunits were visualized by Coomassie staining when 1 μg of protein was resolved on 8 to 16% polyacrylamide gels (Lonza). Lipopolysaccharide (LPS) content was determined using the limulus amoebocyte lysate (LAL) assay (Lonza); it was below the limit of detection for Stx2b and Stx2dΔGE and less than 0.02 ng LPS per μg toxin for Stx2c, Stx2d, Stx1 with the N32S mutation (Stx1 N32S), and Stx1 L41Q. Stx1 and Stx2a were received from the Biodefense and Emerging Infectious Diseases Research Resources Repository (BEI, Manassas, VA) and were not tested for endotoxin levels.
Generation and characterization of elastase-activated Stx2d.
Stx2d (100 μg) was incubated with 10 μg purified mouse pancreatic elastase (Elastin Products Company, Owensville, MO) for 30 min at 37°C, followed by the addition of 20 μg (5-fold excess) of elastatinal (Sigma, St. Louis, MO) to inhibit elastase activity. Digested proteins were purified by ion-exchange chromatography (UnoQ), and two prominent peaks were obtained, corresponding to elastase-digested and undigested Stx2d. Elastase-treated and control fractions were digested with trypsin (10 μg Stx2d incubated with 1 μg trypsin) for 30 min at 37°C to separate the A1 fragment from the A2 fragment. Stx2d samples were reduced with 200 mM dithiothreitol, heated at 45°C for 45 min, and analyzed by liquid chromatography-mass spectrometry (LC-MS) at the University of Cincinnati Mass Spectroscopy Core. Removal of the terminal GE from elastase-cleaved Stx2d was confirmed by LC-MS (Fig. 2). The A2 fragment of intact Stx2d had a predicted mass of 5,227 Da (Fig. 2A). Removal of the C-terminal amino acids by elastase is predicted to generate a 5,040-Da fragment, in agreement with the LC-MS fragment corresponding to 5,042 Da (Fig. 2B). The cleaved Stx2d molecule is referred to as Stx2dΔGE.
FIG. 2.

Reconstructed mass spectra of Stx2d. Stx2d or elastase-cleaved Stx2d was treated with trypsin to generate the N-terminal A1 and C-terminal A2 fragments, and the A2 fragments were analyzed by LC-MS. (A) Trypsin-treated Stx2d control full-length A2 (5,227.4 Da) is seen as the major peak. (B) Elastase-treated Stx2d. The major fragment is smaller (5,042.2 Da), corresponding to A2 minus the two terminal amino acids (GE).
Protein synthesis inhibition.
Stx-mediated inhibition of protein synthesis was assessed using Luc2P Vero cells expressing destabilized luciferase as previously described (34). Briefly, serial dilutions of Stx were added to luminometer-compatible white, tissue culture-treated, Falcon 96-well microtiter plates (Becton Dickinson, Franklin Lakes, NJ). Luciferase-expressing Vero cells (104) were added to the wells and incubated with toxin for 4 h at 37°C with 5% CO2. Cells attach rapidly to the wells even in the presence of toxin. After 4 h, cells were washed three times with PBS, 25 μl Superlite luciferase substrate (Bioassay Systems, Hayward, CA) was added, and light was measured using a Luminoskan Ascent (Thermo Labsystems, Helsinki, Finland). Luciferase-expressing Vero cells incubated without toxin were used as the negative control to determine maximum light production. The effective dose for causing a 50% reduction in protein synthesis (ED50) was calculated from the dose-response curve by using the two points above and below the midpoint.
Toxicity to human renal cells.
Human RPTECs from a 35-year-old male (7F4110), and a 7-year-old male (8F3151) were obtained from Clonetics (Lonza, Walkersville, MD). In initial studies, the cells were propagated by using Clonetics REGM renal epithelial-cell basal medium in the presence of proprietary growth factors, cytokines, and supplements as recommended by the manufacturer. However, RenalLife complete medium (Lifeline Cell Technology, Walkersville, MD) resulted in better growth and was used for all other studies. Cells were harvested using TrypKit (Lifeline Cell Technology, Walkersville, MD) according to the manufacturer's recommendations. Briefly, ampoules containing 500,000 cells were thawed, and cells were plated at a density of 2,200 cells per cm2 in three 75-cm2 tissue culture-treated flasks with vented lids (Becton Dickinson, Franklin Lakes, NJ). Medium was replaced 24 h after initial plating and every 48 h thereafter. Division numbers were calculated based on cellular yields. Stx was serially diluted in 10 μl of tissue culture-grade PBS and added to sterile, clear, flat-bottom, tissue culture-treated 96-well microtiter plates (Falcon; Corning, Lowell, MA). RPTECs (in 100 μl of medium) were plated at 5 × 10³ cells per well, and the plates were incubated with toxin at 37°C in 5% CO2. After 42 h, the medium was removed and replaced with 100 μl of fresh medium containing 10% (vol/vol) alamarBlue (resazurin; Trek Diagnostic Systems, Cleveland, OH); this was incubated for 4 h in the presence of alamarBlue to allow reduction of resazurin to the fluorescent compound resorufin by mitochondrial electron transport. To quantify fluorescence, the medium was transferred into untreated, black, clear-bottom 96-well plates (Corning, Lowell, MA), and the fluorescence emission at 590 nm was determined using an FLX-800 fluorimeter (BioTek, Winooski, VT). Dose-response curves were plotted using the percentage of untreated cells for the y axis and toxin concentration (pg/ml) for the x axis. The effective dose to inhibit protein synthesis by 50% (ED50) was calculated from the x intercept of the line connecting points above and below the midpoint.
Flow cytometry to detect apoptosis.
RPTECs at division 8 were treated for 12 h with PBS, with actinomycin D, an inhibitor of transcription (10 μM), with cycloheximide, an inhibitor of protein synthesis (100 μM), or with Stx2a (0.2 ng/ml). Cells were harvested, washed, stained with Alexa Fluor 488 annexin V and propidium iodide (PI) according to the manufacturer's recommendations (Invitrogen, Carlsbad, CA), and analyzed by flow cytometry. Unstained and stained cells permeabilized with 0.1% NP-40 (double positive) were used as negative and positive controls, respectively, for calibration of the flow cytometer (BD FACSCalibur; Becton Dickinson, Franklin Lakes, NJ).
Toxicity to mice.
Male CD-1 mice, 13 to 15 g, were obtained from Charles River Laboratories (Wilmington, MA) and housed in the animal facilities at the University of Cincinnati according to the protocol approved by the University of Cincinnati Institutional Animal Care and Use Committee (IACUC). Three days after arrival, groups of three mice were injected intraperitoneally (i.p.) with 500 μl of purified toxin diluted into sterile, tissue culture-grade PBS. A positive control, Stx2a or Stx2d, was included in each trial. Animals were weighed daily; any animals appearing moribund at a time point or losing more than 20% of initial body weight 72 h postinjection were sacrificed in compliance with IACUC regulations. The trial was terminated after 5 days. Mouse survival was plotted against the log of the toxin dose, and the 50% lethal dose (LD50) was calculated from the x intercept of the line connecting points above and below the midpoint.
Statistical tests.
Statistical analysis (for means, standard deviations, and 95% confidence intervals) for the Luc2P Vero cell and RPTEC ED50 studies and mouse LD50 studies was performed on log-transformed values by using Prism5 (GraphPad Software, La Jolla, CA).
Nucleotide sequence accession numbers.
The sequences of stxA2d and stxB2d were deposited into GenBank, with the corresponding submission accession numbers HQ585061 and HQ585062, respectively.
RESULTS
Models of Stx2 subtypes.
Epidemiological evidence suggests that E. coli strains expressing different subtypes of Stx2 display differences in virulence, including the likelihood of progression to HUS (15, 27, 36, 50). Since different subtypes also display differences in receptor preference (9, 14, 21, 26, 27, 43), we wanted to determine if any of the amino acid polymorphisms map to the Gb3 binding sites in the Stx2 B subunit. The structure of Stx2a bound to Gb3 has not been determined; however, the structure of a highly homologous form, Stx2e (GT3), with bound Gb3 has been determined (31). While Stx2e binds to Gb4, the mutant, GT3, like Stx2a, binds to Gb3. Since 16 of the 18 amino acids that make contact with Gb3 are identical between GT3 and Stx2a, this crystal structure is useful for predicting the Gb3 binding sites on Stx2a.
The structures of the Stx2b, Stx2c, Stx2d, and elastase-cleaved Stx2d toxins were modeled onto the crystal structure of Stx2a (1R4P) by using PYMOL software (Fig. 1C), and predicted Gb3 binding sites were identified on each (they are shown in blue in Fig. 1C). The Stx2 subtypes share extensive amino acid homology (Fig. 1A and B); however, several of the amino acid polymorphisms (Fig. 1C, in yellow) map to, or near, the predicted receptor binding sites, which suggests that they could influence binding preferences.
Inhibition of protein synthesis by purified Stx2 subtypes.
Vero cells have been reported to be more sensitive to Stx1 than Stx2a in assays which assess cellular viability 3 days after treatment (54). In a previous study (27), we assessed the abilities of Stx1, Stx2a, Stx2c, and Stx2d to mediate protein synthesis inhibition by using Vero cells which had been modified to express a destabilized form of luciferase (34); Stx1 was found to be more potent than Stx2a, while Stx2c was significantly less potent than either Stx1 or Stx2a (Table 2 ) (27). We obtained almost identical results when these experiments were repeated in the current study. In the current study, the abilities of Stx2b and Stx2dΔGE to inhibit protein synthesis were also assessed (Table 2). The potency of Stx2b was similar to those of Stx2a and Stx2d. The activated form of Stx2d, Stx2dΔGE, was approximately 5 times more potent than Stx2d, but this difference did not achieve statistical significance.
TABLE 2.
ED50s of Stx variants for Vero cells and RPTECs and LD50s for mice
| Stx | ED50 (pg/ml) (95% CI)a |
LD50 (ng)b | |
|---|---|---|---|
| Vero cells | RPTECs | ||
| Stx2a | 461 (325-656)c | 28 (6.7-119)* | 6.5 |
| Stx2b | 1,470 (233-9,330) | 718 (293-1,760) | >1,000 |
| Stx2c | 46,700 (24,700-88,400)c | 32,000 (7,790-131,000) | 1,000 |
| Stx2d | 395 (138-1,130)c | 4 (1.1-17)* | 2.4 |
| Stx2dΔGE | 79 (18-351) | 1.1 (0.4-3.4)* | 22.9 |
| Stx1 (Shigella dysenteriae) | 63 (31-128)c | 21 (7.3-58) | >1,000 |
| Stx1 N32S | Not determined | 97 (30-313) | >1,000 |
| Stx1 L41Q | Not determined | 3.2 (0.9-12) | >1,000 |
ED50 values were calculated by determining the x intercept of the line connecting the points above and below the midpoint on plots of dose-response curves. The 95% confidence intervals were determined using log-transformed ED50 values in Prism5 (GraphPad Software, La Jolla, CA), and values are expressed as the ED50 value with the 95% confidence interval values in parentheses. *, significant difference (nonoverlapping confidence interval) between Vero cells and RPTECs.
LD50s were calculated by determining the x intercept of the line connecting the points above and below the midpoint of plots of survival data at 120 h postinjection (i.p.) of Stx.
Values taken from published studies (27). Similar values were obtained when these experiments were repeated for the current study.
Toxicity to primary human kidney cells.
RPTECs were treated with purified toxin for 42 h, and mitochondrial activity was assessed by monitoring reduction of resazurin to the fluorescent compound resorufin. In initial studies, RPTECs from a 35-year-old male were cultured in REGM renal epithelial-cell basal medium from Clonetics. A large number of cells from the ampoule failed to adhere, and it took several days for the plate to become confluent. The cells displayed an estimated doubling time of 36 h. Sensitivity to three subtypes, Stx2a, Stx2c, and Stx2d, was dependent on the number of cell divisions after initial plating (Fig. 3 A), with cells at division 16 being approximately 100-fold less sensitive than cells at division 12. Giemsa staining of RPTECs revealed a more diverse appearance at later cell divisions. After 16 passages, cells surviving Stx treatment were larger than the untreated cells, suggesting that the large cells are resistant to Stx.
FIG. 3.

Stx-mediated inhibition of metabolic activity of primary human kidney cells. RPTECs from two donors were grown in the indicated medium and treated with dilutions of purified Stx as indicated. After 48 h, medium was replaced with the medium containing 10% (vol/vol) alamarBlue, cells were incubated for an additional 4 h, and fluorescence of reduced alamarBlue was measured. The graphs depict toxin-treated cells standardized to percent metabolic activity of untreated control cells. (A) RPTECs, from a 35-year-old male, that were grown in Clonetics medium. Metabolic activity was assessed at division 12 or 16 after 2 days' incubation with toxin. (B) RPTECs, from a 35-year-old male, that were grown in Lifeline medium were treated with Stx2 at division 8 and assessed for metabolic activity at division 10. (C) RPTECs, from a 7-year-old male, that were grown in Lifeline medium were treated with Stx2 at division 8 and assessed for metabolic activity at division 10. (D) RPTECs, from a 7-year-old male, that were grown in Lifeline medium were treated with Stx1 and mutants at division 8 and assessed for metabolic activity at division 10. Error bars depict standard errors of the means, which were calculated in Prism5 (GraphPad Software, La Jolla, CA).
To improve initial recovery and cellular growth, RPTECs were cultured in RenalLife complete medium from Lifeline. Adhesion of RPTECs from cryovials incubated in the Lifeline medium was remarkably increased compared to that of cells in Clonetics medium, and the doubling time was approximately 24 h. At division 10, cells grown in the Clonetics medium were much more sensitive to Stx2a and Stx2d than to Stx2c (Fig. 3B).
Children are more likely to develop HUS than adults (18, 22). RPTECs from the youngest donor available, a 7-year-old male, were also assessed for sensitivity to Stx2. When cells were cultured under identical conditions, ED50 values for cells from the 7-year-old male were not significantly different from those for the corresponding cells of the 35-year-old male, except for the Stx2a ED50s (P = 0.14; not shown). Considerable differences in potency were observed for the different subtypes (Fig. 3B).
The ED50 values were calculated and are shown in Table 2. The activated form of Stx2d, Stx2ΔGE (ED50 = 1 pg/ml), was the most potent form, followed by Stx2d (ED50 = 4 pg/ml) and then Stx2a (ED50 = 28 pg/ml). Stx2ΔGE was significantly more potent than Stx2a but not Stx2d. The cells were much less sensitive to Stx2b (ED50 = 718 pg/ml) and Stx2c (ED50 = 32,000 pg/ml). Stx2b and Stx2c were significantly less potent than Stx2a, Stx2d, and Stx2ΔGE. Unlike the Vero cells, RPTECs displayed equivalent susceptibilities to Stx1 and Stx2. The ED50s of Stx2a, Stx2d, and Stx2ΔGE for the human RPTECs were significantly lower than those for the Vero cells, while differences between Stx1, Stx2b, and Stx2c ED50s were not significantly different.
Two mutants of Stx1 were also tested. Stx1 N32S was generated to replace the B subunit amino acid at position 32 with the corresponding amino acid from Stx2a, which causes the mutant to display Stx2a-like binding preferences for synthetic glycans (14). Stx1 L41Q was generated to replace the B subunit amino acid at position 41 with the corresponding amino acid from Stx2a, a change which decreases the B pentamer stability (5). The potencies of the mutants were not statistically different from that of the wild-type Stx1 (Fig. 3D).
Stx2a does not promote apoptosis in RPTECs.
Previous studies reported that Stx2a induces apoptosis in various cell lines (4, 17, 20) and serum-starved RPTECs (6, 51) obtained from renal cell carcinomas. We examined the ability of Stx2a to induce apoptosis in RPTECs grown in Lifeline medium containing 0.5% serum. Cellular viability was assessed using propidium iodide, which is excluded from cells with an intact cell membrane but stains the nuclei when the cytoplasmic membrane is compromised. Apoptosis was assessed using annexin V. Annexin V binds to phosphatidylserine, which is translocated from the cytoplasmic face of the membrane to the cell surface during the early stages of apoptosis.
At 12 h posttreatment, about 5% of the untreated RPTECs appeared to be dead, as evidenced by elevated staining with propidium iodide (Fig. 4 A, right half), and about 30% of the cells displayed elevated staining with annexin V (Fig. 4A, upper left quadrant). These results are consistent with the observation that these primary cells have a limited life span in vitro and evidence that apoptosis is seen even at division 8. Treatment with actinomycin D, an inhibitor of RNA polymerase, induced apoptosis (Fig. 4B), as evidenced by an increase in propidium iodide-positive dead cells (from 5% to 10%) and the annexin V-positive apoptotic cells (from 29% to 43%). In contrast, treatment with cycloheximide, an inhibitor of protein synthesis did not cause an increase in either propidium iodide or annexin V staining, suggesting that it did not promote apoptosis (Fig. 4C). Similarly, Stx2a, which also inhibits protein synthesis, did not cause an increase in either propidium iodide or annexin V staining (Fig. 4D), suggesting that Stx2a also did not promote apoptosis in cells obtained from healthy kidneys grown in the presence of serum. However, a significant proportion of the untreated control cells displayed elevated expression of annexin V, a marker for early apoptosis, and it is likely that apoptosis plays a role in limiting the life span of these primary cells in vitro.
FIG. 4.
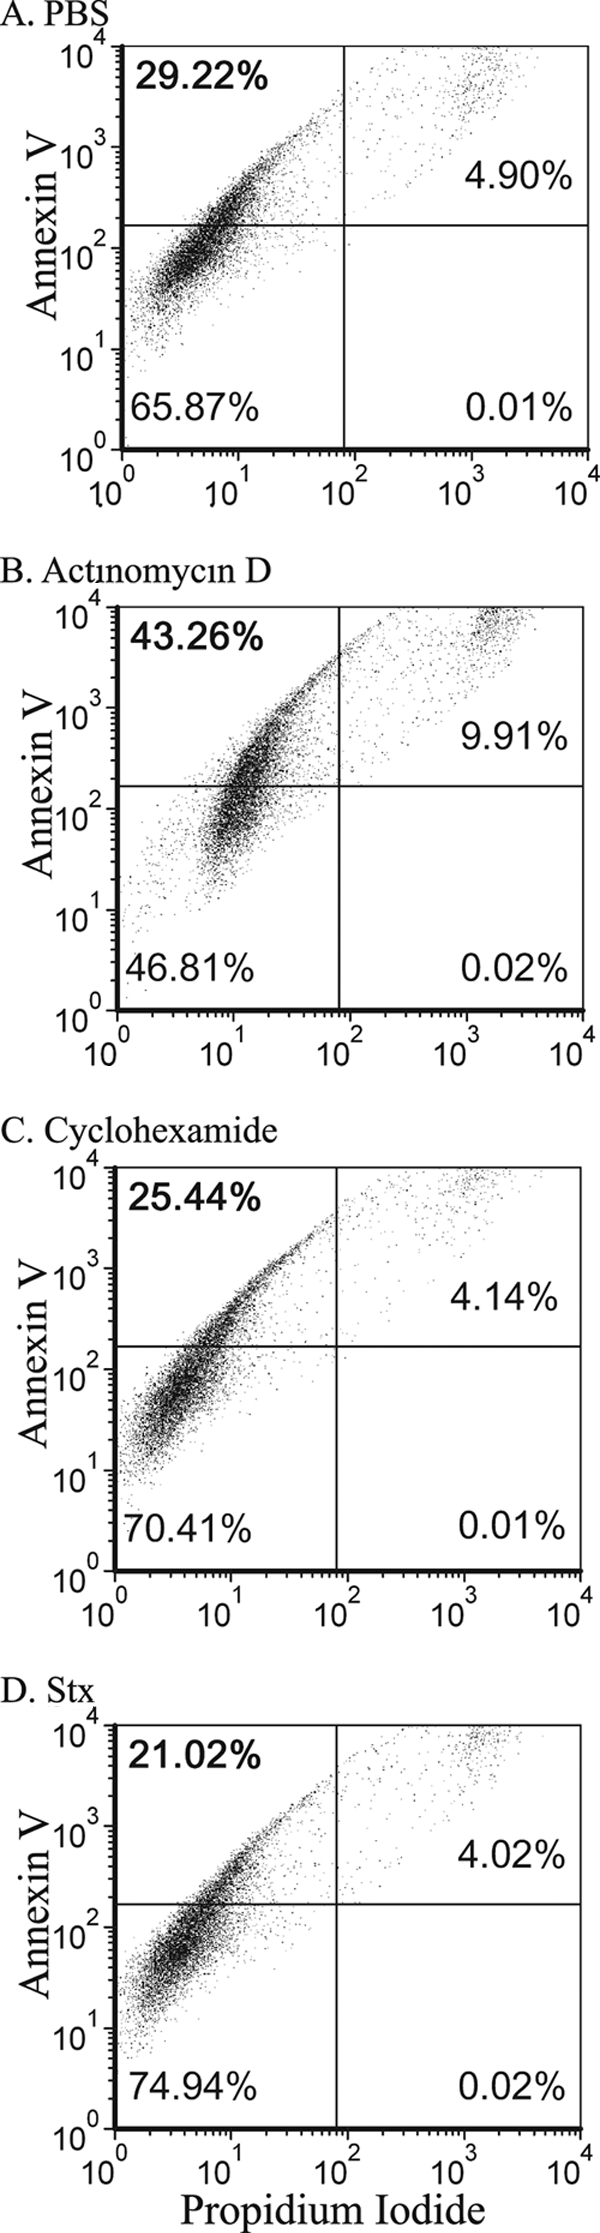
Flow cytometry analysis of annexin V binding versus propidium iodide staining. RPTECs at division 8 were treated for 12 h as indicated with PBS (control) (A), actinomycin D (inhibition of transcription, 10 μM) (B), cycloheximide (inhibition of protein synthesis, 100 μM) (C), or Stx2a (inhibition of protein synthesis) (D). Cells were stained with annexin V and propidium iodide. Percentages of cells in each quadrant are indicated.
Determination of LD50 values in mice.
Male CD-1 mice were injected i.p. with half-log dilutions of purified toxin ranging from 0.3 to 1,000 ng per mouse. Survival results are summarized in Fig. 5. Stx2a, Stx2d, and Stx2dΔGE displayed similar potencies, with LD50 values ranging from 2 to 23 ng (Fig. 5 and Table 2), and were significantly more potent than Stx2b or Stx2c. All Stx2b-treated mice survived regardless of the dose, and all mice treated with less than 1,000 ng of Stx2c survived. The LD50s of Stx2b and Stx2c were similar to those of Stx1 and the mutants Stx1 N32S and Stx1 L41Q (Fig. 5 and Table 2).
FIG. 5.

Mouse toxicity studies. Male CD-1 mice were injected i.p. with half-log dilutions of purified Stx ranging from 0.3 to 1,000 ng per mouse and monitored for 120 h. The LD50 values are marked by a bar and are noted at the bottom of the columns.
DISCUSSION
While administration of purified Stx is sufficient to cause HUS in primate models of disease (50, 53), the ability to predict whether intestinal infection will progress to HUS is severely limited. Both human and microbial factors influence the outcome of infection due to STEC (Fig. 6). Children and the elderly are more likely to develop HUS, although the basis for age-related susceptibility is unclear, and it is likely that different factors mediate susceptibility in each age group. It is also clear that host E. coli genetics influence pathogenic potential, and STEC strains which lack intestinal colonization factors such as intimin and Tir are not associated with clinical disease (12, 17). Other microbial factors are likely important but are less well characterized.
FIG. 6.

Interactions of multiple factors contributing to the severity of Stx-mediated disease.
Originally, clinical disease due to STEC was predominantly associated with E. coli serotype O157:H7. It is clear that, for E. coli strains with the fairly consistent O157:H7 genetic background, humans infected with isolates that produce Stx2a are more likely to develop life-threatening disease than individuals infected with isolates that produce Stx1 (2, 12, 24, 40, 41). However, even the pathogenic potentials of Stx2a-producing O157:H7 strains can differ (8, 36). In an interesting study by Muniesa et al. (36), Stx2a production levels of O157:H7 isolates from a single outbreak were found to differ, and an adverse clinical outcome was associated with high-level Stx production. Further genetic characterization demonstrated that the low-level toxin producers had two copies of an Stx2-encoding phage and converted to high-level toxin production when one phage copy was deleted, suggesting a complex regulation where one phage could suppress toxin production from both toxin alleles. Muniesa et al. (36) demonstrated that bacterial isolates from the same lineage can display different pathogenic potentials, and the presence of a toxin gene does not mean it will be expressed. Predicting the pathogenic potentials of non-O157:H7 strains is even more complicated, and it is difficult to determine whether pathogenic potential is most influenced by the E. coli genetic background or the Shiga toxin genotype.
The goal of this study was to examine a single variable, the relative potency of purified Stx2 subtypes in vitro by using primary cells thought to be a target in human disease (renal proximal tubule cells) and in vivo by using a mouse model. Interestingly, human RPTECs displayed age-dependent susceptibility to Stx2a; kidney cells from a 7-year-old were more susceptible than those from a 35-year-old (Fig. 3). However, experiments with primary cells must be carefully controlled, as indicated by the variability of RPTEC susceptibility depending on culture conditions (growth medium and number of doublings in vitro, etc.).
Stx2a did not mediate death through an apoptotic process in our studies using cells harvested from healthy kidneys and grown in the presence of serum (Fig. 4). In contrast, apoptosis was observed previously when experiments were performed using transformed cells (4, 17, 20) or primary cells obtained from renal carcinoma patients (6, 53). The role of apoptosis in Stx-mediated disease is also unclear. Several studies utilizing mouse models have observed apoptosis in renal cells following treatment with Stx (23, 42, 47), while other studies have observed necrosis (10, 29, 37, 46, 58, 60).
The rank order of Stx potency in human RPTECs was the same as the rank order of toxin-mediated protein synthesis inhibition using Vero cells (Table 2): Stx2dΔGE, intact Stx2d, and Stx2a have similar potencies, while Stx2b and Stx2c display greatly reduced potencies. There was a similar rank order for potency in mice, except that Stx2b appeared to be less potent than Stx2c (Fig. 6). The relative lack of potency for Stx2c in all three toxicity assays is puzzling, since Stx2c has been reported to be associated with HUS (12, 16, 33, 44). However, there is some confusion in the literature: sequences deposited in GenBank as Stx2c would be unambiguously classified as Stx2d using the designations adopted in 2009 (15). Unfortunately, since strain names are not always linked to clinical outcome, it is not possible to reevaluate published clinical correlations using the new standardized subtype designations. Nevertheless, newer reports using the current nomenclature have linked production of Stx2c to HUS (44). Stx2c-producing isolates associated with HUS could possess an especially potent combination of E. coli virulence factors or produce especially high levels of toxin. While mice are very sensitive to toxin administered by intravenous or i.p. injection (a route which bypasses the intestinal barrier), the mouse intestinal tract lacks the Shiga toxin receptor, Gb3 (19), and mice are extremely resistant to toxin delivered via intestinal infection (35). The mechanism of transfer of Stx from the intestinal tract to the circulation in human disease is poorly understood, but efficient transfer could be a determinant of potency that would go unrecognized in these studies. In addition, it is well known that strains that produce only Stx1 occasionally cause HUS (2, 12, 17, 24, 40, 41), perhaps due to infection of exceptionally susceptible hosts. However, it is important to note that unlike Stx1, which is highly toxic to kidney cells, Stx2c is not highly toxic to kidney cells (Table 2); therefore, it is likely that Stx1 and Stx2c lack potency for different reasons.
Our studies also replicated the in vitro potency versus in vivo potency paradox associated with Stx1, whereby Stx1 is more toxic to Vero cells than Stx2a (54) but much less toxic to mice in vivo (56). In vivo localization studies have shown that Stx1 accumulates in the lungs of mice, while Stx2 does not (49), and it has been suggested that the lack of potency of Stx1 is due to binding to toxin-resistant cells in the lungs, thereby protecting the vulnerable cells in the kidney. This is consistent with our observation that, in contrast to the case for Vero cells, Stx1 and Stx2 display equivalent toxicities to RPTECs (human kidney cells). It is interesting that the more potent toxin forms, Stx2a, Stx2d, and Stx2ΔGE, are 16 to 90 times more toxic to RPTECs than to Vero cells (Table 2). It is possible that this correlation is true only for cells from the 7-year-old male, since cells from the 35-year-old male were less susceptible to Stx2a; more detailed studies of the RPTECs may yield insights into age-related susceptibility.
While the molecular basis of potency remains unknown, the potent Stx2d subtype displays the wild-type Stx2a B subunit receptor binding surface, since the single amino acid difference between Stx2a and Stx2d does not map to the receptor binding face (Fig. 1C, note the lack of amino acids in yellow). In contrast, for the less potent subtypes, one of the two amino acid polymorphisms of the Stx2c B subunit and three of the five polymorphisms in the Stx2b B subunit map to the binding face (Fig. 1, yellow). The prototype Stx2d variant expresses the same receptor binding surface as the nonpotent Stx2c subtype and might be predicted to have reduced potency. A more detailed understanding of receptor preferences of the Stx2 subtypes is needed.
Acknowledgments
This work was supported by National Institutes of Health Grants R01 AI064893 and U01 AI075498 and a grant from the Midwest Center for Emerging Infectious Diseases to A.A.W.
The following reagents were obtained through the NIH Biodefense and Emerging Infections Research Resources Repository, NIAID, NIH: recombinant Stx from E. coli (NR-857) and recombinant Stx type 2 from E. coli (NR-4478).
Editor: S. R. Blanke
Footnotes
Published ahead of print on 3 January 2011.
REFERENCES
- 1.Bielaszewska, M., A. W. Friedrich, T. Aldick, R. Schürk-Bulgrin, and H. Karch. 2006. Shiga toxin activatable by intestinal mucus in Escherichia coli isolated from humans: predictor for a severe clinical outcome. Clin. Infect. Dis. 43:1160-1167. [DOI] [PubMed] [Google Scholar]
- 2.Boerlin, P., et al. 1999. Associations between virulence factors of Shiga toxin-producing Escherichia coli and disease in humans. J. Clin. Microbiol. 37:497-503. [DOI] [PMC free article] [PubMed] [Google Scholar]
- 3.Carter, A. O., et al. 1987. A severe outbreak of Escherichia coli O157:H7-associated hemorrhagic colitis in a nursing home. N. Engl. J. Med. 317:1496-1500. [DOI] [PubMed] [Google Scholar]
- 4.Ching, J. C. Y., N. L. Jones, P. J. M. Ceponis, M. A. Karmali, and P. M. Sherman. 2002. Escherichia coli Shiga-like toxins induce apoptosis and cleavage of poly(ADP-ribose) polymerase via in vitro activation of caspases. Infect. Immun. 70:4669-4677. [DOI] [PMC free article] [PubMed] [Google Scholar]
- 5.Conrady, D., et al. 2010. Molecular basis of differential B-pentamer stability of Shiga toxins 1 and 2. PLoS One 5:e15153. [DOI] [PMC free article] [PubMed] [Google Scholar]
- 6.Creydt, V. P., C. Silberstein, E. Zotta, and C. Ibarra. 2006. Cytotoxic effect of Shiga toxin-2 holotoxin and its B subunit on human renal tubular epithelial cells. Microbes Infect. 8:410-419. [DOI] [PubMed] [Google Scholar]
- 7.Department of Health and Human Services. 1995. Outbreak of acute gastroenteritis attributable to Escherichia coli serotype O104:H21—Helena, Montana, 1994. MMWR Morb. Mortal. Wkly. Rep. 44:501-503. [PubMed] [Google Scholar]
- 8.de Sablet, T., et al. 2008. Differential expression of stx2 variants in Shiga toxin-producing Escherichia coli belonging to seropathotypes A and C. Microbiology 154:176-186. [DOI] [PubMed] [Google Scholar]
- 9.Dohi, H., et al. 1999. Synthesis of an artificial glycoconjugate polymer carrying P(k)-antigenic trisaccharide and its potent neutralization activity against Shiga-like toxin. Bioorg. Med. Chem. 7:2053-2062. [DOI] [PubMed] [Google Scholar]
- 10.Eaton, K. A., et al. 2008. Pathogenesis of renal disease due to enterohemorrhagic Escherichia coli in germ-free mice. Infect. Immun. 76:3054-3063. [DOI] [PMC free article] [PubMed] [Google Scholar]
- 11.Endo, Y., et al. 1988. Site of action of a Vero toxin (VT2) from Escherichia coli O157:H7 and of Shiga toxin on eukaryotic ribosomes. RNA N-glycosidase activity of the toxins. Eur. J. Biochem. 171:45-50. [DOI] [PubMed] [Google Scholar]
- 12.Ethelberg, S., et al. 2004. Virulence factors for hemolytic uremic syndrome, Denmark. Emerg. Infect. Dis. 10:842-847. [DOI] [PMC free article] [PubMed] [Google Scholar]
- 13.Exeni, R. A., G. C. Fernandez, and M. S. Palermo. 2007. Role of polymorphonuclear leukocytes in the pathophysiology of typical hemolytic uremic syndrome. Sci. World J. 7:1155-1164. [DOI] [PMC free article] [PubMed] [Google Scholar]
- 14.Flagler, M. J., S. S. Mahajan, A. A. Kulkarni, S. S. Iyer, and A. A. Weiss. 2010. Comparison of binding platforms yields insights into receptor binding differences between Shiga toxins 1 and 2. Biochemistry 49:1649-1657. [DOI] [PMC free article] [PubMed] [Google Scholar]
- 15.Flemming Scheutz, L. B., et al. 2009. Nomenclature of verotoxins: a review, a proposal, and a protocol for typing vtx genes. 4th Annu. Workshop Commun. Ref. Lab. E. coli VTEC, ISS, Rome, Italy, 30 October 2009.
- 16.Friedrich, A. W., et al. 2002. Escherichia coli harboring Shiga toxin 2 gene variants: frequency and association with clinical symptoms. J. Infect. Dis. 185:74-84. [DOI] [PubMed] [Google Scholar]
- 17.Fujii, J., et al. 2003. Rapid apoptosis induced by Shiga toxin in HeLa cells. Infect. Immun. 71:2724-2735. [DOI] [PMC free article] [PubMed] [Google Scholar]
- 18.Griffin, P. M., and R. V. Tauxe. 1991. The epidemiology of infections caused by Escherichia coli O157:H7, other enterohemorrhagic E. coli, and the associated hemolytic uremic syndrome. Epidemiol. Rev. 13:60-98. [DOI] [PubMed] [Google Scholar]
- 19.Imai, Y., et al. 2003. Restricted expression of Shiga toxin binding sites on mucosal epithelium of mouse distal colon. Infect. Immun. 71:985-990. [DOI] [PMC free article] [PubMed] [Google Scholar]
- 20.Jones, N. L., et al. 2000. Escherichia coli Shiga toxins induce apoptosis in epithelial cells that is regulated by the Bcl-2 family. Am. J. Physiol. Gastrointest. Liver Physiol. 278:G811-G819. [DOI] [PubMed] [Google Scholar]
- 21.Kale, R. R., et al. 2008. Differentiation between structurally homologous Shiga 1 and Shiga 2 toxins by using synthetic glycoconjugates. Angew. Chem. Int. Ed. Engl. 47:1265-1268. [DOI] [PubMed] [Google Scholar]
- 22.Karmali, M. A., V. Gannon, and J. M. Sargeant. 2010. Verocytotoxin-producing Escherichia coli (VTEC). Vet. Microbiol. 140:360-370. [DOI] [PubMed] [Google Scholar]
- 23.Karpman, D., et al. 1998. Apoptosis of renal cortical cells in the hemolytic-uremic syndrome: in vivo and in vitro studies. Infect. Immun. 66:636-644. [DOI] [PMC free article] [PubMed] [Google Scholar]
- 24.Kawano, K., M. Okada, T. Haga, K. Maeda, and Y. Goto. 2008. Relationship between pathogenicity for humans and stx genotype in Shiga toxin-producing Escherichia coli serotype O157. Eur. J. Clin. Microbiol. Infect. Dis. 27:227-232. [DOI] [PubMed] [Google Scholar]
- 25.Keusch, G. T., M. Jacewicz, and A. Donohue-Rolfe. 1986. Pathogenesis of shigella diarrhea: evidence for an N-linked glycoprotein shigella toxin receptor and receptor modulation by β-galactosidase. J. Infect. Dis. 153:238-248. [DOI] [PubMed] [Google Scholar]
- 26.Kitova, E. N., et al. 2007. Affinities of Shiga toxins 1 and 2 for univalent and oligovalent Pk-trisaccharide analogs measured by electrospray ionization mass spectrometry. Glycobiology 17:1127-1137. [DOI] [PubMed] [Google Scholar]
- 27.Kulkarni, A. A., C. Fuller, H. Korman, A. A. Weiss, and S. S. Iyer. 2010. Glycan encapsulated gold nanoparticles selectively inhibit Shiga toxins 1 and 2. Bioconj. Chem. 21:1486-1493. [DOI] [PMC free article] [PubMed] [Google Scholar]
- 28.Lee, J. E., et al. 2007. Phylogenetic analysis of Shiga toxin 1 and Shiga toxin 2 genes associated with disease outbreaks. BMC Microbiol. 7:109. [DOI] [PMC free article] [PubMed] [Google Scholar]
- 29.Lentz, E. K., R. P. Cherla, V. Jaspers, B. R. Weeks, and V. L. Tesh. 2010. Role of tumor necrosis factor alpha in disease using a mouse model of Shiga toxin-mediated renal damage. Infect. Immun. 78:3689-3699. [DOI] [PMC free article] [PubMed] [Google Scholar]
- 30.Ling, H., et al. 1999. Structure of the Shiga-like toxin I B-pentamer complexed with an analogue of its receptor Gb3. Biochemistry 37:1777-1788. [DOI] [PubMed] [Google Scholar]
- 31.Ling, H., et al. 2000. A mutant Shiga-like toxin lie bound to its receptor Gb3: structure of a group II Shiga-like toxin with altered binding specificity. Structure 8:253-264. [DOI] [PubMed] [Google Scholar]
- 32.MacLeod, D. L., C. L. Gyles, and B. P. Wilcock. 1991. Reproduction of edema disease of swine with purified Shiga-like toxin-II variant. Vet. Pathol. 28:66-73. [DOI] [PubMed] [Google Scholar]
- 33.Manning, S. D., et al. 2008. Variation in virulence among clades of Escherichia coli O157:H7 associated with disease outbreaks. Proc. Natl. Acad. Sci. U. S. A. 105:4868-4873. [DOI] [PMC free article] [PubMed] [Google Scholar]
- 34.McGannon, C. M., C. A. Fuller, and A. A. Weiss. 2010. Different classes of antibiotics differentially influence Shiga toxin production. Antimicrob. Agents Chemother. 54:3790-3798. [DOI] [PMC free article] [PubMed] [Google Scholar]
- 35.Melton-Celsa, A. R., S. C. Darnell, and A. D. O'Brien. 1996. Activation of Shiga-like toxins by mouse and human intestinal mucus correlates with virulence of enterohemorrhagic Escherichia coli O91:H21 isolates in orally infected, streptomycin-treated mice. Infect. Immun. 64:1569-1576. [DOI] [PMC free article] [PubMed] [Google Scholar]
- 36.Muniesa, M., et al. 2004. Diversity of stx2 converting bacteriophages induced from Shiga-toxin-producing Escherichia coli strains isolated from cattle. Microbiology 150:2959-2971. [DOI] [PubMed] [Google Scholar]
- 37.Nestoridi, E., O. Tsukurov, R. I. Kushak, J. R. Ingelfinger, and E. F. Grabowski. 2005. Shiga toxin enhances functional tissue factor on human glomerular endothelial cells: implications for the pathophysiology of hemolytic uremic syndrome. J. Thromb. Haemost. 3:752-762. [DOI] [PubMed] [Google Scholar]
- 38.O'Brien, A. D., J. W. Newland, and S. F. Miller. 1984. Shiga-like toxin-converting phages from Escherichia coli strains that cause hemorrhagic colitis or infantile diarrhea. Science 226:694-696. [DOI] [PubMed] [Google Scholar]
- 39.O'Brien, A. D., et al. 1992. Shiga toxin: biochemistry, genetics, mode of action, and role in pathogenesis. Curr. Top. Microbiol. Immunol. 180:65-94. [DOI] [PubMed] [Google Scholar]
- 40.Orth, D., et al. 2007. The Shiga toxin genotype rather than the amount of Shiga toxin or the cytotoxicity of Shiga toxin in vitro correlates with the appearance of the hemolytic uremic syndrome. Diagn. Microbiol. Infect. Dis. 59:235-242. [DOI] [PubMed] [Google Scholar]
- 41.Ostroff, S. M., et al. 1989. Toxin genotypes and plasmid profiles as determinants of systemic sequelae in Escherichia coli O157:H7 infections. J. Infect. Dis. 160:994-998. [DOI] [PubMed] [Google Scholar]
- 42.Paixão-Cavalcante, D., M. Botto, H. T. Cook, and M. C. Pickering. 2009. Shiga toxin-2 results in renal tubular injury but not thrombotic microangiopathy in heterozygous factor H-deficient mice. Clin. Exp. Immunol. 155:339-347. [DOI] [PMC free article] [PubMed] [Google Scholar]
- 43.Paton, A. W., R. Morona, and J. C. Paton. 2001. Neutralization of Shiga toxins Stx1, Stx2c, and Stx2e by recombinant bacteria expressing mimics of globotriose and globotetraose. Infect. Immun. 69:1967-1970. [DOI] [PMC free article] [PubMed] [Google Scholar]
- 44.Persson, S., K. E. P. Olsen, S. Ethelberg, and F. Scheutz. 2007. Subtyping method for Escherichia coli Shiga toxin (verocytotoxin) 2 variants and correlations to clinical manifestations. J. Clin. Microbiol. 45:2020-2024. [DOI] [PMC free article] [PubMed] [Google Scholar]
- 45.Piérard, D., S. Lauwers, C. Le Bouguenec, and M. I. Garcia. 1998. Enteric infections due to Escherichia coli. Clin. Microbiol. Infect. 4:414-416. (Letters.) [DOI] [PubMed] [Google Scholar]
- 46.Pohlenz, J. F., K. R. Winter, and E. A. Dean-Nystrom. 2005. Shiga-toxigenic Escherichia coli-inoculated neonatal piglets develop kidney lesions that are comparable to those in humans with hemolytic-uremic syndrome. Infect. Immun. 73:612-616. [DOI] [PMC free article] [PubMed] [Google Scholar]
- 47.Psotka, M. A., et al. 2009. Shiga toxin 2 targets the murine renal collecting duct epithelium. Infect. Immun. 77:959-969. [DOI] [PMC free article] [PubMed] [Google Scholar]
- 48.Rowe, P. C., E. Orrbine, H. Lior, G. A. Wells, and P. N. McLaine. 1993. Diarrhoea in close contacts as a risk factor for childhood haemolytic uraemic syndrome. Epidemiol. Infect. 110:9-16. [DOI] [PMC free article] [PubMed] [Google Scholar]
- 49.Rutjes, N. W. P., B. A. Binnington, C. R. Smith, M. D. Maloney, and C. A. Lingwood. 2002. Differential tissue targeting and pathogenesis of verotoxins 1 and 2 in the mouse animal model. Kidney Int. 62:832-845. [DOI] [PubMed] [Google Scholar]
- 50.Siegler, R. L., et al. 2003. Response to Shiga toxin 1 and 2 in a baboon model of hemolytic uremic syndrome. Pediatr. Nephrol. 18:92-96. [DOI] [PubMed] [Google Scholar]
- 51.Silberstein, C., V. P. Creydt, E. Gerhardt, P. Núñez, and C. Ibarra. 2008. Inhibition of water absorption in human proximal tubular epithelial cells in response to Shiga toxin-2. Pediatr. Nephrol. 23:1981-1990. [DOI] [PubMed] [Google Scholar]
- 52.Slutsker, L., et al. 1997. Escherichia coli O157:H7 diarrhea in the United States: clinical and epidemiologic features. Ann. Intern. Med. 126:505-513. [DOI] [PubMed] [Google Scholar]
- 53.Stearns-Kurosawa, D. J., V. Collins, S. Freeman, V. L. Tesh, and S. Kurosawa. 2010. Distinct physiologic and inflammatory responses elicited in baboons after challenge with Shiga toxin type 1 or 2 from enterohemorrhagic Escherichia coli. Infect. Immun. 78:2497-2504. [DOI] [PMC free article] [PubMed] [Google Scholar]
- 54.Strockbine, N. A., et al. 1986. Two toxin-converting phages from Escherichia coli O157:H7 strain 933 encode antigenically distinct toxins with similar biologic activities. Infect. Immun. 53:135-140. [DOI] [PMC free article] [PubMed] [Google Scholar]
- 55.Teel, L. D., A. R. Melton-Celsa, C. K. Schmitt, and A. D. O'Brien. 2002. One of two copies of the gene for the activatable Shiga toxin type 2d in Escherichia coli O91:H21 strain B2F1 is associated with an inducible bacteriophage. Infect. Immun. 70:4282-4291. [DOI] [PMC free article] [PubMed] [Google Scholar]
- 56.Tesh, V. L., et al. 1993. Comparison of the relative toxicities of Shiga-like toxins type I and type II for mice. Infect. Immun. 61:3392-3402. [DOI] [PMC free article] [PubMed] [Google Scholar]
- 57.Tyrrell, G. J., et al. 1992. Alteration of the carbohydrate binding specificity of verotoxins from Gal alpha 1-4Gal to GalNAc beta 1-3Gal alpha 1-4Gal and vice versa by site-directed mutagenesis of the binding subunit. Proc. Natl. Acad. Sci. U. S. A. 89:524-528. [DOI] [PMC free article] [PubMed] [Google Scholar]
- 58.Wadolkowski, E. A., L. M. Sung, J. A. Burris, J. E. Samuel, and A. D. O'Brien. 1990. Acute renal tubular necrosis and death of mice orally infected with Escherichia coli strains that produce Shiga-like toxin type II. Infect. Immun. 58:3959-3965. [DOI] [PMC free article] [PubMed] [Google Scholar]
- 59.Zheng, J., et al. 2008. Identification and characterization of Shiga toxin type 2 variants in Escherichia coli isolates from animals, food, and humans. Appl. Environ. Microbiol. 74:5645-5652. [DOI] [PMC free article] [PubMed] [Google Scholar]
- 60.Zotta, E., N. Lago, F. Ochoa, H. A. Repetto, and C. Ibarra. 2008. Development of an experimental hemolytic uremic syndrome in rats. Pediatr. Nephrol. 23:559-567. [DOI] [PubMed] [Google Scholar]