Abstract
Alpha herpesviruses infect the vertebrate nervous system resulting in either mild recurrent lesions in mucosal epithelia or fatal encephalitis. Movement of virions within the nervous system is a critical factor in the outcome of infection; however, the dynamics of individual virion transport have never been assessed. Here we visualized and tracked individual viral capsids as they moved in axons away from infected neuronal cell bodies in culture. The observed movement was compatible with fast axonal flow mediated by multiple microtubule motors. Capsids accumulated at axon terminals, suggesting that spread from infected neurons required cell contact.
Many viruses spread by infecting nerve terminals and traveling from neuron to neuron in the vertebrate nervous system. The diseases resulting from these infections are usually debilitating and often fatal (1). Neurotropic herpesviruses (alpha herpesviruses) are an exception in that typical infections are confined to the peripheral nervous system (PNS) and are largely asymptomatic. Although the herpesvirus genome remains in the PNS for the life of the host, and newly reactivated virus made in neurons can retrace the path of primary infection and return to the surface to be shed, alpha herpesviruses rarely spread from the PNS into the central nervous system. In instances when this does occur, the resulting encephalitis has severe consequences (2). The mechanism by which alpha herpesvirus restrict their spread to the PNS is not known. In fact, because viruses are too small to visualize in living cells, the dynamics of viral transport has never been directly assessed for any neurotropic virus. Here we show that newly replicated individual herpesvirus capsids (125 nm diameter) bearing multiple copies of the green fluorescent protein (GFP) can be visualized and tracked in infected neurons by laser-scanning confocal time-lapse microscopy. We demonstrate that viral transport in axons is highly processive (continues over large distances without stopping) and bidirectional. Capsids travel long distances to ultimately accumulate at axon terminals, suggesting that virions do not bud out of axon terminals by a cell autonomous mechanism.
Materials and Methods
GFP-Capsid Virus [Pseudorabies Virus (PRV)-GS443] Construction.
The PRV-Becker UL35 gene was cloned as a ≈4.5 kb SalI fragment (3), along with the upstream UL34 gene, and both strands containing the two open-reading frames were sequenced (GenBank accession no. AF301599). The gfp open-reading frame was inserted into the PRV UL35 gene between codons two and three, following a strategy previously used with herpes simplex virus (HSV) type 1 (4). A recombinant virus, PRV-GS443, carrying the fusion allele in place of the wild-type UL35 gene, was made by using the pBecker3 infectious Escherichia coli clone (5).
Neuron Culture and Infection.
Dissociated sensory neurons from the dorsal root ganglia (DRG) of embryonic day 8–10 chick embryos were seeded on 22-mm square glass coverslips pretreated with polyornithine at ≈100 neurons/coverslip. The neurons were cultured for 3–5 days to allow for axon outgrowth before infection with the GFP-capsid virus (6). Peripheral sensory neurons do not have dendrites in situ (7), and only axons extend from DRG neurons in culture (8, 9). Axons were identified as long projections that did not taper. Because the number of neurons on a single glass coverslip was kept low to prevent axons from contacting each other, much of the coverslip was exposed to the viral inoculum. We found that the majority of the input virions bound directly to the coverslip, as assessed by GFP emissions, and never came into contact with the cultured neurons. To infect all neurons on a single coverslip, each sample was incubated with ≈1 × 10⁵ plaque-forming units of GFP-capsid virus for 1 h (incubating with fewer plaque-forming units resulted in less than 100% of neurons becoming infected; data not shown). Unbound virus was then washed away before incubation was allowed to continue.
Confocal Microscopy.
For time-lapse recording of living cells, individual coverslips of infected neurons were sealed onto a glass slide in Hepes-buffered media (pH 7.4) by using a 1:1:1 mixture of Vaseline, beeswax, and lanolin. GFP emissions from infected neurons were then imaged at 37°C with a Zeiss 510 laser-scanning confocal microscope fitted with a heated stage and a heated 63 × 1.4 n.a. oil objective. Excitation was at 488 nm with an argon laser, and up to 1,000 frames were captured per recording. For immunofluorescence, coverslips of infected neurons were fixed, permeabilized, and reacted with a mouse monoclonal anti-gB (“M2”) antibody (10). The secondary antibody was a goat anti-mouse conjugated to Alexa 546 (Molecular Probes). GFP capsids were excited with a 488-nm argon laser, and Alexa 546 was excited with a 543-nm HeNe laser.
Quantitation of GFP Fluorescence.
Individual GFP punctae observed in samples of isolated capsids were measured for total emission intensity by summing the values of all its pixels after first correcting pixel values by subtracting background emission. The GFP emissions of punctae seen in the axons of living neurons were measured in the same way as above, except that the pixel values were corrected by subtracting the emission background of the axon, which developed notable background fluorescence during infection.
Results
A mature herpes virion comprises a DNA genome surrounded by an icosahedral capsid shell made up of four virally encoded proteins. An assortment of additional viral proteins, collectively called the tegument, surround the capsid, which in turn is enclosed by a lipid bilayer. Herpesvirus assembly and transport out of infected cells are coupled, and only the capsid proteins are known to be continually associated with the viral genome during intracellular transport. By fusing GFP to a capsid protein, GFP signal remains associated with the DNA genome of the virus during assembly and exit from infected cells.
We first cloned and sequenced the UL35 gene from PRV (GenBank accession no. AF301599). This gene is homologous to the HSV UL35 gene that encodes the VP26 capsid protein. Fusion of GFP to the N terminus of HSV and PRV VP26 does not inhibit VP26 assembly into capsids or substantially affect viral growth and spread in culture [(4); data not shown]. Additionally, because there are 900 copies of VP26 per capsid, individual GFP capsids produced sufficient fluorescence emissions to be imaged with the short exposure times necessary to perform rapid time-lapse microscopy.
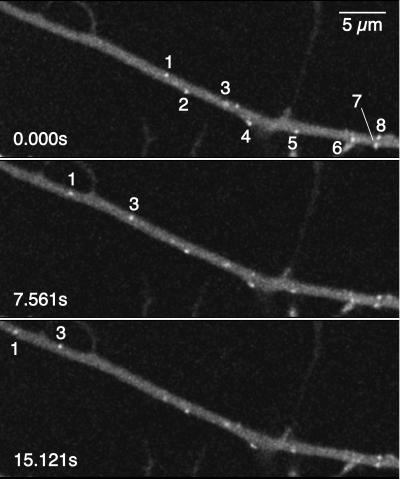
Neurons were seeded at low density to prevent axons from fasiculating, and only isolated neurons were examined. Axons of infected neurons frequently contained many punctae of GFP emission. By using time-lapse confocal recordings, some of these punctae were observed to move directionally within axons (Fig. 1; see Movies 1–3, which are published as supplemental data on the PNAS web site, www.pnas.org). Moving punctae in axons were most readily detected between 8–14 h postinfection (h.p.i.).
Figure 1.
Time-lapse recording of an axon of an infected DRG sensory neuron. A laser scan of the entire field was completed every 0.184 s (i.e., ≈5.4 frames/s) by using an argon laser with a 488-nm excitation, beginning at 13 h.p.i. Every fifteenth frame over a 15.121-s interval is shown. Several GFP punctae are visible (numbered 1–8), two of which were moving (numbers 1 and 3). The neuronal cell body was immediately outside the field of view to the right; therefore, the moving punctae were undergoing anterograde transport. For a complete time-lapse recording, see Movie 1 in the supplemental data (www.pnas.org). (Bar = 5 μm.)
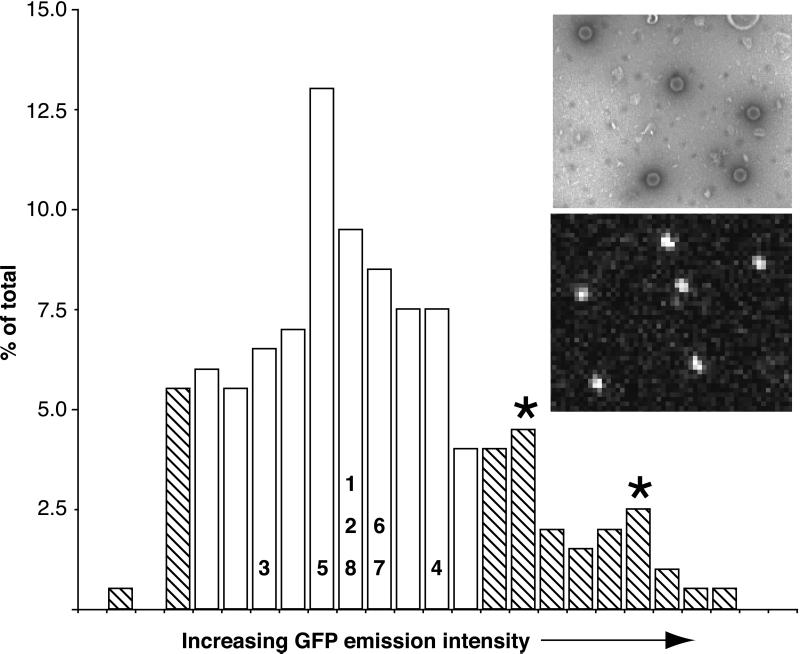
Although exact size determination was not possible, the observed punctae were small and uniform in size, consistent with individual fluorescent capsids. Although capsids are smaller than the spatial resolution of light optics, they should appear larger than actual size because of diffractive ballooning of the GFP emissions. This deduction was confirmed by isolating capsids from infected pig kidney epithelial (PK15) cells and dispersing the particles by sonication. The capsids were then examined by negative-stain electron microscopy and confocal microscopy (Fig. 2). By electron microscopy, 77% (n = 189) of all capsids in the preparation were observed to be both intact and isolated from other capsids by at least one capsid diameter (5% were not intact, and 18% were in clusters of two or more capsids). We used the same settings and optics for confocal scanning of the capsid sample as used for examining living neurons. In this way, the GFP emissions from 200 punctae were measured and plotted as a histogram (Fig. 2). By assigning the lower 5% to emissions from capsid fragments and the upper 18% to capsid clusters, we estimated an expected range of GFP emissions for single isolated capsid particles. Comparison of this emission profile to emissions from punctae in infected axons indicated that the source of the punctae were individual viral capsids. Although we occasionally observed motile punctae with emissions 2- to 3-fold greater than expected for single capsids, large clusters of capsids were never observed moving in axons.
Figure 2.
Comparison of GFP-emission intensities of punctae in axons and isolated capsids. A profile of 200 GFP-emission intensities from punctae observed by confocal microscopy (Bottom Inset) are plotted as a histogram. On the basis of electron microscopy observations (Top Inset; capsids appear as hexagons), the emission profiles corresponding to individual intact GFP capsids (open bars) were estimated by assigning the lowest and highest emission values to fragmented capsids and capsid clusters respectfully (hatched bars). Two minor peaks in the upper hatched region may reflect clusters of two and three capsids (asterisks). The emissions of the axon punctae from Fig. 1 are overlaid on the histogram with numbers corresponding to those from Fig. 1. Top Inset width ≈2.0 μm; Bottom Inset width ≈7.5 μm.
Individual capsids were followed by using high-resolution particle tracking to determine their location as a function of time. Successive images of axons were captured at 0.1- to 1.0-s intervals, and individual capsids were followed as they moved through the entire field of view (typically 30 μm). Recordings were made with a bias toward axons displaying significant capsid motility, and only axons that were isolated from other neurons were analyzed. In this way, more than 200 capsids were tracked from 28 time-lapse confocal recordings. On average, capsids moved in an anterograde direction, away from the neuronal cell body. However, capsids frequently reversed direction, moving toward the neuronal cell body (retrograde travel) before resuming anterograde travel (www.pnas.org). Some capsids moved predominantly in the retrograde direction, but these also had periods of anterograde travel. Because capsids could have a long period of anterograde travel (>10 μm) followed by a long period of retrograde travel, the population of retrograde moving capsids were not necessarily distinct from the anterograde moving capsids. Capsids moving in the retrograde direction were less common than those moving in the anterograde direction, with a ratio of anterograde-to-retrograde-moving capsids of approximately 7:1.
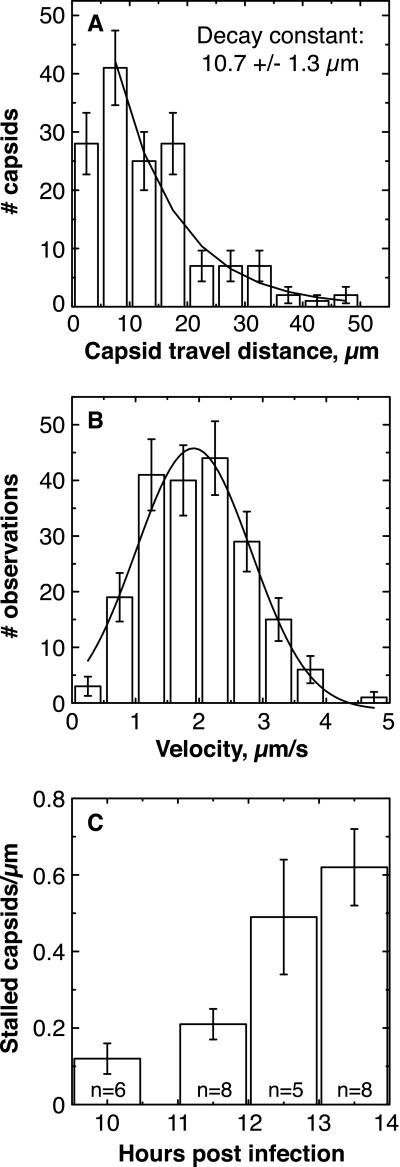
The processivity and velocity of capsid movement were quantitated by examining individual capsid runs. A run was defined as a period of uninterrupted travel lacking pauses or reversals in direction. To be classified as a pause, motion needed to stop for more than a second. By using these criteria, the average length of an anterograde run was 13.1 ± 0.6 μm (mean ± SEM, n = 198), and the standard deviation of this mean was large (9.0 μm), as the distribution of runs approximated a decaying exponential distribution (Fig. 3A). This number is an underestimate of the actual average travel distance, because long runs were prematurely classified as ended when the capsid moved out of the field of view (www.pnas.org). The average velocity of all anterograde runs was 1.97 ± 0.06 μm/s (mean ± SEM, n = 198), with top average speeds of ≈5 μm/s (instantaneous speeds were sometimes greater) (Fig. 3B). The average length of a retrograde run was 6.8 ± 1.2 μm (mean ± SEM, n = 33), with an average velocity of 1.28 +/− 0.12 μm/s. We note that capsid velocities decreased slightly late in infection (>12 h.p.i.) (data not shown).
Figure 3.
Analysis of capsid movement. (A) Histogram of lengths of
anterograde runs. Error bars are expected uncertainty, assuming
Gaussian statistics N).
The smooth curve is the best fit decaying exponential (reduced
χ2 = 1.24; P = 0.28); bin 1 was
excluded from the fit because our temporal resolution was insufficient
to resolve short runs. An exponential distribution is consistent with
processivity-determined runs. The maximum length of observed runs was
experimentally limited by the size of the observation window (30–50
μm). (B) Histogram of velocities of anterograde runs.
Each data point used in the histogram was the average velocity of a
moving capsid, calculated by dividing the spatial length of the run by
its temporal duration. Error bars are expected uncertainty, assuming
Gaussian statistics  . The
smooth curve is the best fit Gaussian (reduced χ2 =
1.02; P = 0.40) with a mean of 1.979 ± 0.063
μm/s and a width of 1.621 ± 0.121 μm/s.
(C) The number of stalled capsids per micrometer of axon
increased with time postinfection. This number was determined by
examining approximately 30 μm of each axon during an entire
recording, usually approximately 2 min in duration. The
n value in each bar is the number of different axons
examined. Error bars indicate the experimentally determined standard
error. Early data were pooled, resulting in the uneven spacing of bars
along the abscissa.
Anterograde flux, or the frequency of capsid transport, was determined by averaging the number of capsids entering the field of view (per unit time) moving in an anterograde direction. The flux varied significantly from axon to axon but did not change appreciably with time postinfection. These observations may be explained by the asynchronous infection of neurons within a sample and our bias to collect data from neurons exhibiting significant capsid motility. Bearing these considerations, the observed anterograde flux within individual axons displayed a roughly Gaussian distribution (data not shown) and ranged from 0.010 to 0.067 capsids/s, with a mean of 0.047 ± 0.005 capsids/s (i.e., on average 1 capsid entered the field every 21 s). The average retrograde flux was 0.0072 ± 0.0015 capsids/s (i.e., 1 capsid every 139 s). The distribution of capsids entering the field of view was not random (i.e., χ2 analysis confirmed it was not well modeled by a Poisson process), but rather individual capsids had a tendency to travel in closely spaced clusters (data not shown).
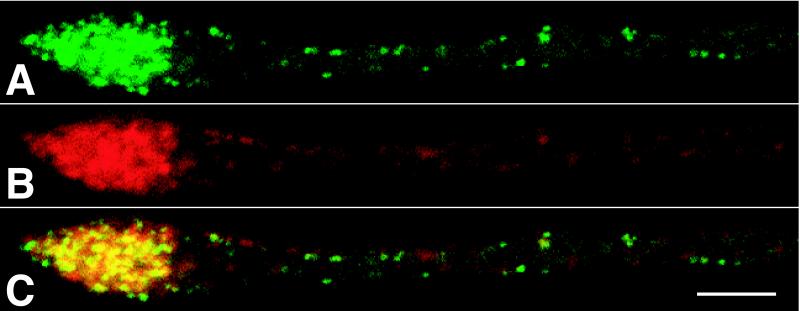
Some capsids were observed to stall during axonal transport and never regained motility during the remainder of a recording. In addition, axons frequently exhibited stalled capsids that never moved during the duration of a recording. The average number of stalled capsids per micrometer of axon increased by roughly 0.16 capsids/μm/h.p.i. (Fig. 3C). Therefore, over a 30-μm stretch of axon, 4.8 capsids/hr were lost from the flow because of stalling. This represents 3% of the total flow of 171 capsids/hr (based on the anterograde flux of 0.047 capsids/s). The majority of capsids accumulated at axon terminals (Fig. 4). To a lesser extent, accumulations were also observed at varicosities, mid-axon, and in the initial segment of the axon adjacent to the neuronal cell body (data not shown). Axon terminals accumulated capsids along with the viral structural membrane proteins including gB, gC, gE, and gI (Fig. 4 and data not shown).
Figure 4.
Capsid and glycoprotein accumulation at axon terminals. Direct fluorescence of GFP-capsids (A) and indirect immunofluorescence of viral membrane protein gB (B) are shown. An overlay of A and B is shown in C. The terminal is visible at Left, whereas the cell body is out of the field to the right. Cells were fixed at 15 h.p.i. Time-lapse recordings of capsid accumulation at axon terminals are available as Movie 3 in the supplemental data (www.pnas.org). (Bar = 5 μm.)
Discussion
These results indicate that individual alpha herpesvirus capsids are transported in axons at rates within the range of fast axonal flow during exit from a neuron (11). Capsids are not transported as large aggregates. Because fast axonal flow depends on microtubule motors, capsid transport is likely mediated by two or more plus-end microtubule motors. Even at frame rates approaching 0.1 frames/s, anterograde capsid runs were longer than can be accounted for by the processivity of single kinesin in vitro (12). The anterograde velocities were modeled by a Gaussian curve, indicating that motion is driven by a single class of plus-end motors. If two different types of motors were involved, each with its own preferred velocity, we would expect a curve with either two peaks (if their preferred velocities were far apart) or distorted (if their preferred velocities were not well separated). Although the criteria used in defining runs made possible short undetected pauses that would give inflated processivity figures, such pauses were deemed unlikely because of the observation of numerous runs of 15 μm or longer whose instantaneous velocity was never less than 2.5 μm/s.
A minus-end motor must also be present to account for the observed bidirectionality of the capsids. Because newly replicated capsids move bidirectionally during egress, but with net anterograde travel, we hypothesize that during entry into neurons, capsids transported to the cell body from an axon terminal would use a similar mechanism that favors retrograde travel (13). We are currently investigating viral entry dynamics in this system.
On average, the rates of capsid transport reported here are approximately 3-fold greater than had been previously estimated for HSV by using a dual cell culture chamber system (14). In the earlier study, anterograde transport of virus from neurons in a central chamber to epithelial cells in an outer chamber was estimated to occur at rates of 2–3 mm/h (0.56–0.83 μm/s), on the basis of the presence of viral antigen in axons near the epithelial cells. The difference in rates is likely attributed to the assays used by the two studies. The rates presented here are a direct measure of individual capsid transport; in contrast, measurements made in the dual chamber model are compounded by the kinetics of viral replication and viral transport to axons from the cell bodies within infected neurons. Thus, transport rates measured in the dual chamber model are likely underestimates of actual capsid velocities.
To our knowledge, this work is the first direct measure of viral anterograde transport kinetics in infected neurons for any neurotropic virus. Although several studies have estimated the rates of retrograde axonal transport of neurotropic viruses (15), a recent report has directly measured the rates of HSV transport in the retrograde direction by using severed segments of giant axon from the squid, Loligo paelei (13). Although the squid is not a host for HSV, the results indicate that retrograde transport of a viral tegument protein fused to GFP occurred at rates averaging 2.2 μm/s. This rate is similar to the 1.97 μm/s average velocity of anterograde moving capsids during egress but is faster than the 1.28 μm/s average velocity for capsids moving in the retrograde direction during egress reported here. The faster rate of retrograde travel seen in the squid model may reflect a difference in entry and egress kinetics or differences in transport of viral tegument proteins and capsids. Alternatively, because the virus likely uses host machinery for fast axonal transport, the differences in retrograde rates may reflect differences in invertebrate and vertebrate cell biology.
We observed that capsid and viral membrane proteins accumulate at axon terminals and are not released. Alpha herpesviruses are competent to spread from axon terminals of cultured DRG neurons to epithelial cells (14) and spread transsynaptically in the chicken embryo nervous system (16). Therefore, virus release from terminals may require cell–cell contact, and the nature of the innervated cell may be a cue for regulated herpesvirus spread in the nervous system. Because the cultured neurons used in this report lack natural target cells, the axon terminals are presumably growth cones (6). By using PRV infectious clone technology (5), we are now in a position to identify viral genes necessary for anterograde and retrograde transport in axons, as well as for virion assembly and release from axon terminals.
Supplementary Material
Acknowledgments
We thank J. Goodhouse for expert help with confocal and electron microscopy; E. Wieschaus and the Howard Hughes Medical Institute for initial financial support for S.G., as well as providing funding for the microscope heating elements; C. Smith for providing training with chicken DRG culture; D. Ginty (Johns Hopkins University School of Medicine, Baltimore) for generously supplying us with purified nerve growth factor; S. Block for encouragement; and E. Cox, A. Flood, and W. Bresnahan for insightful comments on the manuscript. G.S. is a Lilly Fellow of the Life Sciences Research Foundation.
Abbreviations
- PRV
pseudorabies virus
- PNS
peripheral nervous system
- DRG
dorsal root ganglion
- GFP
green fluorescent protein
- h.p.i.
hours postinfection
- HSV
herpes simplex virus
Footnotes
Data deposition: The sequence reported in this paper has been deposited in the GenBank database (accession no. AF301599).
References
- 1.Schled W M, Whitley R J, Durack D T. Infections of the Central Nervous System. New York: Raven; 1991. p. 937. [Google Scholar]
- 2.Enquist L W, Husak P J, Banfield B W, Smith G A. Adv Virus Res. 1998;51:237–347. doi: 10.1016/s0065-3527(08)60787-3. [DOI] [PubMed] [Google Scholar]
- 3.Simon A, Mettenleiter T C, Rziha H J. J Gen Virol. 1989;70:1239–1246. doi: 10.1099/0022-1317-70-5-1239. [DOI] [PubMed] [Google Scholar]
- 4.Desai P, Person S. J Virol. 1998;72:7563–7568. doi: 10.1128/jvi.72.9.7563-7568.1998. [DOI] [PMC free article] [PubMed] [Google Scholar]
- 5.Smith G A, Enquist L W. Proc Natl Acad Sci USA. 2000;97:4873–4878. doi: 10.1073/pnas.080502497. . (First Published April 18, 2000; 10.1073/pnas.080502497) [DOI] [PMC free article] [PubMed] [Google Scholar]
- 6.Smith C L. In: Culturing Nerve Cells. Banker G, Goslin K, editors. Cambridge, MA: MIT Press; 1998. pp. 261–287. [Google Scholar]
- 7.Kandel E R, Schwartz J H, Jessell T M. Principles of Neuroscience. Norwalk: Appleton and Lange; 1991. p. 1135. [Google Scholar]
- 8.Letourneau P C, Shattuck T A. Development (Cambridge, UK) 1989;105:505–519. doi: 10.1242/dev.105.3.505. [DOI] [PubMed] [Google Scholar]
- 9.Kamiguchi H, Lemmon V. J Neurosci. 1998;18:3749–3756. doi: 10.1523/JNEUROSCI.18-10-03749.1998. [DOI] [PMC free article] [PubMed] [Google Scholar]
- 10.Hampl H, Ben-Porat T, Ehrlicher L, Habermehl K O, Kaplan A S. J Virol. 1984;52:583–590. doi: 10.1128/jvi.52.2.583-590.1984. [DOI] [PMC free article] [PubMed] [Google Scholar]
- 11.Hirokawa N. Science. 1998;279:519–526. doi: 10.1126/science.279.5350.519. [DOI] [PubMed] [Google Scholar]
- 12.Block S M, Goldstein L S, Schnapp B J. Nature (London) 1990;348:348–352. doi: 10.1038/348348a0. [DOI] [PubMed] [Google Scholar]
- 13.Bearer E L, Breakefield X O, Schuback D, Reese T S, LaVail J H. Proc Natl Acad Sci USA. 2000;97:8146–8150. doi: 10.1073/pnas.97.14.8146. [DOI] [PMC free article] [PubMed] [Google Scholar]
- 14.Penfold M E T, Armati P, Cunningham A L. Proc Natl Acad Sci USA. 1994;91:6529–6533. doi: 10.1073/pnas.91.14.6529. [DOI] [PMC free article] [PubMed] [Google Scholar]
- 15.Sodeik B. Trends Microbiol. 2000;8:465–472. doi: 10.1016/s0966-842x(00)01824-2. [DOI] [PubMed] [Google Scholar]
- 16.Banfield B W, Yap G S, Knapp A C, Enquist L W. J Virol. 1998;72:4580–4588. doi: 10.1128/jvi.72.6.4580-4588.1998. [DOI] [PMC free article] [PubMed] [Google Scholar]
Associated Data
This section collects any data citations, data availability statements, or supplementary materials included in this article.


