

Abstract
Sulfur is an essential nutrient that can exist at growth-limiting concentrations in freshwater environments. The freshwater cyanobacterium Fremyella diplosiphon (also known as Tolypothrix sp. PCC 7601) is capable of remodeling the composition of its light-harvesting antennae, or phycobilisomes, in response to changes in the sulfur levels in its environment. Depletion of sulfur causes these cells to cease the accumulation of two forms of a major phycobilisome protein called phycocyanin and initiate the production of a third form of phycocyanin, which possesses a minimal number of sulfur-containing amino acids. Since phycobilisomes make up approximately 50% of the total protein in these cells, this elemental sparing response has the potential to significantly influence the fitness of this species under low-sulfur conditions. This response is specific for sulfate and occurs over the physiological range of sulfate concentrations likely to be encountered by this organism in its natural environment. F. diplosiphon has two separate sulfur deprivation responses, with low sulfate levels activating the phycobilisome remodeling response and low sulfur levels activating the chlorosis or bleaching response. The phycobilisome remodeling response results from changes in RNA abundance that are regulated at both the transcriptional and posttranscriptional levels. The potential of this response, and the more general bleaching response of cyanobacteria, to provide sulfur-containing amino acids during periods of sulfur deprivation is examined.
Cyanobacteria are one of the most widely distributed groups of microorganisms on Earth and have an impressive array of responses to macronutrient stresses. For example, under conditions of insufficient amounts of exploitable combined nitrogen, diazotrophic cyanobacteria have the capacity to fix atmospheric nitrogen (24, 65), and it has been proposed that nondiazotrophs may use the proteins and chromophores that make up their photosynthetic light-harvesting antennae, or phycobilisomes (PBS), as a nitrogen source (61-63). Low levels of phosphorus may induce phosphate uptake systems and initiate the release of this nutrient from polyphosphate stores within the cell, while the depletion of sulfur leads to the induction of sulfate transport systems and the production and export of sulfate-binding proteins into the external environment (8, 53). Unlike for nitrogen and phosphorus, cyanobacteria are not believed to be capable of storing sulfur in specific intracellular structures. Therefore, these cells need strategies to deal with variable sulfur availability in habitats such as freshwater environments, where it often may become limiting (23, 28).
The freshwater filamentous cyanobacterium Fremyella diplosiphon UTEX 481 (also known as Tolypothrix sp. strain PCC 7601) has a fascinating elemental sparing response to sulfur deprivation. This organism has three separate cpc operons, encoding three distinct forms of the PBS protein phycocyanin (PC) and associated linker proteins, which enhance the absorption of red light energy for photosynthesis. Two of these, cpc1 and cpc2, are expressed under sulfur-replete conditions, while the third, cpc3, is expressed when sulfur availability is limited (41, 57). PC2 (encoded by the cpc2 operon) makes up the outer regions of the PBS, while PC1 (encoded by the cpc1 operon) is found in the interior, associated with the inner core region, which is made up primarily of allophycocyanin (APC) (27). PC, APC, and other PBS chromoproteins such as phycoerythrin (PE) are heterodimers, consisting of chromophorylated α and β subunits. Previous analysis of the amino acid compositions of the three PC protein sets from F. diplosiphon revealed that unlike the PC1 and PC2 proteins and their associated linker peptides, the PC3 proteins and associated linkers contained no methionines and only the cysteines required for covalent attachment of chromophores to the α and β subunits (41). These findings led to the proposition that F. diplosiphon undergoes a “PBS remodeling” response under low-sulfur conditions, with PC1 and PC2 being replaced by PC3, allowing the cells to continue to grow with no obvious phenotypic change even as they are replacing relatively sulfur-rich PBS with sulfur-poor equivalents. This remodeling response to sulfur availability has become a widely recognized example of phenotypic plasticity (1, 50). Because PBS proteins make up to 50% of the total protein in cyanobacterial cells (13), these changes represent an extreme case of “proteome remodeling,” where cells actively and reversibly alter the elemental composition of their proteome in response to the availability of specific elements in their environment (21).
Chlorosis or bleaching is a relatively well studied cyanobacterial response to the loss of macronutrients in the environment which initially involves the trimming and proteolysis of the outer portions of the PBS and, eventually, degradation of the entire PBS and chlorophyll a (2, 14, 35, 53, 62). For many nondiazotrophic cyanobacteria, such as Synechococcus sp. strain PCC 7942, bleaching is most evident after nitrogen or sulfur loss and less pronounced after the loss of phosphorus (14). PBS degradation during nutrient starvation is also likely to protect cyanobacterial cells from photodamage (8) and has been proposed to serve a secondary role of releasing the nitrogen present in the PBS proteins and linear tetrapyrrole chromophores for reuse in the cell (61-63). Although in many cyanobacteria, sulfur deprivation results in PBS degradation similar to that caused by nitrogen deprivation, historically PBS have not been considered to have the potential to be effective sulfur storage structures (8, 14, 26, 52, 66).
Efforts to understand the regulation of the bleaching response have uncovered several genes that, when mutated, reduce or eliminate chlorosis. These include nblA, nblB, nblC, nblR, nblS, ald, as well as sll1961 of Synechocystis sp. PCC 6803 and Synechococcus elongatus sp. PCC 7942 (15, 18, 34, 49, 54, 56, 59). The mechanisms through which Nbl proteins operate are being intensively studied (9, 17, 20, 30-32, 36, 47, 48, 60, 64). However, relatively few studies have examined the expression or regulation of the genes encoding the PBS proteins during sulfur starvation (14, 41, 56, 66). Transcript levels of the PBS-encoding genes have been found to decrease within 2 to 48 h. This decrease was shown to not be influenced by NblC, a regulator of the bleaching response, at least for cpcBA RNA in S. elongatus sp. PCC 7942 (56), but nothing more has been reported on the influence of Nbl components on PBS gene expression. Thus, the specific mechanism through which the PBS-encoding genes are downregulated during sulfur-mediated bleaching remains unclear.
In addition to its sulfur-mediated PBS remodeling response, F. diplosiphon regulates PBS composition in response to changes in ambient light color via a process called complementary chromatic acclimation (CCA) (25, 33, 58). Of the three cpc operons, only cpc2 has been shown to be CCA controlled, being highly expressed in red light (RL) and virtually off in green light (GL) (16). Another gene upregulated in RL is pcyA, which encodes the enzyme required for the synthesis of phycocyanobilin, the PC and APC chromophore (5). In GL, cpc2 is downregulated, while cpeBA, which encodes the only set of PE α/β apoproteins, is upregulated (22, 39). The CCA regulation of the known GL-active genes occurs through two distinct pathways, the Rca and the Cgi systems (33), while the Rca system, which operates at the transcriptional level, alone controls the RL upregulation of cpc2 and pcyA (5, 37). How F. diplosiphon integrates its CCA and sulfur-sparing responses is currently unknown.
In this report, we analyze the sulfur-dependent PBS-remodeling response of F. diplosiphon in greater detail. We conduct an initial examination of how the PBS remodeling response is regulated and how this regulation is integrated with the CCA response of this organism. Our results show that this process is sulfate specific, independent of but integrated with CCA, and controlled at both the transcriptional and posttranscriptional levels. Finally, we provide bioinformatics data that support the hypothesis that many cyanobacteria have the potential to effectively use PBS for sulfur storage, perhaps even more than for nitrogen storage. Thus, in some cyanobacterial species, it is possible that in addition to photoprotection, another function of bleaching during sulfur deprivation is to release physiologically important amounts of sulfur-containing amino acids into the cell to support further growth.
MATERIALS AND METHODS
Media, growth conditions, and spectral measurements.
Sulfate-limited BG-11 medium is defined as containing 15 μM sulfate, previously reported to induce cpc3 (41). “No-sulfate” BG-11 (−S) medium was made by replacing the MgSO4 with an equivalent amount of MgCl2. Sulfate-replete (standard) BG-11 medium contains 300 μM sulfate (46). Cultures were bubbled with air containing 3% CO2 at 30°C to an absorbance at 750 nm (A750) of approximately 0.75 in 15 to 20 μmol photons m−2 s−1 of RL or GL. When buffers were used (at pH 8.0), HEPES was used at 20 mM and diglycine at 7.6 mM, and the pH values of these media did not change significantly after the growth of the cells to stationary phase. Whole-cell spectral readings were made as described previously (55). For growth curve measurements, cells were grown in RL in replete medium to an A750 of approximately 0.75, centrifuged at 5,000 × g for 10 min and washed and centrifuged three times as before with an equal volume of either BG medium without phosphate (−P), nitrogen (−N), or sulfate (−S) or replete (R) BG-11 medium and then resuspended at an A750 of 0.25 in the same medium type in triplicate. BG-11−N medium was made by replacing NaNO3 with the same molar amount of NaCl, and BG-11−P medium was made by replacing the K2HPO4 with the same ionic molar amount of KCl.
Bioinformatics analysis of elemental compositions of predicted proteomes and PBS.
The sequences of all open reading frames (ORFs) of selected cyanobacterial sequenced genomes were retrieved from the Joint Genome Institute (JGI) Integrated Microbial Genome (IMG) database. The unpublished genome of F. diplosiphon was used for predicted proteome data (G. Weinstock and D. M. Kehoe, unpublished data). Each of the PBS protein sequences used in the analysis was found by using an integrated BLAST function within the IMG database and the sequences of F. diplosiphon PBS proteins as queries (3). The atomic compositions of sequences (both individual PBS proteins and entire predicted proteomes) were extracted using the MATLAB (Natick, MA) “atomiccomp” function within the Bioinformatics Toolbox. Starting methionines, when present, were not counted. For each predicted protein or proteome, the mean percentages of sulfur and nitrogen per amino acid were calculated by summing the sulfur or nitrogen atoms within the selected sequence, dividing it by the total length of that sequence, and multiplying by 100.
To calculate PBS sulfur and nitrogen contents, the relative abundance of every major PBS component was taken into account by using the stoichiometries of these proteins within a model PBS from RL-grown cells containing a tricylindrical core and six associated rods. The nomenclature used for PBS genes and proteins followed those used for F. diplosiphon. Minor protein components of the PBS cores were not included in the analysis. The phycocyanobilin chromophores attached to each subunit of the PC and APC proteins were taken into account in the calculation of total nitrogen content. The model PBS core contained 36 ApcA and 36 ApcB, three ApcC core linkers, and two ApcE core-membrane linkers. Rods for each species were modeled as follows: if two sets of cpc genes were detected in the genome, 36 subunits of CpcB1 and 36 subunits of CpcA1 (the proximal disc) and 72 subunits of CpcA2 and 72 of CpcB2 (the two distal discs), one rod-core linker (CpcG), and one rod linker of each type (CpcH, CpcI, and CpcD) were used. cpc1 or cpc2 genes were distinguished based on the presence of rod linker genes in the same operon as cpcB and cpcA. If present, they were designated cpcB2 or cpcA2. When only one set of PC was detected in a genome, 108 copies of CpcA and 108 copies of CpcB were used. The only adjustments to these models were for Acaryochloris marina, which has one rod-based PBS (38), Synechoccocus sp. strain WH8102, for which only the proximal PC set is encoded in the genome, and F. diplosiphon, for which only CpcB3 and CpcA3 and associated linker proteins were used for rods in cells grown in the absence of sulfate. When there was more than one copy of linker (or PC, such as in A. marina) genes in the genome, only one was included in the model. Use of alternative linkers or PC protein sequences had little effect on the final values. These cases are indicated by the presence of a number in the column labeled “# subunits” in Table 2 of the supplemental material. For Anabaena (Nostoc) sp. strain PCC 7120, phycoerythrocyanin subunits were used as a CpcB2 and CpcA2.
RNA blot analysis.
RNA blot analysis was conducted as described previously (6, 55). The probe used for cpc1 was made using PCR amplification with primers cpc1probeus (5′-AAGAAGCAGGTTTTCCATCCATC-3′) and cpc1probeds (5′-TTAGTTTAGTCGAGTATGGCTTG-3′). The probe for cpc3 was made using PCR amplification with primers B3A3P1 (5′-GGAGAATCACACTATGGTGCAA-3′) and B3A3P2 (5′-AAATCGCATAGGTAACGTAGCG-3′). Blots were imaged using a GE Healthcare Typhoon variable mode imager, and data were quantified using ImageQuant TL image analysis software.
High-performance liquid chromatography (HPLC) and mass spectrometric analysis of PBS.
PBS complexes were prepared from 50-ml volumes of cultures grown to an A750 of 0.5 in either BG-11 or BG-11−S medium as previously described (14). PBS were dialyzed against 2 liters of dialysis buffer (40 mM K2HPO4, 10 mM NaH2PO4, pH 7.5) overnight at 4°C using a Slyde-A-Lyzer 3.5K dialysis cassette (Pierce) and concentrated to approximately 300 μl using Amicon Ultra centrifugal filter devices (10,000 molecular weight cutoff [MWCO]; Millipore, Billerica, MA) and Microcon centrifugal filter devices (10,000 MWCO; Millipore). Protein concentrations were determined using a Pierce (Rockford, IL) BCA protein assay kit.
For HPLC analysis, PBS were diluted with double-distilled water to a concentration of 2 mg/ml and myoglobin was added (10 μM final) as an internal standard. Eight microliters of each sample was run on an Agilent 1100 capillary liquid chromatograph using a 5-μm BioBasic C4 butyl reversed-phase column (1-mm inner diameter, 50 mm long; Thermo Hypersil-Keystone). The sample was eluted with an acetonitrile gradient at a flow rate of 50 μl/min. The sample was run for 1 min using 85% solvent A (consisting of 95% H2O, 5% acetonitrile, 0.1% formic acid, and 0.01% trifluoroacetic acid) and 15% solvent B (consisting of 5% H2O, 95% acetonitrile, 0.1% formic acid, and 0.01% trifluoroacetic acid). After 1 min, the flow was shifted to 30% solvent B for 23 min, to 60% solvent B for 2.5 min, and finally to 90% solvent B for 5 min. Peaks were detected by UV absorbance (216 nm) using an Agilent 1100 variable wavelength detector. Every peak was collected as a single fraction, and the fraction content was lyophilized in a SpeedVac (Savant). Lyophilized fractions were resuspended in 10 μl of bicarbonate buffer (50 mM NH4HCO3), and then 2 μl of dithiothreitol (DTT; 50 mM in 50 mM NH4HCO3) was added and samples were incubated for 1 h at 60°C. Two microliters of iodoacetamide (250 mM C2H4INO in 50 mM NH4HCO3) was added, and samples were incubated in the dark for 30 min at room temperature (RT). Ten microliters of trypsin was added to each sample, which was then incubated for 2 h at 37°C. The trypsin was inactivated with 2 μl of 1 M HCl. Samples were prepared for MALDI (matrix-assisted laser desorption ionization)-mass spectrometry by purifying the peptides with a C18 ZipTip (Millipore) eluted with 2 μl of a 0.5% concentration of α-cyano-4-hydroxycinnamic acid in 50% acetonitrile-0.1% trifluoroacetic acid. A 0.5-μl volume of this mixture was placed on the stainless steel target and allowed to dry. MALDI-time-of-flight (TOF) mass spectra (average, 2,000 shots) were recorded on an Applied Biosystems 4800 proteomics analyzer tandem time-of-flight mass spectrometer (Applied Biosystems, Foster City, CA). Tryptic peptide mass spectra (m/z 700 to 4,000) were interpreted with the peptide mass fingerprinting algorithm on a local copy of MASCOT software (42) to identify the proteins present in each HPLC fraction.
cpc3 transcript start site determination.
Primer extension was used to analyze RNA isolated from cells grown in RL and GL in sulfate-replete and sulfate-limited media. Primer cpc3-r (5′-CCATCACTTAGATATTCGCCT-3′) and the AMV primer extension system (Promega, Madison) were used according to the manufacturer's instructions to make radiolabeled RNA. A sequencing ladder template was made by PCR amplification using primers Xbacpc3-f (5′-cgctctagaGAATTCTATGTAAATTGATTATCTTC-3′) and Bamcpc3-r (5′-cgcggatccCCATCACTTAGATATTCGCCT-3′) (here and for other primer sequences, added sequences are indicated by lowercase letters, and restriction enzyme sites are underlined). The PCR product was cut with XbaI and BamHI and cloned into similarly cut pGem7Zf(+)* (Promega, Madison, WI) to make pPCs5′. The insert sequence was checked, and the Sequenase version 2.0 DNA sequencing kit (USB, Cleveland, OH) was used with primer cpc3-r to generate the sequencing ladder. Products were separated in a 5% polyacrylamide sequencing gel at 55 W for 3.5 h.
gusA reporter gene constructs.
cpc1 P+L (where P is the promoter and upstream region and L is the 5′ leader region) [also called pPCc(412)G; cpc1 DNA extends from positions −412 to +251] construction has been previously described (5, 11). To make cpc2 P+L, containing the region from −291 to +351 from the transcription start site (5), DNA from a PCR amplification using primers pcipL (5′-cgcgcatgcCATAAATACATTACAAAATCTGCTA-3′) and utr3′R (5′-cgcggatccGCCATTCCAGCATCTCCTAAAAATATTAC-3′) was cloned into the SphI and BamHI sites of plasmid p2.7GI (11). This plasmid is a translational fusion of the cpc2 promoter and leader region, joining the start codon of PC2β to the GusA-encoding sequence at the BamHI site of p2.7GI. Overlapping PCR amplification was used to create a translational fusion of the cpc3 promoter and 5′ leader (−431 to +265) to gusA. The start codon of PC3β was joined to the sequence encoding the second amino acid of GusA. The PCR amplification product obtained using cpc3 and primers cpc3pL (5′-gcggcatgcCTATGTAAATTGATTATCTTCAAAC-3′) and cpc3fus-r2 (5′-CACGGGTTGGGGTTTCTACAGGACGTAACATAGTGTGATTCTCCTAAATTTTGATTAATTGAGTAA-3′) was annealed to gusA that was PCR amplified using primers b3-fus-f2 (5′-GGAGAATCACACTATGTTACGTCCTGTAGAAACCCCAACCCGTGAAATC-3′) and gus-r (5′-TGATTCTATCGCGGCCTCGAC-3′). The annealed DNA was PCR amplified using primers cpc3pL and gus-r, and the product was cloned into the blunt-ended PstI site of pPL2.7 (12) in the same orientation as it was in p2.7GI. cpc3P+cpc1L was created by PCR amplification of cpc3 from −431 to +14 using primers cpc3pR (5′-gcgctgcagCCCTCTCAACCCTTACAAATTAT-3′) and cpc3pL. The product was cloned into the SphI and PstI sites of pPCi76LG (11). cpc1L was made by cloning the SphI-BamHI fragment of pL (11) containing the cpc1 leader region into the same sites of p2.7GI.
GUS assays.
Assay conditions were modified from previous protocols (11, 29). Transformed F. diplosiphon cells were grown in BG-11 medium supplemented with kanamycin (10 μg/ml) to an A750 of 0.7 in 15 μmol m−2 s−1 of RL or GL. Two hundred microliters was transferred to a 1.5-ml microcentrifuge tube and centrifuged at RT for 5 min at 12,000 × g. Pellets were washed in 1 ml of β-glucuronidase (GUS) assay buffer (50 mM sodium phosphate [pH 7], 1 mM EDTA) containing 6.25 μg/ml chloramphenicol and then resuspended in 1 ml GUS assay buffer. Twenty microliters of SDS and 40 μl of chloroform were added, and cells were vortexed at the maximum setting for 10 s. Assays were performed at RT in 96-well microtiter plates by mixing 20 μl of cell lysate with 180 μl of GUS assay buffer containing 1.25 mM α-p-nitrophenyl-β-d-glucuronide from Sigma (St. Louis, MO). Absorbance readings were taken every 2 min for 30 min at 405 nm using a SpectraMax 190 plate reader (Molecular Dynamics). GUS activity was determined by calculating the rate of absorbance change over time for each sample, normalizing the result to the total protein content as determined using the Pierce BCA reagent kit, and multiplying that value by an extinction coefficient of 0.063. GUS activity was quantified in nanomoles of product per minute per milligram of total protein.
Sulfate concentration response analysis.
F. diplosiphon cells were transformed with a plasmid capable of integrating at the cpeBA locus (pJCF5102761; a gift of John Cobley) and containing a cpc3::gusA translational fusion (−556 to +265 of cpc3) inserted in the NheI restriction site within the modified cpeBA sequence. The cpc3 region was PCR amplified using primers Nhe-cpc3-f (5′-cgcgctagcCGACTCGTAACAGACAACTTG-3′) and cpc3-fus-r2 (5′-CACGGGTTGGGGTTTCTACAGGACGTAACATAGTGTGATTCTCCTAAATTTTGATTAATTGAGTAA-3′). This product was annealed to gusA DNA that had been amplified using primers b3-fus-f2 (5′-GGAGAATCACACTATGTTACGTCCTGTAGAAACCCCAACCCGTGAAATC-3′) and NheGus-r (5′-gcggctagcTGATTCTATCGCGGCCTCGAC-3′) and PCR amplified using primers Nhe-cpc3-f and NheGus-r, creating a PCR product that fused the start codon of PC3β to the codon encoding the second amino acid of GusA. This product was cut with NheI and cloned into the NheI site of pJCF5102761 in the orientation opposite that of cpeBA. Transformed cells, which had lost the ability to produce PE, were grown in RL and BG-11 medium to an A750 of 0.8, centrifuged at 5,000 × g for 10 min, washed in double-distilled water, and centrifuged as before. For GUS assays, the washed cells were inoculated in 25 ml of BG-11 medium with diglycine (7.6 mM) or HEPES (20 mM) to an OD750 of 0.15 and grown for 5 days in RL. The initial concentrations of sulfate tested were 0, 15, 30, 60, 90, 150, 210, and 270 μM. The GUS assays were performed as described above. For measurements of the shift in PC absorbance, the washed cells were resuspended in BG-11 medium with HEPES, containing the appropriate sulfate concentration, to a final A750 of 0.5 in 96-well plates (Microtest; Becton Dickinson) (250 μl per well). The initial sulfate concentrations in the BG-11 media used were 0, 15, 30, 60, 90, 120, 150, 180, 210, 240, 270, and 300 μM. After 5 days in RL, absorbance in the visible region was recorded for each well using a SpectraMax 190 plate reader. Three independent biological replicates were conducted for each sulfate concentration.
RESULTS
F. diplosiphon grows slowly under low-sulfur conditions and can use HEPES as a sulfur source.
The growth of F. diplosiphon cells in BG-11 liquid medium buffered with diglycine slowed significantly 1 to 2 days after the sulfate concentration was reduced to either 15 μM or 0 μM (Fig. 1 A, left panel). Under these conditions, the cells exhibited a pronounced bleaching phenotype after 2 to 3 days, with a dramatically decreased PC absorption peak at ca. 620 nm (Fig. 1A, right panel), and significant growth ceased after 4 to 5 days. However, when HEPES (which contains a sulfonic acid group) was used instead of diglycine as the buffering agent, F. diplosiphon cells in 15 μM and 0 μM sulfate grew at a rate similar to that of cells in replete BG-11 medium over the 10 days of the experiment, with no detectable cell bleaching occurring and normal PC levels (Fig. 1B). This growth was not due to the presence of any other sulfur source, since Synechocystis sp. PCC 6803, which cannot use the sulfonic acid group of HEPES as a sulfur source (45, 66), ceased growing after 2 to 3 days in HEPES-buffered medium lacking sulfate (Fig. 1B, left panel, inset).
FIG. 1.

Growth, absorption characteristics, and color phenotypes of F. diplosiphon cells grown under different sulfur conditions and in different buffers. (A) Growth curves of F. diplosiphon cells grown in RL in replete medium buffered with diglycine and then switched to fresh replete (closed circles), 0 μM sulfate (open triangles), or 15 μM sulfate (closed triangles) media containing diglycine. An arrow indicates the point (day 6) at which the absorbance spectra and photographs were taken of cells grown under either replete (upper right) or 0 μM sulfate (lower right) conditions. (B) Growth curves of F. diplosiphon cells grown in RL in replete medium buffered with HEPES and then switched to replete (closed circles), 0 μM sulfate (open triangles), or 15 μM sulfate (closed triangles) media containing HEPES. An arrow indicates the point (day 6) at which the absorbance spectra and photographs were taken of cells grown under either replete (upper right) or 0 μM sulfate (lower right) conditions. The inset shows growth curves of Synechocystis sp. PCC 6803 cells grown in RL in replete medium buffered with HEPES and then switched to replete (closed circles) or 0 μM sulfate (open triangles) media containing HEPES. For growth curves: x axis, days after the media replacement; y axis, absorption at 750 nm. Error bars represent the standard errors of the mean.
cpc3 transcriptional activity is highest at low sulfate levels and remains strongly expressed even when an alternative sulfur source is available.
The growth of F. diplosiphon cells in the presence of HEPES demonstrated that this buffer was supplying sufficient sulfur for normal growth. cpc3 expression was previously shown to depend on sulfur limitation (41), but it was not shown whether this dependency was sulfate specific or a general sulfur deprivation response. RNA blot analysis demonstrated that cpc3 transcripts accumulated to high levels under low-sulfate conditions in BG-11 medium containing 20 mM HEPES, regardless of the color of light (Fig. 2 A). Thus, cpc3 transcript levels were responsive to low-sulfate conditions even when HEPES was being used by the cells to continue normal growth and avoid bleaching (Fig. 1B).
FIG. 2.
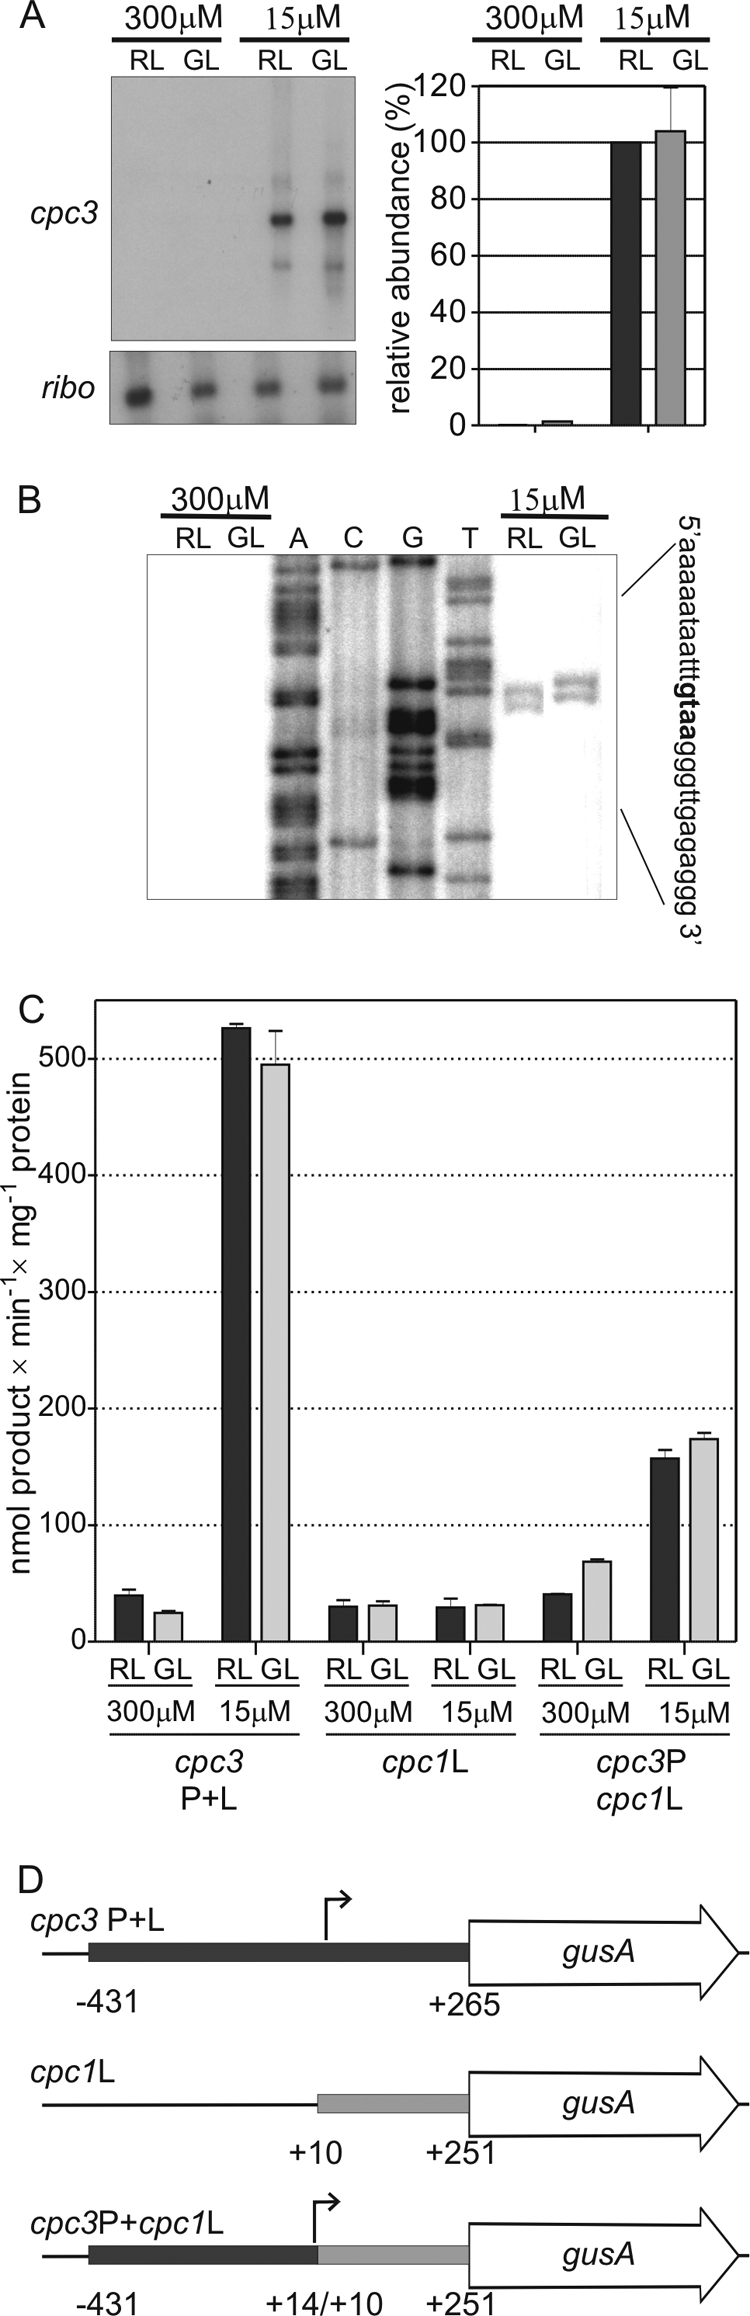
Characterization of cpc3 expression in response to sulfate availability. (A) Representative autoradiographs of RNA accumulation blots of cpc3 in F. diplosiphon cells grown in sulfate-replete and sulfate-limited media buffered with HEPES in RL and GL are presented on the left. The histograms on the right represent the mean level for the transcript under each condition based on three independent experiments, normalized using ribosomal (ribo) values, and expressed as percentages of RL, sulfate-limited levels, which were set to 100%. Error bars represent standard errors of the mean. (B) Representative autoradiograph used to identify the transcription start site of cpcB3 using primer extension and RNA extracted from cells grown in RL and GL in sulfate-replete and -limited media containing HEPES. Apparent start site nucleotides are shown in bold on the right. (C) Mean values of GUS activity in cells carrying plasmids containing gusA fused to cpc1 and cpc3 promoters and leader regions in RL and GL in sulfate-replete and sulfate-limited media. Three independent biological replicates were tested for each plasmid under each condition. Error bars are the standard errors of the mean. (D) Diagrams of the constructs used in panel C. Numbers are relative to the transcription start sites (small arrows) of cpc1 and cpc3, as appropriate.
To determine the level at which cpc3 expression was regulated, the 5′ endpoints of the cpc3 transcript were mapped so that transcriptional fusions to gusA could be made. Using primer extension, cpc3 RNA was detected only in cells grown in low sulfate, regardless of the color of light (Fig. 2B). The transcripts ended at a cluster of nucleotides between −265 and −263 upstream of the translation start codon, with a slightly different pattern in samples from RL- and GL-grown cells, although each had two endpoints that were approximately equally abundant. RNase protection assays confirmed the guanine at position −265 as the primary endpoint for this transcript (data not shown), and this nucleotide was designated +1. Subsequent nucleotide numbering for this and the other F. diplosiphon cpc genes are based on their transcription start sites.
Transcriptional and translational gene fusions to the gusA reporter gene were made and transformed into wild-type F. diplosiphon cells to determine the level(s) at which the expression of cpc3 was controlled by sulfate. The cpc3 upstream and 5′ leader sequences were used to make cpc3 P+L, which imparted strong sulfate responsiveness but no light color regulation (Fig. 2C and D). To test which region of cpc3 was responsive to sulfate levels, the cpc3 promoter and upstream region were joined to the 5′ leader region of cpc1 and gusA to make cpc3P+cpc1L (Fig. 2C and D). The cpc1 5′ leader by itself showed relatively low GUS activity regardless of sulfate availability, whereas cpc3P+cpc1L was 3- to 4-fold more active in low sulfate than high sulfate levels, although its activation in low sulfate levels was not as strong as for cpc3 P+L (Fig. 2C). Its expression also was not light color regulated.
The level of cpc3 expression was examined throughout a range of sulfate concentrations for cells growing in the absence and presence of HEPES as a sulfur source, by measuring GUS activity from a strain harboring the cpc3 P+L construct that had been integrated into the F. diplosiphon chromosome to reduce potential background GUS activity resulting from being carried on a plasmid. The extent of the response was assayed by measuring GUS activity in transformed cell lines. For cells grown in BG-11 medium buffered with HEPES, GUS activity increased gradually as sulfate levels decreased from 150 μM to 0 μM (Fig. 3A), although the cells remained blue-green (Fig. 3B). For cells grown in BG-11 medium buffered with diglycine in place of HEPES, an increase in cpc3 expression was also measured starting at 150 μM sulfate, but this activity reached only one-third to one-quarter of that measured in the presence of HEPES (Fig. 3A), with cells exhibiting strong bleaching at the lower sulfate concentrations (Fig. 3B). Two main conclusions can be drawn from these data. First, F. diplosiphon finely tunes cpc3 expression to relatively minor changes in the availability of sulfate in its environment in a range of concentrations that are often encountered in some freshwater environments (28, 51). Second, the threshold level of the induction of cpc3 expression (150 μM) is unaffected by the presence of HEPES as an alternative sulfur source, even though the presence of HEPES does prevent the cells from initiating a bleaching response. This allows a strong sulfur-sparing response under conditions where sulfate is very low or absent. All of the subsequent experiments presented here were conducted in BG-11 media containing HEPES in order to avoid the confounding effects of the bleaching response.
FIG. 3.

Effect of different external sulfate concentrations and buffers on cpc3 expression and the phenotype of F. diplosiphon. (A) Assays conducted using BG-11 media containing HEPES (open triangles, solid line) or diglycine (open circles, dashed line). The level of cpc3 expression was assayed using GUS reporter gene analyses, with the activity quantified in nanomoles of product per minute per milligram of total protein. Error bars represent standard errors of the mean value of three independent biological replicates grown at the same sulfate concentration. (B) Photographs of cells in culture tubes grown in BG-11 medium buffered with either HEPES or diglycine at various sulfate concentrations. Photographs were taken 5 days after the start of each experiment.
The increase in cpc3 expression is a sulfate-specific response.
The initial report on this sulfur-mediated PBS remodeling response did not establish whether it was specific to sulfur or a general nutrient deprivation response (41). Therefore, the specificity of this response was determined by examining cpc3 expression patterns in cells grown in media lacking sulfate, phosphate, or combined nitrogen during RL growth. cpc3 transcripts (the bands correspond to the genes as follows: 1.7 kb, cpcB3A3 RNA; 3.0 kb, cpcB3A3H3 RNA; 4.5 kb, cpcB3A3H3I3D3 RNA) accumulated in sulfate-deprived cells, reaching a nearly steady-state level by 24 h after sulfate removal, but were not detected in cells transferred to media lacking phosphate or combined nitrogen at 12 or 24 h (Fig. 4A and B). Thus, the activation of cpc3 expression is specific for sulfate deprivation and is not part of a general nutrient limitation response.
FIG. 4.
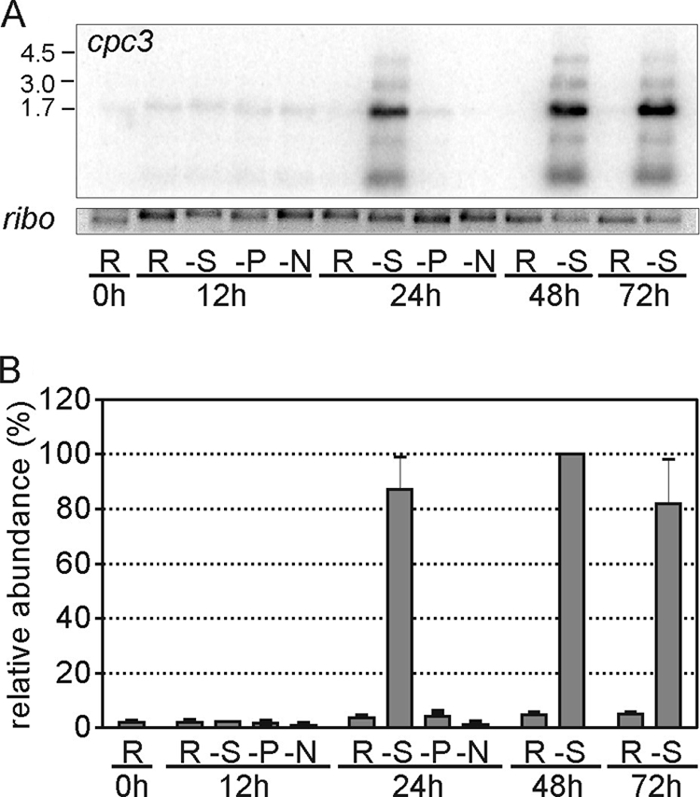
Analysis of cpc3 RNA accumulation during nitrogen, phosphorus, and sulfur deprivation. (A) Representative autoradiograph of an RNA accumulation blot for cpc3 in cells grown in replete (R), no-sulfate (−S), no-phosphorus (−P), and no-nitrogen (−N) media. RNA was harvested from cells grown for 12, 24, and 72 h after the shift into the medium indicated. Results for the rRNA control are shown (ribo). Transcript sizes (in kb) are shown on the left and correspond to the various transcript sizes from the cpc3 operon. (B) Mean transcript levels for cpc3 under different nutrient limitation conditions, normalized using rRNA values and expressed as a percentage of the value obtained for the RNA extracted from the no-sulfate sample at 48 h. Error bars are the standard errors of the mean of at least three independent biological replicates.
Genes required for the production of PBS are coregulated by sulfate and CCA.
To examine how PBS biosynthesis genes are regulated by the combined effects of sulfate availability and light color in F. diplosiphon, the expression patterns of the cpc1, cpc2, pcyA, and cpeBA operons were characterized during growth under high- and low-sulfate conditions and in RL and GL. For cpc1, transcripts were reduced approximately 10-fold after a shift from sulfate-replete to low-sulfate media, regardless of whether the cells were grown in RL or GL (Fig. 5). Similarly, cpc2 transcripts, although highly abundant in RL and undetectable in GL during growth in sulfate-replete media, were undetectable in both RL- and GL-grown cells from sulfate-limited BG-11 medium (Fig. 5). These results suggested that either the response to low sulfate overrides CCA or that CCA is shut down during growth in low sulfate. We differentiated between these possibilities by analyzing CCA-controlled changes in RNA abundance for the RL-activated pcyA gene and the GL-activated cpeBA operon (6, 22) during growth in sulfate-replete and sulfate-limited conditions. CCA still functioned during growth under sulfate-limited conditions, although the extent of CCA-mediated activation for all of these genes was only half of that measured for cells grown in sulfate-replete media (Fig. 5). Therefore, during sulfate deprivation, F. diplosiphon reduces cpc1 and cpc2 RNA levels through a mechanism that is independent of the CCA regulatory system. Low sulfate levels may also directly dampen the pcyA and cpeBA CCA response, although these decreases could also be the result of more general changes in the physiology of the cells.
FIG. 5.
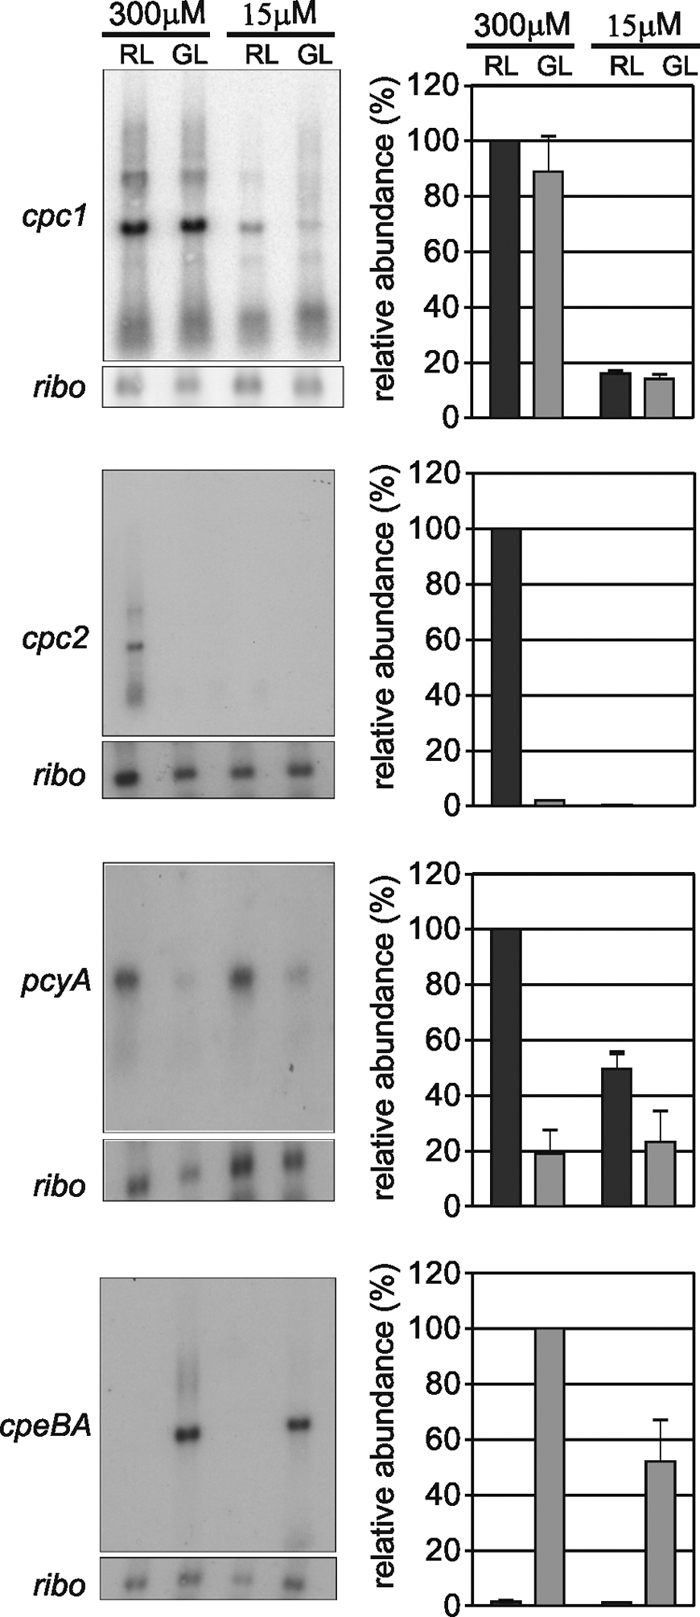
Analysis of cpc1, cpc2, pcyA, and cpeBA RNA accumulation during growth in sulfate-replete and sulfate-limited media in RL and GL. Representative autoradiographs of RNA accumulation blots are on the left. The histograms to the right of each blot represent the mean level for each transcript based on three independent experiments, normalized using ribosomal (ribo) values, and expressed as percentages of RL (GL for cpeBA), sulfate-replete levels, which were set to 100%. Error bars represent standard errors of the mean.
Low-sulfate conditions alter cell coloration due to PBS composition changes.
Some of the changes in RNA levels for PBS genes under sulfate-limited growth were reflected in the color phenotypes of cells during growth in RL and GL, which were very different from the bleaching phenotype obtained when HEPES was not provided as an alternative sulfur source (Fig. 1A and 3B). F. diplosiphon cells grown in nutrient-replete media are blue-green in RL (Fig. 6A [solid line] and C) and brick red in GL (Fig. 6B [solid line] and C) (33). When grown under sulfate limitation, cells grown in RL appeared similar to cells grown in nutrient-replete media, while cells grown in GL were a very different color than those grown in sulfate-replete BG-11 medium. However, in RL there was a small but consistent change in cell phenotype caused by low sulfate levels. The normal PC1/PC2 absorbance peak at 625 nm was shifted to 621 nm in cells that contained PC3 (Fig. 6A, dashed line). This 4-nm blue shift correlates with the presence of high levels of cpc3 transcripts and low levels of cpc1 and cpc2 transcripts. Also, the PC absorption maximum for cultures grown in low sulfate were found to continue to become further blue shifted as the cultures aged, reaching 617 nm in cells grown to stationary phase (A. Gutu and D. Kehoe, unpublished data). In GL, the differences in absorption profiles and color phenotypes were more dramatic. Cells grown in low sulfate were dark green rather than brick red (Fig. 6B, dashed line, and C). This was due to the significant accumulation of both PC3 and PE in these cells since, unlike cpc2, cpc3 was expressed in both RL and GL (Fig. 2A). As was observed for RL-grown cells, the PC peak for sulfate-deprived cells grown in GL was also blue shifted by 4 nm (Fig. 6B).
FIG. 6.

Physiological characteristics of F. diplosiphon cells grown in various sulfate concentrations. Whole-cell absorption spectra of cells grown in sulfate-replete (solid line) or sulfate-limited (dashed line) media in RL (A) and GL (B). The vertical lines between 600 and 650 nm correspond to the maximum PC absorption peaks (621 nm for growth in 15 μM sulfate and 625 nm for 300 μM sulfate). (C) Pigmentation phenotypes of wild-type cultures grown in RL and GL in sulfate-replete and sulfate-limited media. (D) Relationship of various sulfate concentrations to the ratio of PC1/PC2 to PC3, assayed as A625/A621 ratios multiplied by 100, with PC1/PC2 absorbing maximally at 625 nm and PC3 absorbing maximally at 621 nm. An A625/A621 ratio (×100) of 100.2 corresponds to PC1/PC2-containing PBS, and a ratio (×100) of 99.5 corresponds to PC3-containing PBS. Error bars represent standard errors of the mean value of three independent biological replicates grown at the same sulfate concentration.
The changes in PC1, PC2, and PC3 levels were examined throughout a range of sulfate concentrations to determine how this response varies with the sulfate level in the media. This was achieved by using the A625/A621 ratio to reflect the cellular PC1/2-to-PC3 ratio. The PBS of cells grown in 300 μM sulfate contained PC1 and PC2 and had an A625/A621 ratio of 1.002, while PBS of cells grown in 0 μM sulfate contained PC3 and had an A625/A621 ratio of 0.994 (see Fig. 6D). The shift between PC1/PC2 and PC3 occurred gradually from 160 μM to 0 μM sulfate, mirroring the previously measured changes in cpc3 expression over the same range of sulfate concentrations in the presence of HEPES (Fig. 3A).
We examined whether PC1, PC2, and PC3 abundance changes in the PBS were responsible for the changes in absorbance measured at 625 and 621 nm for cultures grown in RL under sulfate-replete versus sulfate-limited conditions (Fig. 6). PBS proteins purified from cells grown under these conditions were analyzed using HPLC and MALDI-MS. The PBS from cells grown under the two conditions gave different HPLC elution profiles (Fig. 7). Each elution peak fraction was collected and subjected to trypsin digestion, followed by MALDI-MS. Most peak fractions contained a single protein species, although several subunits coeluted, as shown in Fig. 7. PBS from cells grown in sulfate-replete media contained the α and β subunits of PC1 and PC2, while PC3 was undetectable (Fig. 7). In PBS isolated from cells grown under sulfate-limited conditions, the α and β subunits of PC3 were present (PC3α eluted at two different times) while no PC1 or PC2 was detected. Thus, the shift from 625 to 621 nm appears to result from a shift from PC1/PC2-containing PBS in sulfate-replete media to PC3-containing PBS in sulfate-limited media.
FIG. 7.
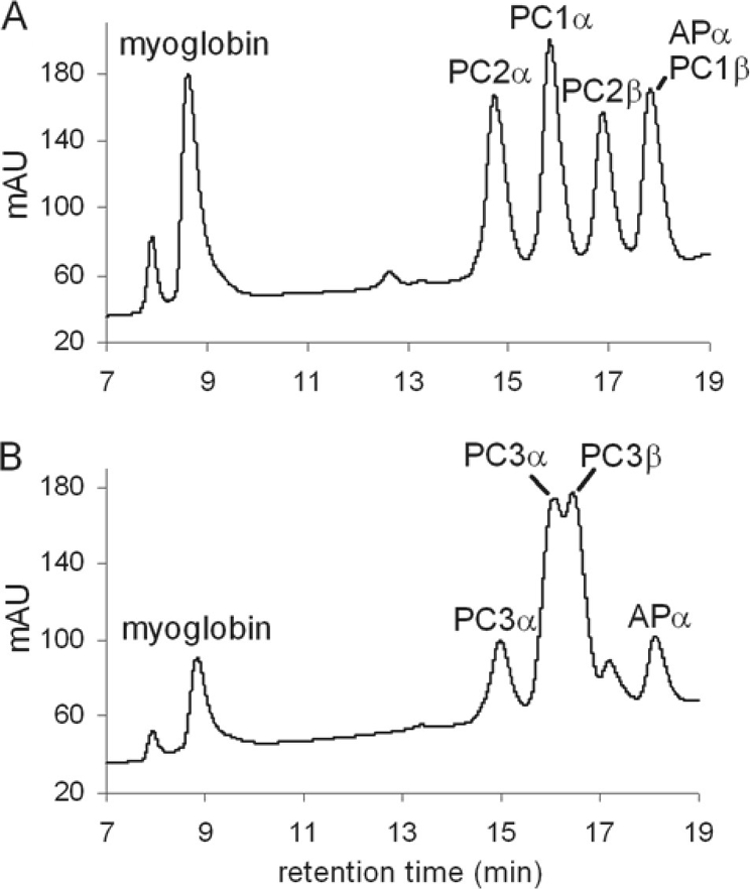
Analysis of the composition of PBS from F. diplosiphon cells grown in two sulfate concentrations. HPLC elution profiles of PBS proteins isolated from RL-grown cells in sulfate-replete (A) and no-sulfate (B) media. The identity of the protein(s) within each peak was determined by MALDI-MS analysis of the isolated fraction. The peaks at 8 and 9 min both correspond to myoglobin, which was added as a control. mAU, milliabsorbance at 216 nm. This analysis was conducted three times with independent biological replicates, and the elution patterns and times for each peak were highly reproducible.
Cyanobacterial PBS potentially function as effective sulfur storage structures.
The F. diplosiphon PBS remodeling response is sulfate specific and replaces relatively sulfur-rich PC1 and PC2 with relatively sulfur-poor PC3. Thus, it is possible that this response, and PC degradation during the bleaching response to sulfur deprivation (14), allows some species to use PBS for sulfur storage, as proposed for nitrogen (61-63). This might benefit freshwater species, whose environments may have sulfate concentrations below 100 μM, more than species in marine environments, with typical sulfate levels of 2.7 mM (51). However, cyanobacterial PBS have been suggested to be a poor source of sulfur-containing amino acids, based on the low sulfur contents that were calculated for the α and β subunits of PC in Synechococcus sp. PCC 6301 (8, 14, 26, 52, 66).
We used 24 sequenced cyanobacterial genomes to further examine this possibility. The atomic composition of an organism's predicted proteome often reflects the abundance of each element in the natural environment of that organism, except for proteins that are required for the acquisition or use of that element (1, 4, 7, 10, 19, 43, 44). Thus, analyzing the sulfur and nitrogen contents of predicted PBS from cyanobacterial species would provide information about their natural habitat, not their potential for sulfur and nitrogen storage. We instead analyzed the predicted PBS to proteome elemental composition ratios for sulfur and nitrogen, measured as the percentage of sulfur atoms per amino acid (%S/aa) and the percentage of nitrogen atoms per amino acid (%N/aa). We hypothesized that PBS containing a higher content of sulfur or nitrogen than that found in the corresponding proteome would have greater potential to be storage structures for these elements than if their content was less than in that proteome.
The sulfur content within a PBS was higher than that of the predicted proteome to which it belonged in over 80% of the species examined (Fig. 8A). This demonstrates that for most cyanobacterial species whose genomes have been sequenced, PBS have the potential to serve as effective sulfur storage structures. Thus, NblA-dependent degradation of PBS during nutrient deprivation may release significant amounts of sulfur-containing amino acids in many cyanobacteria. In contrast, PBS nitrogen contents were found to be equivalent to or somewhat lower than their corresponding predicted proteomes, even when chromophore nitrogen contributions were taken into account (Fig. 8B). Thus, using the criterion of %N/aa, PBS do not appear to be highly efficient nitrogen storage structures in most cyanobacteria. The numerical data for individual species and proteins analyzed for Fig. 8 are provided in Tables S1 and S2 in the supplemental material.
FIG. 8.
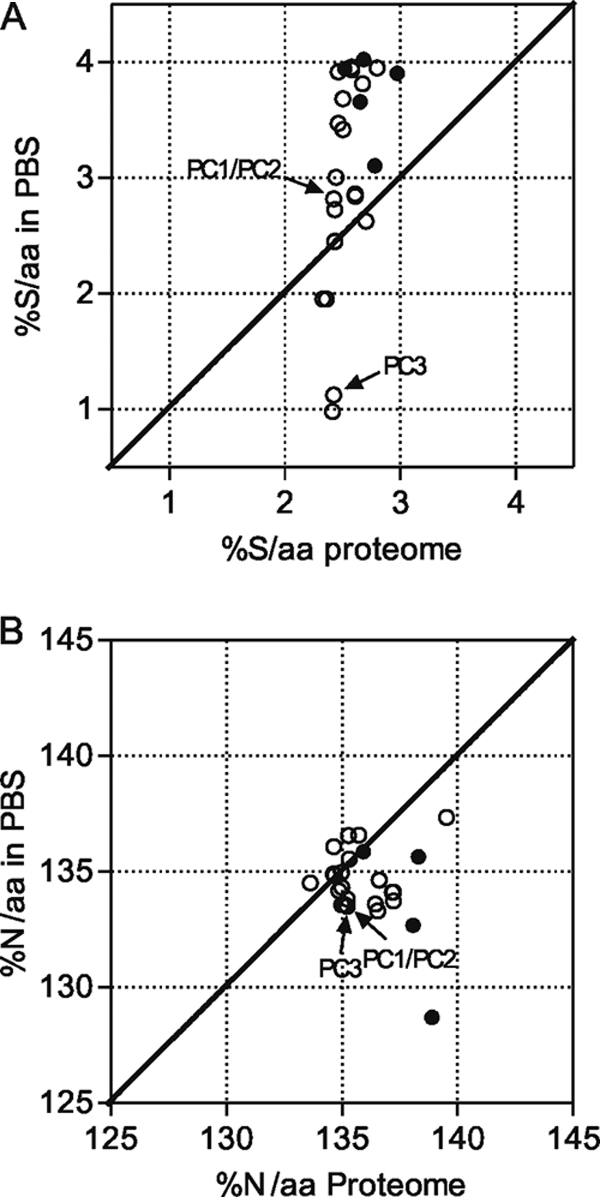
Comparison of sulfate and nitrogen contents of PBS proteins and the predicted proteomes for 24 cyanobacterial species. Scatter plots of mean %S/aa (A) or %N/aa (B) of the proteomes versus the PBS of the species listed in Table S1 in the supplemental material are shown. Symbols: closed circles, marine cyanobacteria; open circles, freshwater cyanobacteria. The values for PC1/PC2 and PC3 of F. diplosiphon are indicated.
The cpc1 and cpc2 genes are posttranscriptionally regulated by sulfate.
The level(s) at which the expression of the cpc1 and cpc2 operons are controlled by sulfate was examined by fusing the cpc1 and cpc2 upstream and 5′ leader sequences to gusA and examining sulfate and light color regulation of GUS activity in wild-type F. diplosiphon strains harboring these constructs. The regulation of cpc1 and cpc2 expression was tested using the translational fusions cpc1 P+L and cpc2 P+L, respectively (Fig. 9B). For cpc1 P+L, GUS activity was higher in GL than RL but was not regulated by sulfate levels (Fig. 9A), unlike cpc1 RNA levels, which decreased by approximately 85% after a shift from high- to low-sulfate conditions (Fig. 5). For cpc2 P+L, GUS activity was higher in RL than in GL but was not affected by the level of sulfate (Fig. 9A), unlike cpc2 RNA levels, which decreased by nearly 100% after a shift from high- to low-sulfate conditions (Fig. 5). Therefore, the decreases in cpc1 and cpc2 RNA levels measured under low-sulfate conditions were not regulated transcriptionally and apparently are controlled at the posttranscriptional level.
FIG. 9.

Analysis of the ability of the cpc1 and cpc2 promoter/upstream and leader regions to impart sulfate responsiveness. (A) Mean values of GUS activity in cells carrying the indicated plasmids in RL and GL in sulfate-replete and sulfate-limited media. Three independent biological replicates were tested for each plasmid under each condition. Bars are the standard errors of the mean. (B) Diagrams of the constructs used in panel A. Numbers are relative to the transcription start sites (small arrows) of cpc1 and cpc2, as appropriate.
DISCUSSION
The results presented here provide significant new insights into the sulfur-driven PBS remodeling response of F. diplosiphon. They demonstrate that this response is specific for sulfate levels rather than sulfur, occurs over a physiologically important range of sulfate concentrations, is able to override the CCA response of this organism, and is controlled at the level of RNA abundance through both transcriptional and posttranscriptional mechanisms. In addition, bioinformatics analysis suggests that in most cyanobacteria, PBS have a greater potential to act as sulfur storage structures than nitrogen storage structures.
The expression of cpc3 is controlled specifically by the level of sulfate in the media and not as part of a sulfur-sensing system or a general nutrient response (Fig. 2 and 3). This separates this system from the mechanism used to trigger the bleaching response in this organism, since bleaching occurs only when all sulfur sources are absent, not just sulfate (Fig. 1 and 3). This difference, in addition to providing interesting biological diversity in sulfur-sensing mechanisms, allowed us to examine details of the PBS remodeling response independently of the bleaching response simply by removing sulfate from the media and providing sulfur to the cells using HEPES. It is not yet clear why F. diplosiphon would maintain a sulfate-sensing system for activating PBS remodeling even when sulfur was being provided by other sources. It is possible that in its natural environment, sulfur is available predominantly in the sulfate form, while sulfonic acids are much less prevalent.
However, this does not answer the question of why a sulfate-sensing system is being used for PBS remodeling when the more general sulfur-sensing system used for the bleaching response appears to provide more accurate information about the actual sulfur status of these cells. It is possible that the two systems supply the capability for several layers of sulfur responsiveness. For example, PBS remodeling might commence when sulfate, arguably the most common form of sulfur in the environment, begins to become somewhat scarce. Rather than dramatically extending growth, PBS remodeling might simply provide a slight selective advantage, through its more effective use of sulfur, only during periods of low sulfate availability. This hypothesis is supported by the fact that the growth of F. diplosiphon cells slowed dramatically by 4 days after transfer to sulfur-lacking media, only a day or two later than for Synechocystis sp. PCC 6803, which is not capable of PBS remodeling (Fig. 1B) (45, 66). Then, if sulfur availability continues to decrease to a very low level, a second-tier response involving the activation of bleaching may then shut down PBS remodeling via the downregulation of cpc3.
In addition to the differences in the two sulfur-sensing mechanisms discussed above, the regulatory systems controlling the low-sulfate-driven PBS remodeling and CCA responses in F. diplosiphon must be different. First, cpc1 and cpc2 are both downregulated during PBS remodeling, but only cpc2 is CCA regulated (Fig. 5). Second, cpc3 is sulfate responsive but not under CCA control (40, 41) (Fig. 2). Previous studies have shown that CCA regulates cpc2 at the transcriptional level via binding of the response regulator RcaC to the L box (5, 37). However, the sulfate-regulated loss of cpc1 and cpc2 RNA was shown here to occur posttranscriptionally (Fig. 9A). Thus, for cpc2, light color and sulfate availability signals are integrated by the merging of transcriptional and posttranscriptional regulatory systems.
After a shift from high- to low-sulfate media, pcyA and cpeBA RNA levels also decreased, but only by approximately 50% (Fig. 5). It is not yet clear if these reductions are controlled by the same system(s) that regulates the sulfate-dependent loss of cpc1 and cpc2 RNAs. The continued expression of pcyA is consistent with the need for continued synthesis of the PCB chromophore for PBS proteins, including PC3, even when external sulfate is scarce. Our cpeBA data differ from previous results, which showed a complete shutdown of this operon after a shift to low-sulfate conditions (41). Two possible explanations for these differences are that our laboratory strain has lost the ability to completely downregulate cpeBA under low-sulfate conditions or that the previous work, which was conducted using an undefined light source, may have had sufficient RL to have shut down cpeBA expression via the CCA pathway. If our results do reflect what is occurring in the natural environment, they complicate the hypothesis that this PBS remodeling is an elemental sparing response, since in GL, the proteins encoded by the cpeBA operon are methionine and cysteine rich (PEα is 6.0%S/aa, and PEβ is 2.4%S/aa), and production of PE in low sulfate and GL is significant (Fig. 6B). Another issue that arises from our results is whether PBS contain PC3 and PE rods that are distinct under these conditions (Fig. 10), which is highly unlikely from an energy transfer perspective, or if some or all of the rods contain both PC3 (core proximal) and PE (core distal).
FIG. 10.

Proposed models of F. diplosiphon PBS structures during initial growth in RL and GL and sulfate-replete and no-sulfate media containing HEPES as an alternative sulfur source. In RL, PC3 replaces both PC1 and PC2 when sulfate is low or absent, and the absorption spectra and RNA accumulation data indicate that in GL, the PC1 and PE found in the PBS rods during nutrient-replete growth are replaced by PC3 and PE. The specific structure(s) of these rods is not known; two possible rod configurations are shown.
PBS appear to have great potential for storing sulfur in most cyanobacteria, based on the relative contents of this element in the PBS and proteomes of the species examined here (Fig. 8; see also Tables S1 and S2 in the supplemental material). Although this analysis does not account for variation in expression levels of individual proteins in each proteome, these results do challenge the proposal that PBS function as storage structures for nitrogen (61-63) but not for sulfur (8, 14, 26, 52, 66). In addition, they are consistent with the fact that sulfur- as well as nitrogen-mediated bleaching responses usually involve PBS degradation (14). Table S2 in the supplemental material provides more data to suggest that PBS may be sulfur storage structures, since for every species containing PC2, the %S/aa is as high or higher in PC2 proteins than in PC1 proteins or in the proteome. When higher, this difference is significant: PC2 contains 4.3 to 4.7 times more sulfur per amino acid than PC1. This matches the physiology of bleaching, since PC2-containing rod sections are broken down during the initial phase (14), which would release more sulfur than in the later phase of bleaching that occurs under more severe sulfur limitation, when PC1-containing rods are broken down. The use of both PC2 and PC1 under sulfur-replete conditions and only PC1 under low-sulfur conditions could be the physiological equivalent of the differential use of PC1, PC2, and PC3 during the F. diplosiphon sulfur-sparing response.
Cyanobacteria are likely to have a range of different sulfur use strategies, with some using PBS for sulfur and/or nitrogen storage and others only partially or not at all. For example, Synechococcus sp. PCC 7942 bleaches strongly, but the %S/aa value for its PBS is lower than that for its proteome. Some species, such as many marine cyanobacteria, have PC2s with high sulfur content but may not use their PBS for sulfur storage since it is not limiting in their environment. Overall, the possible role of cyanobacterial PBS in both sulfur and nitrogen storage needs to be tested experimentally, including the F. diplosiphon PBS remodeling response described here.
Several cyanobacterial species in addition to F. diplosiphon (41) (Fig. 5) show decreased cpcBA RNA levels in response to sulfur limitation. Synechocystis sp. PCC 6803 microarray analysis revealed that cpcBA RNA was most reduced 48 h after sulfur removal (66). Synechococcus sp. PCC 7942 cpcBA RNA levels also decrease rapidly within several hours after the removal of sulfur, and like the sulfate-dependent decreases in cpc1 and cpc2 RNA in F. diplosiphon (Fig. 9A), this may be controlled posttranscriptionally (14). For Synechococcus sp. PCC 7942, the sulfur-driven decline in cpcBA RNA is clearly not regulated by NblC, a regulator of the bleaching response (56). Beyond this, nothing has been reported about the components that make up the regulatory system(s) controlling the sulfur-dependent reduction in cpcBA RNA for any cyanobacterial species. Further study of the regulatory systems controlling both the sulfate-mediated PBS remodeling and the sulfur-mediated bleaching responses in F. diplosiphon will provide a better understanding of both responses and how their coordination is achieved.
Supplementary Material
Acknowledgments
This research was entirely supported by the Indiana METACyt Initiative of Indiana University, funded in part through a major grant from the Lilly Endowment, Inc.
We thank Charles Clark for his help in conducting the growth rate experiments, Animesh Shukla for assistance with the bioinformatics analysis, Jon Karty for help with the HPLC and mass spectrometric analyses, and all of the members of the Kehoe laboratory for helpful discussions and thoughtful comments.
Footnotes
Published ahead of print on 14 January 2011.
Supplemental material for this article may be found at http://jb.asm.org/.
REFERENCES
- 1.Acquisti, C., J. Kleffe, and S. Collins. 2007. Oxygen content of transmembrane proteins over macroevolutionary time scales. Nature 445:47-52. [DOI] [PubMed] [Google Scholar]
- 2.Allen, M. M., and A. J. Smith. 1969. Nitrogen chlorosis in blue-green algae. Arch. Microbiol. 69:114-120. [DOI] [PubMed] [Google Scholar]
- 3.Altschul, S. F., W. Gish, W. Miller, E. W. Myers, and D. J. Lipman. 1990. Basic local alignment search tool. J. Mol. Biol. 215:403-410. [DOI] [PubMed] [Google Scholar]
- 4.Alves, R., and M. A. Savageau. 2005. Evidence of selection for low cognate amino acid bias in amino acid biosynthetic enzymes. Mol. Microbiol. 56:1017-1034. [DOI] [PMC free article] [PubMed] [Google Scholar]
- 5.Alvey, R. M., R. P. Bezy, N. Frankenberg-Dinkel, and D. M. Kehoe. 2007. A light regulated OmpR-class promoter element coordinates light harvesting protein and chromophore biosynthetic enzyme gene expression. Mol. Microbiol. 64:319-332. [DOI] [PubMed] [Google Scholar]
- 6.Alvey, R. M., J. A. Karty, E. Roos, J. P. Reilly, and D. M. Kehoe. 2003. Lesions in phycoerythrin chromophore biosynthesis in Fremyella diplosiphon reveal coordinated light regulation of apoprotein and pigment biosynthetic enzyme gene expression. Plant Cell 15:2448-2463. [DOI] [PMC free article] [PubMed] [Google Scholar]
- 7.Baudouin-Cornu, P., Y. Surdin-Kerjan, P. Marliere, and D. Thomas. 2001. Molecular evolution of protein atomic composition. Science 293:297-300. [DOI] [PubMed] [Google Scholar]
- 8.Bhaya, D., R. Schwarz, and A. R. Grossman. 2000. Molecular responses to environmental stress, p. 397-442. In M. Potts and B. Whitton (ed.), Ecology of cyanobacteria: diversity in time and space. Kluwer Publishers, Dordrecht, Netherlands.
- 9.Bienert, R., K. Baier, R. Volkmer, W. Lockau, and U. Heinemann. 2006. Crystal structure of NblA from Anabaena sp. PCC 7120, a small protein playing a key role in phycobilisome degradation. J. Biol. Chem. 281:5216-5223. [DOI] [PubMed] [Google Scholar]
- 10.Bragg, J. G., D. Thomas, and P. Baudouin-Cornu. 2006. Variation among species in proteomic sulphur content is related to environmental conditions. Proc. Biol. Sci. 273:1293-1300. [DOI] [PMC free article] [PubMed] [Google Scholar]
- 11.Casey, E. S., and A. Grossman. 1994. In vivo and in vitro characterization of the light-regulated cpcB2A2 promoter of Fremyella diplosiphon. J. Bacteriol. 176:6362-6374. [DOI] [PMC free article] [PubMed] [Google Scholar]
- 12.Chiang, G. G., M. R. Schaefer, and A. R. Grossman. 1992. Transformation of the filamentous cyanobacterium Fremyella diplosiphon by conjugation or electroporation. Plant Physiol. Biochem. 30:315-325. [Google Scholar]
- 13.Cohen-Bazire, G., and D. A. Bryant. 1982. Phycobilisomes: composition and structure, p. 143-190. In N. G. Carr and B. A. Whitton (ed.), The biology of cyanobacteria. Blackwell Scientific Publications, Oxford, United Kingdom.
- 14.Collier, J. L., and A. R. Grossman. 1992. Chlorosis induced by nutrient deprivation in Synechococcus sp. strain PCC 7942: not all bleaching is the same. J. Bacteriol. 174:4718-4726. [DOI] [PMC free article] [PubMed] [Google Scholar]
- 15.Collier, J. L., and A. R. Grossman. 1994. A small polypeptide triggers complete degradation of light-harvesting phycobiliproteins in nutrient-deprived cyanobacteria. EMBO J. 13:1039-1047. [DOI] [PMC free article] [PubMed] [Google Scholar]
- 16.Conley, P. B., P. G. Lemaux, and A. R. Grossman. 1985. Cyanobacterial light-harvesting complex subunits encoded in two red light-induced transcripts. Science 230:550-553. [DOI] [PubMed] [Google Scholar]
- 17.Dines, M., E. Sendersky, L. David, R. Schwarz, and N. Adir. 2008. Structural, functional, and mutational analysis of the NblA protein provides insight into possible modes of interaction with the phycobilisome. J. Biol. Chem. 283:30330-30340. [DOI] [PMC free article] [PubMed] [Google Scholar]
- 18.Dolganov, N., and A. R. Grossman. 1999. A polypeptide with similarity to phycocyanin alpha-subunit phycocyanobilin lyase involved in degradation of phycobilisomes. J. Bacteriol. 181:610-617. [DOI] [PMC free article] [PubMed] [Google Scholar]
- 19.Elser, J. J., W. F. Fagan, S. Subramanian, and S. Kumar. 2006. Signatures of ecological resource availability in the animal and plant proteomes. Mol. Biol. Evol. 23:1946-1951. [DOI] [PubMed] [Google Scholar]
- 20.Espinosa, J., I. Fuentes, S. Burillo, F. Rodriguez-Mateos, and A. Contreras. 2006. SipA, a novel type of protein from Synechococcus sp. PCC 7942, binds to the kinase domain of NblS. FEMS Microbiol. Lett. 254:41-47. [DOI] [PubMed] [Google Scholar]
- 21.Fauchon, M., et al. 2002. Sulfur sparing in the yeast proteome in response to sulfur demand. Mol. Cell 9:713-723. [DOI] [PubMed] [Google Scholar]
- 22.Federspiel, N. A., and A. R. Grossman. 1990. Characterization of the light-regulated operon encoding the phycoerythrin-associated linker proteins from the cyanobacterium Fremyella diplosiphon. J. Bacteriol. 172:4072-4081. [DOI] [PMC free article] [PubMed] [Google Scholar]
- 23.Giordano, M., A. Norici, and R. Hell. 2005. Sulfur and phytoplankton: acquisition, metabolism and impact on the environment. New Phytol. 166:371-382. [DOI] [PubMed] [Google Scholar]
- 24.Golden, J. W., and H. S. Yoon. 2003. Heterocyst development in Anabaena. Curr. Opin. Microbiol. 6:557-563. [DOI] [PubMed] [Google Scholar]
- 25.Grossman, A. R. 2003. A molecular understanding of complementary chromatic adaptation. Photosynth. Res. 76:207-215. [DOI] [PubMed] [Google Scholar]
- 26.Grossman, A. R., M. Schaefer, G. Chiang, and J. Collier. 1994. The responses of cyanobacteria to environmental conditions: light and nutrients, p. 641-675. In D. Bryant (ed.), The molecular biology of cyanobacteria. Kluwer Academic Publishers, Dordrecht, Netherlands.
- 27.Grossman, A. R., M. R. Schaefer, G. G. Chiang, and J. L. Collier. 1993. The phycobilisome, a light-harvesting complex responsive to environmental conditions. Microbiol. Rev. 57:725-749. [DOI] [PMC free article] [PubMed] [Google Scholar]
- 28.Holmer, M., and P. Storkholm. 2001. Sulphate reduction and sulphur cycling in lake sediments: a review. Freshwater Biol. 46:431-451. [Google Scholar]
- 29.Jefferson, R. A., S. M. Burgess, and D. Hirsh. 1986. Beta-glucuronidase from Escherichia coli as a gene-fusion marker. Proc. Natl. Acad. Sci. U. S. A. 83:8447-8451. [DOI] [PMC free article] [PubMed] [Google Scholar]
- 30.Kappell, A. D., D. Bhaya, and L. G. van Waasbergen. 2006. Negative control of the high light-inducible hliA gene and implications for the activities of the NblS sensor kinase in the cyanobacterium Synechococcus elongatus strain PCC 7942. Arch. Microbiol. 186:403-413. [DOI] [PubMed] [Google Scholar]
- 31.Karradt, A., J. Sobanski, J. Mattow, W. Lockau, and K. Baier. 2008. NblA, a key protein of phycobilisome degradation, interacts with ClpC, a HSP100 chaperone partner of a cyanobacterial Clp protease. J. Biol. Chem. 283:32394-32403. [DOI] [PubMed] [Google Scholar]
- 32.Kato, H., T. Chibazakura, and H. Yoshikawa. 2008. NblR is a novel one-component response regulator in the cyanobacterium Synechococcus elongatus PCC 7942. Biosci. Biotechnol. Biochem. 72:1072-1079. [DOI] [PubMed] [Google Scholar]
- 33.Kehoe, D. M., and A. Gutu. 2006. Responding to color: the regulation of complementary chromatic adaptation. Annu. Rev. Plant Biol. 57:127-150. [DOI] [PubMed] [Google Scholar]
- 34.Lahmi, R., et al. 2006. Alanine dehydrogenase activity is required for adequate progression of phycobilisome degradation during nitrogen starvation in Synechococcus elongatus PCC 7942. J. Bacteriol. 188:5258-5265. [DOI] [PMC free article] [PubMed] [Google Scholar]
- 35.Lau, R. J., M. M. MacKenzie, and W. F. Doolittle. 1977. Phycocyanin synthesis and degradation in the blue-green bacterium Anacystis nidulans. J. Bacteriol. 132:771-778. [DOI] [PMC free article] [PubMed] [Google Scholar]
- 36.Leganes, F., K. Forchhammer, and F. Fernandez-Pinas. 2009. Role of calcium in acclimation of the cyanobacterium Synechococcus elongatus PCC 7942 to nitrogen starvation. Microbiology 155:25-34. [DOI] [PubMed] [Google Scholar]
- 37.Li, L., R. M. Alvey, R. P. Bezy, and D. M. Kehoe. 2008. Inverse transcriptional activities during complementary chromatic adaptation are controlled by binding of the response regulator RcaC to red and green light responsive promoters. Mol. Microbiol. 68:286-297. [DOI] [PubMed] [Google Scholar]
- 38.Marquardt, J., H. Senger, H. Miyashita, S. Miyachi, and E. Morschel. 1997. Isolation and characterization of biliprotein aggregates from Acaryochloris marina, a Prochloron-like prokaryote containing mainly chlorophyll d. FEBS Lett. 410:428-432. [DOI] [PubMed] [Google Scholar]
- 39.Mazel, D., et al. 1986. Green light induces transcription of the phycoerythrin operon in the cyanobacterium Calothrix 7601. Nucleic Acids Res. 14:8279-8290. [DOI] [PMC free article] [PubMed] [Google Scholar]
- 40.Mazel, D., J. Houmard, and N. Tandeau de Marsac. 1988. A multigene family in Calothrix sp. PCC 7601 encodes phycocyanin, the major component of the cyanobacterial light-harvesting antenna. Mol. Gen. Genet. 211:296-304. [DOI] [PubMed] [Google Scholar]
- 41.Mazel, D., and P. Marliere. 1989. Adaptive eradication of methionine and cysteine from cyanobacterial light-harvesting proteins. Nature 341:245-248. [DOI] [PubMed] [Google Scholar]
- 42.Perkins, D. N., D. J. C. Pappin, D. M. Creasy, and J. S. Cottrell. 1999. Probability-based protein identification by searching sequence databases using mass spectrometry data. Electrophoresis 20:3551-3567. [DOI] [PubMed] [Google Scholar]
- 43.Perlstein, E. O., B. L. De Bivort, S. Kunes, and S. L. Schreiber. 2007. Evolutionarily conserved optimization of amino acid biosynthesis. J. Mol. Evol. 65:186-196. [DOI] [PubMed] [Google Scholar]
- 44.Raven, J. A., M. Andrews, and A. Quigg. 2005. The evolution of oligotrophy: implications for the breeding of crop plants for low input agricultural systems. Ann. Appl. Biol. 146:261-280. [Google Scholar]
- 45.Richaud, C., G. Zabulon, A. Joder, and J. C. Thomas. 2001. Nitrogen or sulfur starvation differentially affects phycobilisome degradation and expression of the nblA gene in Synechocystis strain PCC 6803. J. Bacteriol. 183:2989-2994. [DOI] [PMC free article] [PubMed] [Google Scholar]
- 46.Rippka, R., J. Deruelles, J. B. Waterbury, M. Herdman, and R. Y. Stanier. 1979. Generic assignments, strain histories, and properties of pure cultures of cyanobacteria. J. Gen. Microbiol. 111:1-61. [Google Scholar]
- 47.Ruiz, D., et al. 2008. Phosphorylation-independent activation of the atypical response regulator NblR. Microbiology 154:3002-3015. [DOI] [PubMed] [Google Scholar]
- 48.Salinas, P., et al. 2007. The regulatory factor SipA provides a link between NblS and NblR signal transduction pathways in the cyanobacterium Synechococcus sp. PCC 7942. Mol. Microbiol. 66:1607-1619. [DOI] [PubMed] [Google Scholar]
- 49.Sato, H., T. Fujimori, and K. Sonoike. 2008. sll1961 is a novel regulator of phycobilisome degradation during nitrogen starvation in the cyanobacterium Synechocystis sp. PCC 6803. FEBS Lett. 582:1093-1096. [DOI] [PubMed] [Google Scholar]
- 50.Schlichting, C. D., and M. Pigliucci. 1993. Control of phenotypic plasticity via regulatory genes. Am. Nat. 142:366-370. [DOI] [PubMed] [Google Scholar]
- 51.Schmidt, A. 1988. Sulfur metabolism in cyanobacteria. Methods Enzymol. 167:572-583. [Google Scholar]
- 52.Schmidt, A., I. Erdle, and H.-P. Kost. 1982. Changes of c-phycocyanin in Synechococcus 6301 in relation to growth on various sulfur compounds. Z. Naturforsch. 37c:870-876. [Google Scholar]
- 53.Schwarz, R., and K. Forchhammer. 2005. Acclimation of unicellular cyanobacteria to macronutrient deficiency: emergence of a complex network of cellular responses. Microbiology 151:2503-2514. [DOI] [PubMed] [Google Scholar]
- 54.Schwarz, R., and A. R. Grossman. 1998. A response regulator of cyanobacteria integrates diverse environmental signals and is critical for survival under extreme conditions. Proc. Natl. Acad. Sci. U. S. A. 95:11008-11013. [DOI] [PMC free article] [PubMed] [Google Scholar]
- 55.Seib, L. O., and D. M. Kehoe. 2002. A turquoise mutant genetically separates expression of genes encoding phycoerythrin and its associated linker peptides. J. Bacteriol. 184:962-970. [DOI] [PMC free article] [PubMed] [Google Scholar]
- 56.Sendersky, E., R. Lahmi, J. Shaltiel, A. Perelman, and R. Schwarz. 2005. NblC, a novel component required for pigment degradation during starvation in Synechococcus PCC 7942. Mol. Microbiol. 58:659-668. [DOI] [PubMed] [Google Scholar]
- 57.Tandeau de Marsac, N., D. Mazel, V. Capuano, T. Damerval, and J. Houmard. 1990. Genetic analysis of the cyanobacterial light-harvesting antenna complex, p. 143-153. In G. Drews and E. A. Dawes (ed.), The molecular biology of membrane-bound complexes in phototrophic bacteria. Plenum Press, New York, NY.
- 58.Tandeau de Marsac, N., et al. 1988. Photoregulation of gene expression in the filamentous cyanobacterium Calothrix sp. PCC 7601: light-harvesting complexes and cell differentiation. Photosynth. Res. 18:99-132. [DOI] [PubMed] [Google Scholar]
- 59.van Waasbergen, L. G., N. Dolganov, and A. R. Grossman. 2002. nblS, a gene involved in controlling photosynthesis-related gene expression during high light and nutrient stress in Synechococcus elongatus PCC 7942. J. Bacteriol. 184:2481-2490. [DOI] [PMC free article] [PubMed] [Google Scholar]
- 60.Wu, X. Q., D. W. Lee, R. A. Mella, and J. W. Golden. 2007. The Anabaena sp. strain PCC 7120 asr1734 gene encodes a negative regulator of heterocyst development. Mol. Microbiol. 64:782-794. [DOI] [PubMed] [Google Scholar]
- 61.Wyman, M., R. P. F. Gregory, and N. G. Carr. 1985. Novel role for phycoerythrin in a marine cyanobacterium, Synechococcus strain DC2. Science 230:818-820. [DOI] [PubMed] [Google Scholar]
- 62.Yamanaka, G., and A. N. Glazer. 1980. Dynamic aspects of phycobilisome structure. Phycobilisome turnover during nitrogen starvation in Synechococcus sp. Arch. Microbiol. 124:39-47. [Google Scholar]
- 63.Yeh, S. W., L. J. Ong, and A. N. Glazer. 1986. Role of phycoerythrin in marine picoplankton Synechococcus spp. Science 234:1422-1423. [DOI] [PubMed] [Google Scholar]
- 64.Zabulon, G., C. Richaud, C. Guidi-Rontani, and J. C. Thomas. 2007. NblA gene expression in Synechocystis PCC 6803 strains lacking DspA (Hik33) and a NblR-like protein. Curr. Microbiol. 54:36-41. [DOI] [PubMed] [Google Scholar]
- 65.Zhang, C. C., S. Laurent, S. Sakr, L. Peng, and S. Bedu. 2006. Heterocyst differentiation and pattern formation in cyanobacteria: a chorus of signals. Mol. Microbiol. 59:367-375. [DOI] [PubMed] [Google Scholar]
- 66.Zhang, Z., N. D. Pendse, K. N. Phillips, J. B. Cotner, and A. Khodursky. 2008. Gene expression patterns of sulfur starvation in Synechocystis sp. PCC 6803. BMC Genomics 9:344. [DOI] [PMC free article] [PubMed] [Google Scholar]
Associated Data
This section collects any data citations, data availability statements, or supplementary materials included in this article.