

Abstract
Viral nervous necrosis caused by nervous necrosis virus (NNV) exacts a high mortality and results in huge economic losses in grouper aquaculture in Taiwan. The present study developed a real-time quantitative PCR (qPCR) method for NNV monitoring. The assay showed a strong linear correlation (r2 = 0.99) between threshold cycle (CT) and RNA quantities, which allowed identification of infected groupers by the CT value and could be exploited to warn of NNV infection prior to an outbreak in grouper fish farms. Real-time qPCR also confirmed the copious content of NNV in grouper fin, similar to that in primary tissues; the result was verified by using in situ reverse transcription-PCR (RT-PCR). This indicated that grouper fin was a suitable sample for NNV detection, in a manner that could be relatively benign to the fish. The rapid spread of NNV infection to the entire population of affected farms was evident. The developed real-time qPCR method is rapid, highly sensitive, and applicable to routine high-throughput detection of large numbers of samples and has potential as a suitable tool for diagnostic, epidemiological, and genetic studies of grouper aquaculture.
INTRODUCTION
More than 50 different species of grouper inhabit the tropical waters around Taiwan; some have been farmed since 1979. Key aquaculture techniques on an industrial scale have been well established. During that time, considerable economic losses have been sustained in grouper aquaculture due to the infection of grouper by piscine nodavirus belonging to the family Nodaviridae and genus Betanodavirus (2). The infection causes viral nervous necrosis (VNN) in Asia (24) and viral encephalitis and retinopathy in Europe (27) on grouper hatchery-reared larvae and juveniles, resulting in a high mortality rate (80 to 100%). This pathogen can also infect a wide range of marine fish species globally (15, 16, 24).
Most Betanodavirus viruses are neuropathogenic viruses that cause damage throughout the central nervous system, which can be characterized by the vacuolation and degeneration of neurons (14, 22). The clinical signs of VNN-infected larval-stage grouper are abnormal schooling and swimming behavior (whirling and spiraling) and loss of appetite. The Betanodavirus genome is segmented and consists of two or three segments (RNA1, RNA2, and RNA3) of linear positive-sense, single-stranded RNA (9, 14). RNA1 (3,100 bp) encodes protein A, which is the viral part of the RNA-dependent RNA polymerase. RNA2 (1,400 bp) encodes the capsid protein (12, 17). RNA3, a subgenomic transcript of RNA1, encodes protein B2 and is present only in the nucleus of a virus-infected cell but not in the viron (7, 26).
Current diagnostic detection methods for nervous necrosis virus (NNV) are based on histopathology and PCR. PCR is the most sensitive and commonly used method but suffers from a limited ability to detect low copy numbers of the viral genome in infected tissue. Detection and quantification of viral RNA by reverse transcription-PCR (RT-PCR) and real-time quantitative PCR (qPCR) have been very popular due to their high sensitivity and reliable specificity (1, 8, 13). Successful detection of viral RNA requires control of the variation of the initial amount of RNA from samples, the amount and integrity of isolated RNA, and the efficiency of the RT-PCR protocol (8).
In this study, a highly sensitive real-time qPCR method and a novel approach that allows quantification of NNV RNA2 from living groupers were developed. Visual inspection of the melting curve (23) revealed the results immediately without any further analyses. Using quantitative methods specific for viral pathogens in aquaculture allows for the collection of valuable information, contributes to the knowledge of viral epidemiology in this case, provides an early warning of NNV infection prior to disease outbreak, and can be exploited in monitoring the transportation of live and frozen grouper fish between countries. The present method may represent a valuable tool for diagnostic, epidemiological, and genetic studies in grouper aquaculture.
MATERIALS AND METHODS
Fish samples, tissues, and cells.
Twenty-four different grouper aquaculture farms in eight different areas of southern Taiwan (Fig. 1 and Table 1) were sampled. The 144 groupers that were collected were transported alive to a laboratory at National Cheng Kung University (Fig. 1). Six random asymptomatic groupers ranging in size from 0.5 to 3 in. were obtained from the individual grouper aquaculture farms. These fish were maintained in a fish tank (1 by 0.5 by 0.5 m) with constant aeration and a water temperature of 28 ± 2°C for 2 weeks. A commercial diet was fed daily to satiation. Initially, groupers from the same fish farm were maintained as a group, resulting in 24 groups.
Fig. 1.

The locations of sampling grouper aquaculture farms in southern Taiwan. Taiwan encompasses subtropical and tropical regions and is suitable for culturing groupers. Grouper samples were collected from 24 different grouper aquaculture farms in eight regions (gray circles): An-Nan (n = 2 farms), Anping (n = 2), Budai (n = 2), Cigu (n = 3), Jiading (n = 5), Kunshen (n = 5), Linbian (n = 1), and Linyuan (n = 4). The white ring indicates the location of National Cheng Kung University. (Modified from a map available at http://mapsof.net under a Creative Commons Attribution-ShareAlike 1.0 License.)
Table 1.
Summary of results of NNV detection by real-time qPCR in fin tissue from 24 different grouper aquaculture farmsa
| Farm/tank no.§ | Location | Species* | Size of fish (in.) | Test result** | Tracking test result‡ | Collection date |
|---|---|---|---|---|---|---|
| 1 | Kunshen | E. coioides | 1 | −+++−− | ++++++ | Mar. 2008 |
| 2 | Budai | E. coioides | 2 | ++++++ | ++++++ | Aug. 2008 |
| 3 | Kunshen | E. coioides | 2 | −+−+−− | ++++++ | Mar. 2008 |
| 4 | Linyuan | E. coioides | 2 | +−+−−− | +++−−− | Aug. 2008 |
| 5 | Jiading | E. lanceolatus | 0.5 | −−−−−− | −−−−−− | Mar. 2008 |
| 6 | Kunshen | E. coioides | 0.5 | +++−++ | ++++++ | Aug. 2008 |
| 7 | Cigu | E. coioides | 1.5 | −+−+−− | ++++++ | Apr. 2008 |
| 8 | An-Nan | E. lanceolatus | 3 | −−−−−− | −−−−−− | Aug. 2008 |
| 9 | Jiading | E. malabaricus | 1 | −++−−− | ++++++ | Apr. 2008 |
| 10 | Jiading | E. coioides | 2 | −+−+++ | ++++++ | Aug. 2008 |
| 11 | Jiading | E. lanceolatus | 2 | +−−−−− | ++++++ | Apr. 2008 |
| 12 | Linyuan | E. coioides | 1 | −+−+−− | ++++++ | Sept. 2008 |
| 13 | Cigu | E. malabaricus | 1 | +−−+−− | ++++++ | Jan. 2008 |
| 14 | Kunshen | E. coioides | 1 | ++−++− | ++++++ | May 2008 |
| 15 | Budai | E. lanceolatus | 1.5 | −−+−++ | ++++++ | Sept. 2008 |
| 16 | Kunshen | E. coioides | 2 | ++−−−− | ++++++ | Jan. 2008 |
| 17 | Jiading | E. lanceolatus | 1 | −−−−−− | −−−−−− | May 2008 |
| 18 | Linbian | E. coioides | 0.5 | −−+++− | ++++++ | Sept. 2008 |
| 19 | Anping | E. lanceolatus | 0.5 | −+−−−− | ++++++ | Jan. 2008 |
| 20 | Anping | E. lanceolatus | 3 | +−+−−+ | ++++++ | May 2008 |
| 21 | Linyuan | E. coioides | 2 | +++−+− | ++++++ | Sept. 2008 |
| 22 | Cigu | E. coioides | 0.5 | −+−+−+ | ++++++ | Jan. 2008 |
| 23 | Linyuan | E. coioides | 0.5 | +−+−−− | ++++++ | May 2008 |
| 24 | An-Nan | E. lanceolatus | 2.5 | −+−+−− | ++++++ | Sept. 2008 |
a*, E. coioides, orange-spotted grouper; E. lanceolatus, giant grouper; E. malabaricus, malaba grouper.
, test results of NNV detection by real-time qPCR; +, fin tissue samples had NNV signal by real-time qPCR (CT value between 12 and 24); −, fin tissue samples had no NNV signal by real-time qPCR (CT > 32); ‡, test results of NNV detection for the same sampled fish by real-time qPCR after 2 weeks; §, the fish samples collected from the same fish farm were pooled together in a fish tank and labeled the same number as the fish farm.
Samples of brain, eye, gill, fin, head kidney, heart, intestine, liver, muscle, and spleen tissues were obtained from juvenile fish that displayed clinical signs of NNV infection. The infected juvenile grouper fish were collected from three different grouper aquaculture farms in Kunshen in 2004. The experiments were repeated three times, and five diseased juvenile groupers were collected from individual fish farms for each experiment.
Grouper fin cells (GF-1, BCRC 960094) were obtained from the Bioresources Collection and Research Center (BCRC) in Taiwan. Grouper liver (GLa) cells and grouper kidney (GK) cells were kindly supplied by H. L. Yang, National Cheng Kung University, Taiwan. The cells were grown in a humidified incubator operating at 28°C in an antibiotic-free L15 medium (Life Technologies, Carlsbad, CA) supplemented with 5% (vol/vol) heat-inactivated fetal bovine serum (FBS) (3).
Virus isolation and purification.
Grouper NNV (gNNV) was isolated from naturally infected groupers (Epinephelus lanceolatus) collected in 2004 in Jiading, Taiwan (22). Virus was isolated from fin tissue. The tissues were frozen in liquid nitrogen and homogenated in 10 volumes of L15 medium, centrifuged at 10,000 rpm for 20 min, and the supernatant fraction was passed through a 0.22-μm filter and stored at −80°C until used.
For collection of virus particles, the isolated virus was cultured in GF-1 cells, and the cells were collected when 90% of the cells displayed a cytopathic effect (CPE). L15 medium containing GF-1 cells and NNV were mixed with 2.2% NaCl and 5% (wt/vol) polyethylene glycol (PEG) 8000 and centrifuged at 10,000 × g for 1 h at 4°C. The pellet was resuspended in 2 ml TES (N-tris(hydroxymethyl)methyl-2-aminoethanesulfonic acid) buffer, mixed with an equal amount of Freon 113, and shaken vigorously for 5 min. Supernatants were combined and mixed with 3 ml, 3 ml, and 2 ml of 40%, 30%, and 20% CsCl, respectively. CsCl density gradients were formed by centrifugation in a Beckman SW40Ti rotor (Beckman Coulter, Fullerton, CA) at 35,000 rpm for 16 h at 4°C. Syringes were used to collect 3 ml of the virus-containing fraction, which was diluted 10-fold using TES buffer.
Primer design for amplification of NNV coat protein fragment.
The primer pair (203-F, GACGCGCTTCAAGCAACTC, and 203-R, CGAACACTCCAGCGACACAGCA) was designed by alignment of 18 different NNV coat protein cDNA sequences (see Table S1 in the supplemental material) from the National Center for Biotechnology Information (NCBI). Two consensus sequences targeting the coat protein gene (RNA2) were chosen by using Primer Express software version 1.0 (Applied Biosystems, Foster City, CA) to amplify 203 bp for real-time qPCR.
RNA isolation, cDNA synthesis, RT-PCR, and virus copy number.
A piece of fin tissue sampled from each grouper was subjected to the following RNA extraction procedure. RNA extraction from the homogenated fin tissue and pure NNV particles was performed using TRIzol reagent (Invitrogen, Valencia, CA) according to the manufacturer's protocol. Briefly, for 100 mg tissue, 1 ml TRIzol reagent and an additional 200 μl of ice-cold chloroform were added. Isopropanol was used to precipitate RNA, and the RNA pellet was then resuspended in diethylpyrocarbonate-treated water.
Reverse transcription was performed with Moloney murine leukemia virus (MMLV) reverse transcriptase (Promega, Madison, WI) according to the manufacturer's protocol. Two micrograms of the extracted total RNA was used as template, and specific primer pairs (203-F and 203-R) were used for PCR, which involved 94°C for 5 min and 35 cycles of 94°C for 40 s, 55°C for 40 s, 72°C for 40 s, and 72°C for 5 min.
RNA samples isolated from purified virus and cDNA were quantified using an Ultrospec 3300 Pro spectrophotometer (Amersham Biosciences, Piscataway, NJ), and dilutions were made using sheared salmon sperm DNA (5 ng ml−1) as a diluent. The plasmid with the virus gene (RNA2) was used as a standard for the calculation of the viral copy number. The viral copy number was identified by the molecular weight (one virus particle = 1.5 × 10⁶ [= 4,542 bp × 330 Da]) of the virus. For 1 μg μl−1 of viral RNA, there are 6.66 × 10⁻¹³ (= 1,000 × 10−9/1.5 × 106) viral moles, which is equal to 4.0 × 10¹¹ (= 6.66 × 10−13 × 6.023 × 1023) virus copies.
Real-time qPCR.
The 203-bp PCR product from NNV coat protein cDNA (RNA2) was cloned into a pGEM-T Easy vector (Promega). Real-time qPCR was carried out using a GeneAmp 2700 thermocycler coupled with a GeneAmp 7000 sequence detection system (Applied Biosystems) in wells of a 96-well plate. Each well contained 12.5 μl of 2× SYBR green master mix (Applied Biosystems), 5 μM (each) forward and reverse primers, and 2 μl cDNA, for a final volume of 25 μl. The thermal profile for real-time qPCR was 1 cycle of 95°C for 2 min, 40 cycles of 95°C for 15 s and 60°C for 1 min, and 72°C for 20 s.
In situ RT-PCR.
Fin tissues from both healthy and infected 3-inch-long groupers were fixed overnight in freshly prepared 10% formaldehyde solution and embedded in paraffin. Four-micrometer-thick sections were cut using a Leica CM 1900 microtome (Leica Microsystems, Nussloch, Germany), mounted on a polylysin-coated slide, deparaffinized in xylene for 5 min, and dehydrated with a graded series of ethanol solutions (30, 50, 70, 85, 95, and 3 × 100%; each containing 0.85% NaCl). Tissues were then stained with hematoxylin-eosin (H&E). In situ RT-PCR was modified from a previously described regimen (21) and was done using a DIG probe synthesis kit and DIG nucleic acid detection kit (Roche Applied Science, Mannheim, Germany) according to the manufacturer's instructions. The sections were visualized using an Axiovert 40 microscope (Carl Zeiss, Gottingen, Germany), and images were captured using a SPOT RT3 camera (Spot Imaging Solutions, Sterling Heights, MI).
Evaluation of real-time qPCR data.
Real-time qPCR data were analyzed by the 7000 sequence detection system (version 1.0). In the system, the fluorescence of SYBR green against the internal passive reference dye ROX (ΔRn) is measured at the end of each cycle. A sample is considered positive when the ΔRn value exceeds the threshold value. The threshold value is set at the midpoint of the ΔRn versus the cycle number plot. For all the amplifications described in this study, the threshold value of ΔRn was set as 0.25. The threshold cycle (CT) is defined as the cycle at which a statistically significant increase in Rn is first detected. Target cDNA copy number and CT values are inversely proportional. Compared to a sample with a low copy number of the target gene, a sample which contains a high copy number of the same gene will cross the threshold at an earlier cycle. The copy number of the NNV sample is determined by normalizing the CT values of the samples and then extrapolating the normalized CT values to the standard curve of the corresponding virus (see Fig. S1 and Tables S2 and S3 in the supplemental material).
RESULTS
Specificity test of designed primer pair.
The designed primer pair (203-F and 203-R) was specific to the grouper NNV coat protein gene (Fig. 2A) and produced no PCR artifacts and primer dimers (Fig. 2A, lane N). Other grouper pathogens, such as iridovirus and Vibrio anguillarum, and grouper fish genomes (E. coioides, E. lanceolatus, and E. fuscoguttatus genomes from non-NNV-infected fish) were not amplified by the primer pair (Fig. 2A).
Fig. 2.
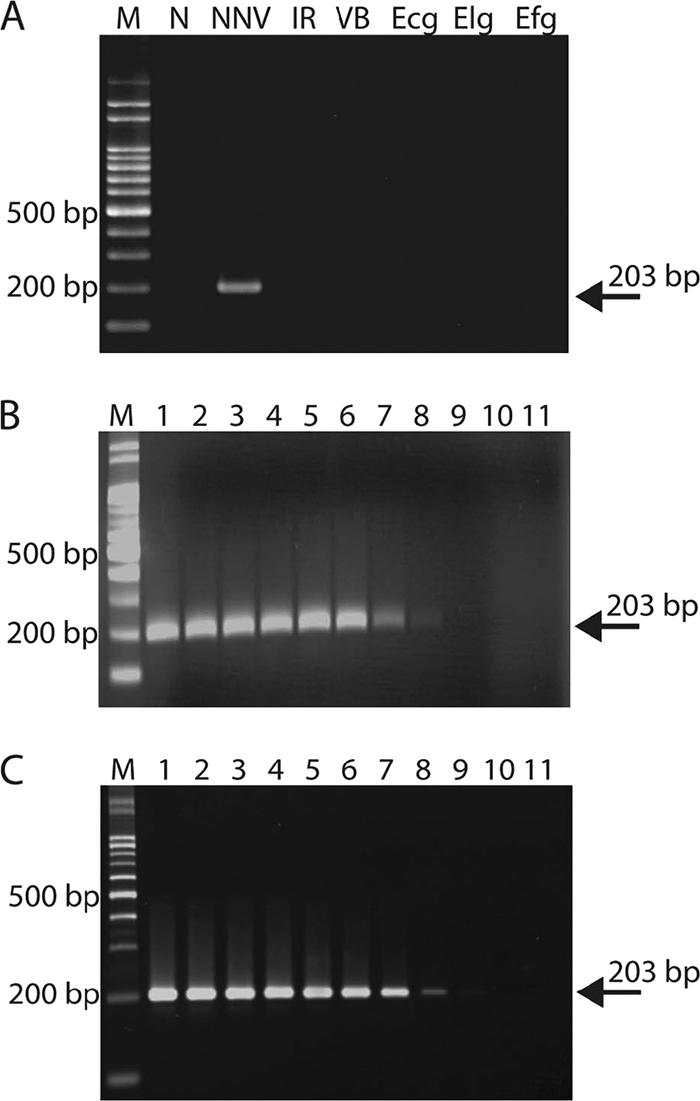
Primer sensitivity and specificity tests. (A) The primer pair used in this study specifically amplified only a 203-bp fragment of NNV coat protein. M, 100-bp DNA marker; N, negative control (deionized distilled H2O as template); NNV, NNV particles (2 μg); IR, purified iridovirus (2 μg); VB, Vibrio anguillarum (2 μg); Ecg, E. coioides genome from non-NNV-infected fish (100 ng); Elg, E. lanceolatus genome from non-NNV-infected fish (850 ng); Efg, E. fuscoguttatus genome from non-NNV-infected fish (270 ng). (B) Ten-fold serial dilutions of pGEM-T-NNV were used for PCRs. The detection limitation of RT-PCR on plasmid was about 100 DNA copies. Lanes 1 to 10 indicate the DNA copy number from 109 to 100. Lane 11, negative control (distilled deionized H2O), M, 100-bp DNA marker. (C) Ten-fold serial dilutions of virus particles were used as template for RT-PCR. The limitation of RT-PCR sensitivity was about 190 to 1,900 virus copies. Lanes 1 to 10 indicate the virus copy numbers from 1.9 × 10¹⁰ to 1.9 × 101. Lane 11, negative control (distilled deionized H2O). M, 100-bp DNA marker. The arrows indicate the 203-bp PCR product amplified from the primer pair (203-F and 203-R) used in this study.
Sensitivity test of the conventional PCR assay on gel.
The analytical sensitivity of PCR was initially optimized using a plasmid (pGEM-T-NNV) containing the NNV coat protein gene or cDNA obtained from viral RNA. PCR and the RT-PCR detection limitation on the plasmid (Fig. 2B) and virus particles (Fig. 2C), respectively, revealed that the use of 10-fold serial dilutions of pGEM-T-NNV, and virus particles as templates, permitted detection of as few as 100 cDNA copies (Fig. 2B) and 1,900 virus copies (Fig. 2C).
Sensitivity test of the real-time qPCR assay.
For real-time qPCR, the melting curve for the 203F and 203R primer pair was 85°C. The standard curve was generated by 10-fold dilutions of the plasmid (1 × 10⁹ to 1 × 101 copies) (see Fig. S1A and Table S2 in the supplemental material)/virus (1.9 × 10¹⁰ to 1.9 × 10² copies) (see Fig. S1B and Table S3 in the supplemental material), and accurate measurement of the assay was evaluated by linearity parameters, e.g., assay regression coefficient (r2) values of ≥0.99 and 100% reaction efficiency. In addition, the mean CT values of replicate assays ranged from 5.17 ± 0.09 (for 1 × 10⁹ copies) and 6.09 ± 0.06 (for 1.9 × 10¹⁰ copies) to 36.01 ± 0.66 (for one copy) for plasmid DNA and 36.52 ± 1.65 (for 1.9 × 10²copies) for viral cDNA, respectively (see Fig. S1A and S1B and Tables S2 and S3 in the supplemental material). Serial dilutions of plasmid DNA/viral cDNA were used to examine the variability of the real-time qPCR assay in determining the value of the coefficient of variation (CV). The CV was 0.9% to 6.34% for the plasmid assay (see Fig. S1A and Table S2) and 0.34% to 5.07% for the viral assay (see Fig. S1B and Table S3).
NNV spread in fish farm populations.
During the investigation of the NNV infection of 24 different grouper aquaculture farms, which involved monitoring the same fish for 2 weeks in the laboratory, fin tissue samples from the first sampling day (test result) and 2 weeks later (tracking test result) were subjected to real-time qPCR analysis. The results revealed the rapid spread of NNV, which contaminated the entire tank within the 2-week period (Table 1). In fish farms/tanks 11 and 19, only one in six (16.6%) grouper fish were identified as NNV infected by real-time qPCR in the test result, whereas the tracking test results for both samples were 100% within 2 weeks. In fish farms/tanks 5, 8 and 17, no NNV (0%) was detected from six randomly collected fish in the test and tracking test results (Table 1).
Brain, eye, and fin tissues from NNV-infected fish contain a large number of NNV.
The organs (brain, eye, gill, fin, head kidney, heart, intestine, liver, muscle, and spleen) from NNV-naturally infected grouper could be classified into two groups according to the real-time qPCR results for NNV. One group (brain, eye, and fin) contained >109 copies of the NNV coat protein gene per gram tissue, while the other group (gill, head kidney, heart, intestine, liver, muscle, and spleen) had <107 copies of NNV coat protein gene per gram tissue (Fig. 3). Grouper fin tissues contained a copious number of NNV similar to that for the primary tissues and 100-fold higher than that for the other tissues (Fig. 3).
Fig. 3.

Real-time qPCR results for NNV copy number in different organs of infected groupers. Brain, eye, gill, fin, head kidney, heart, intestine, liver, muscle, and spleen were obtained from groupers naturally infected with NNV. Within those organs, brain, eye, and fin contained >109 copies of NNV coat protein gene per gram tissue, and the other organs (gill, head kidney, heart, intestine, liver, muscle, and spleen) had <107 copies of NNV coat protein gene per gram tissue. The experiments were repeated three times, and six fish samples were examined each time.
NNV propagation in fin tissue cells is higher than that in liver and head kidney cells.
From the cell line experiments, grouper fin, liver, and kidney cells were used to culture NNV. The results showed that more NNV could be reproduced in fin cells (GF-1) than in liver and head kidney cells at 5 days postinfection (p.i.) (Fig. 4). In grouper liver (GLa) cells and head kidney (GK) cells, the amount of NNV (1.0 × 10⁸ to 1.0 × 10⁹ copies per ml for GLa cells and 1.0 × 10⁷ to 1.0 × 10⁸ copies per ml for GK cells) stabilized after 1 and 2 days p.i., respectively. But, in grouper fin cells (GF-1 cells), NNV continued to amplify (1.0 × 10¹¹ to 1.0 × 10¹² copies per ml) until 5 days p.i. (Fig. 4). During the first 2 days p.i., the amount of virus in GLa and GK cells amplified very rapidly (>1,000-fold) but that in GF-1 cells was amplified only >100-fold. However, at 5 days p.i., the amount of virus in GF-1 cell increased 10 million-fold from that in the initial inocula (Fig. 4). Monitoring the development of the cytopathic effect (CPE) after NNV infection of GF-1 cells (Fig. 5) revealed that >50% of the infected cells become rounded, swollen, detached, and lytic by 3 days p.i. By 5 days p.i., the disintegration of cells was evident (Fig. 5).
Fig. 4.

NNV propagation in GF-1, GLa, and GK cells. Cultures of GF-1, GLa, and GK cells were inoculated with 5 × 10⁴ to 5 × 10⁵ copies of NNV per ml, which was isolated from naturally infected groupers. Cells were sampled separately at days 0, 2, 3, 4, 5, 6, 7, 8, and 9 after inoculation. RNA was isolated from the samples, cDNAs were quantified by real-time qPCR, and then the copy number of NNV was determined and calculated according to the molecular weight of NNV. The data show the NNV RNA copies per ml from the sample.
Fig. 5.

Cytopathic effects elicited by NNV infection of GF-1 cells. Subconfluent GF-1 cells were inoculated with NNV at 28°C for 5 days prior to microscopic visualization. The cytopathic effect was apparent as refractile, rounded, swollen, and semiattached cells, and areas of clearance were compared to those of the uninfected control cells. (A) Uninfected GF-1 cells. (B) Cells examined at 5 days p.i. Bar = 10 μm.
Grouper fin tissue contains NNV.
Four-micrometer-thick sections of NNV-infected grouper fin tissues (for the location of the sampled tissue, see Fig. 6A) were hybridized with the 203NNV probe (amplified by 203-F and 203-R). A positive reaction was characterized by a dark precipitate in fin tissues (Fig. 6B). The dark precipitation spots accumulated in the nuclei of osteocytes in the spiny dorsal fin. No positive reaction was found in fin tissue from NNV-free groupers (Fig. 6D). H&E staining revealed fewer cells in the NNV-infected fin tissues (Fig. 6C) than in NNV-free infected fin tissues (Fig. 6E), indicative of cell death upon NNV infection.
Fig. 6.

NNV detection on fin tissue of naturally infected groupers by in situ RT-PCR. (A) Image of grouper fish (35 days old); the circle indicates the sampling position on dorsal fin. (B) Fin tissue from NNV-naturally infected fish. The arrows indicate the signals of virus characterized by dark precipitate spots. (C) H&E staining of fin tissue from NNV-naturally infected fish. (D) The healthy grouper (NNV infection free) did not show any dark precipitation spots. (E) H&E staining of fin tissues (NNV infection free). Bar = 50 μm (panels B, C, D, and E); bar = 1 cm (panel A).
CT value as an indicator of NNV infection.
Twenty-four grouper aquaculture farms and six fish from each farm were sampled for NNV infection by the examination of fin tissues and the monitoring of the same collected fish for 2 weeks. From 36 NNV-infected grouper fish and 11 healthy groupers (i.e., absence of symptoms of NNV infections) (see Table S4 in the supplemental material), fin tissues were collected for the detection of NNV infection without need of fish sacrifice. NNV-infected and healthy grouper displayed CT values of 12 to 24 and 29 to 32, respectively (Fig. 7; see also Table S4).
Fig. 7.
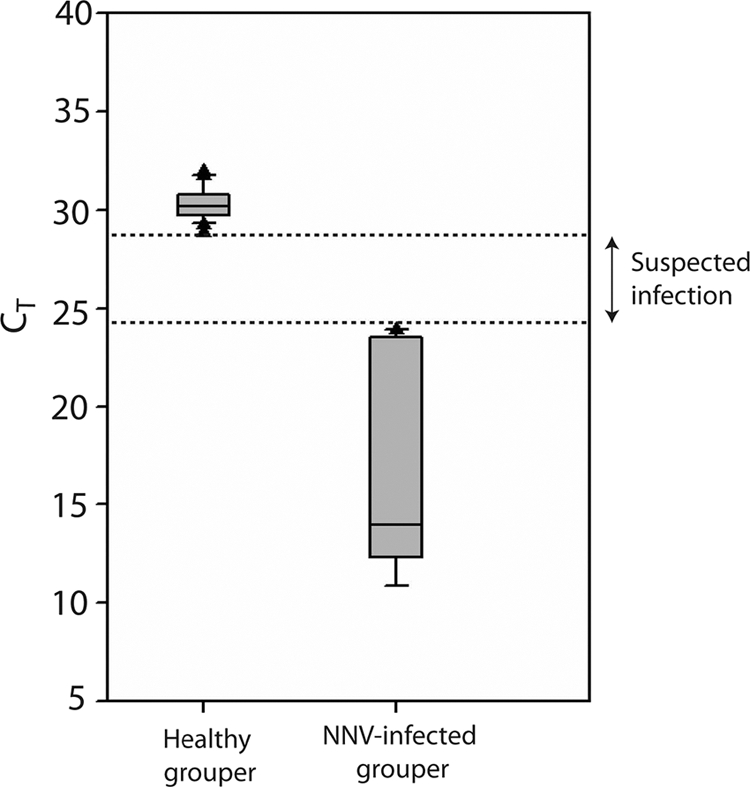
The distribution of CT values for infected and healthy groupers. The graph shows that the CT value for the NNV-infected grouper as 12 to 24, while that of healthy groupers ranged from 29 to 32. The region between broken lines indicates the CT values of 24 to 29, indicative of suspected infection with NNV.
DISCUSSION
NNV infection is a serious problem in grouper farming. Mortality in hatchery-reared larvae and juveniles can reach 100% of the population. A rapid and reliable technique for detecting virus-infected fish could circumvent an outbreak and so is an important and very desirable goal. Many methods had been developed to detect and quantify infectious virus particles, such as cell culture-based methods, immunohistochemistry and enzyme-linked immunosorbent assay; all are time-consuming and complicated. Some methods can detect only fish that display clinical signs of NNV infection but not fish that are asymptomatic in the early stage of infection. Therefore, predictive information is crucial for disease control in fish farms (6).
Different methods detecting virus have various levels of sensitivity. In recent years, real-time qPCR has been shown to satisfy the need for fast, reliable, and accurate quantification and sensitive diagnostic testing with a reduced risk of carryover contamination (6, 28). The presently developed method was capable of detecting from 1.0 × 10⁹ copies to as low as two copies per reaction. Detection of two virus copies per reaction can easily identify fish recently infected with NNV that have been hitherto clinically silent and represents the most sensitive detection method described to date (5, 8, 10, 18, 19). Moreover, a linear regression of over 0.99 (r2 > 0.99) produces a CV from 0.9% to 6.34% for the plasmid assay and 0.34% to 5.07% for the viral assay, indicating that the assays are highly reproducible. The high sensitivity combined with its wide detection range makes the present method ideal for detecting NNV infections in different tissues.
The actual application of the real-time qPCR method to fish farms showed that monitoring the disease in individual fish was possible by sampling fin tissues. The results from the investigation of the NNV infection of 24 different grouper aquaculture farms for 2 weeks also revealed the rapid spread of NNV to the entire population (Table 1). The results indicated that NNV is highly infectious horizontally and causes a high mortality rate (100%).
NNV can be detected in brain, eye, gill, skeletal muscle, liver, pyloric gland, intestine, and blood cells in the heart of diseased juvenile grouper by in situ hybridization (4). In larvae of striped jack (Pseudocaranx dentex), NNV can be detected in the spinal cord, brain, and retina tissues (11). Presently, similar results were obtained, in which the brain and eye in NNV-infected juvenile grouper contained over 1.0 × 10⁹ virus copies per gram tissue; other tissues, including the gill, head kidney, heart, intestine, liver, muscle, and spleen, usually contained <107 virus copies per gram tissue (Fig. 3). Notably, fin tissue also contained >1.0 × 10⁹ NNV copies per gram tissue, matching primary tissues (brain and eye) (4, 11). Why the fin tissue harbors such a large amount of the virus and whether fin tissue is also a primary target of NNV are intriguing issues that warrant study.
Fish dorsal fin induction and development are related to neural crest cells (19, 25), which later develop into the peripheral nervous system, which is the target of NNV (20). The initial site of multiplication of NNV is the spinal cord, from which the virus spreads to the brain and finally to the retina (20). Hyperplasia can also be observed in the skin of naturally infected fish, and virus multiplication has been described for these affected epithelial cells (20).
The collective information from previous and present studies is compatible with the suggestion that NNV infection might stem from the entry of the virus into fin epithelial cells or skin epithelial cells. After NNV enters through the fin skin into fin tissue, the virus multiplies and spreads to the circulatory system. NNV particles are ultimately distributed in primary tissues with copious amounts of NNV remaining in fin tissue, resulting in a carrier state.
Contrary to the above view, no virus particles were evident in the skin or gills following the experimental injection of NNV into the fish circulatory system (20), which could rule out the possibility of NNV being released from a carrier host through the skin or gill. Release may instead involve the fin epithelial cells. In the wild, NNV could be released from fin epithelial cells into seawater to be horizontally transmitted to other fish. Further studies of the horizontal transmission hypothesis, such as labeling NNV with a fluorescent protein and visualizing the movement of NNV by live cell imaging, are necessary.
Currently, grouper fish have to be sacrificed, and tissues (e.g., brain or eye) must be collected for NNV detection. This holds true even if sampling is from the gills or blood (blood can be collected only from the heart in the early stage of grouper infection). The presently described sampling of fin tissue can achieve NNV detection without killing the fish. Therefore, the detection of NNV and monitoring of the amount of virus from grouper fin may provide the solution to the early prevention of NNV infection and increasing the safety level (virus free) of trade in groupers between breeding fish farms.
In real-time qPCR, a positive reaction is detected by accumulation of a fluorescent signal, which not only allows detection of the presence of the viral genome but also enables an estimate of its infectious potential. RT-PCR or the virus cultivation test alone may not detect NNV-infected groupers that have yet to display signs of NNV infection. CT is defined as the number of cycles required for the fluorescent signal to cross the threshold. CT levels are inversely proportional to the amount of target nucleic acid in the sample. The data from the CT value of NNV-infected and noninfected grouper can be used for identification and isolation of potentially infected groupers before outbreak. Lower CT values (<29) represent strong positive reactions, indicative of abundant NNV in the sample and of a higher probability of a serious outbreak of VNN. CT values of 24 to 28 represent suspected infections, while CT values of >29 are indicative of weak reactions involving minimal amounts of target nucleic acid, which could represent an environmental contamination.
In conclusion, the presently described real-time qPCR method enables detection and quantification of NNV in living grouper fish. The method can provide more information, such as the number of virus copies, and can identify latently infected fish farms better than reverse transcription-PCR. The present method is very rapid, highly sensitive, and applicable to the routine high-throughput assay, making it a suitable tool for diagnostic, epidemiological, and genetic studies of grouper aquaculture. Moreover, grouper fin can be used as the major target organ for NNV detection without the need to seriously injure or sacrifice the grouper. Therefore, the method could be applied for continuously monitoring NNV infection and also can provide information for evaluating the vaccination of broodstocks. The CT value can also provide an early warning of NNV infection before outbreaks in grouper aquaculture farms.
Supplementary Material
ACKNOWLEDGMENTS
We thank Brian D. Hoyle for editing the manuscript. We thank Fu-Ping Chang, Nai-Heng Yu, and Tekho Co. Ltd. (An Pin Live Fish Center) for kindly providing living fish samples from the participating fish farms for this study.
This research was funded and supported by Fish Breeding Association Taiwan and the Landmark Project (B0127) of National Cheng Kung University, under the plan of University Advancement, Ministry of Education, Taiwan.
Footnotes
Supplemental material for this article may be found at http://jcm.asm.org/.
Published ahead of print on 12 January 2011.
REFERENCES
- 1. Bustin S. A. 2002. Quantification of mRNA using real-time reverse transcription PCR (RT-PCR): trends and problems. J. Mol. Endocrinol. 29:23–39 [DOI] [PubMed] [Google Scholar]
- 2. Carstens E. B., et al. 2000. Virus taxonomy. Academic Press, San Diego, CA [Google Scholar]
- 3. Chen Y. M., Su Y. L., Lin J. H. Y., Yang H. L., Chen T. Y. 2006. Cloning of an orange-spotted grouper (Epinephelus coioides) Mx cDNA and characterization of its expression in response to nodavirus. Fish Shellfish Immunol. 20:58–71 [DOI] [PubMed] [Google Scholar]
- 4. Chi S. C., Lo B. J., Lin S. C. 2001. Characterization of grouper nervous necrosis virus (GNNV). J. Fish Dis. 24:3–13 [Google Scholar]
- 5. Ciulli S., Galletti E., Gallina L., Vaccari F., Prosperi S. 2006. Detection and quantification of Betanodavirus by real time PCR. Vet. Res. Comm. 30:235–238 [Google Scholar]
- 6. Dalla Valle L., et al. 2005. Development of a sensitive and quantitative diagnostic assay for fish nervous necrosis virus based on two-target real-time PCR. Vet. Microbiol. 110:167–179 [DOI] [PubMed] [Google Scholar]
- 7. Fenner B. J., Thiagarajan R., Chua H. K., Kwang J. 2006. Betanodavirus B2 is an RNA interference antagonist that facilitates intracellular viral RNA accumulation. J. Virol. 80:85–94 [DOI] [PMC free article] [PubMed] [Google Scholar]
- 8. Grove S., Faller R., Soleim K. B., Dannevig B. H. 2006. Absolute quantitation of RNA by a competitive real-time RT-PCR method using piscine nodavirus as a model. J. Virol. Methods 132:104–112 [DOI] [PubMed] [Google Scholar]
- 9. Iwamoto T., et al. 2001. Establishment of an infectious RNA transcription system for Striped jack nervous necrosis virus, the type species of the betanodaviruses. J. Gen. Virol. 82:2653–2662 [DOI] [PubMed] [Google Scholar]
- 10. Iwamoto T., Mori K., Arimoto M., Nakai T. 2001. A combined cell-culture and RT-PCR method for rapid detection of piscine nodaviruses. J. Fish Dis. 24:231–236 [Google Scholar]
- 11. Kiryu I., de la Peña L. D., Maeno Y. 2007. Distribution of nervous necrosis virus in orange-spotted grouper Epinephelus coioides with asymptomatic infection. Fish Pathol. 42:163–165 [Google Scholar]
- 12. Lin C. S., et al. 2001. Characterization of virus-like particles assembled in a recombinant baculovirus system expressing the capsid protein of a fish nodavirus. Virology 290:50–58 [DOI] [PubMed] [Google Scholar]
- 13. Mackay I. M., Arden K. E., Nitsche A. 2002. Real-time PCR in virology. Nucleic Acids Res. 30:1292–1305 [DOI] [PMC free article] [PubMed] [Google Scholar]
- 14. Mori K. I., et al. 1992. Properties of a new virus belonging to nodaviridae found in larval striped jack (Pseudocaranx dentex) with nervous necrosis. Virology 187:368–371 [DOI] [PubMed] [Google Scholar]
- 15. Munday B. L., Nakai T., Nguyen H. D. 1994. Antigenic relationship of the picorna-like virus of larval barramundi, Lates calcarifer Bloch to the nodavirus of larval striped jack, Pseudocaranx dentex (Bloch and Schneider). Aust. Vet. J. 71:384–385 [DOI] [PubMed] [Google Scholar]
- 16. Munday B. L., Nakai T. 1997. Special topic review: nodaviruses as pathogens in larval and juvenile marine finfish. World J. Microbiol. Biotechnol. 13:375–381 [Google Scholar]
- 17. Nagai T., Nishizawa T. 1999. Sequence of the non-structural protein gene encoded by RNA1 of striped jack nervous necrosis virus. J. Gen. Virol. 80:3019–3022 [DOI] [PubMed] [Google Scholar]
- 18. Nerland A. H., Skaar C., Eriksen T. B., Bleie H. 2007. Detection of nodavirus in seawater from rearing facilities for Atlantic halibut Hippoglossus hippoglossus larvae. Dis. Aquat. Org. 73:201–205 [DOI] [PubMed] [Google Scholar]
- 19. Newth D. R. 1956. On the neural crest of the lamprey embryo. J. Embryol. Exp. Morphol. 4:358–375 [Google Scholar]
- 20. Nguyen D., Nakai T., Muroga K. 1996. Progression of striped jack nervous necrosis virus (SJNNV) infection in naturally and experimentally infected striped jack Pseudocaranx dentex larvae. Dis. Aquat. Org. 24:99–105 [Google Scholar]
- 21. Nuovo G. J. 1995. In situ PCR: protocols and applications. PCR Methods Appl. 4:S151–S167 [DOI] [PubMed] [Google Scholar]
- 22. Ou M. C., et al. 2007. Identification of critical residues in nervous necrosis virus B2 for dsRNA-binding and RNAi-inhibiting activity through by bioinformatic analysis and mutagenesis. Biochem. Biophys. Res. Commun. 361:634–640 [DOI] [PubMed] [Google Scholar]
- 23. Ririe K. M., Rasmussen R. P., Witter C. T. 1997. Product differentiation by analysis of DNA melting curves during polymerase chain reaction. Anal. Biochem. 245:154–160 [DOI] [PubMed] [Google Scholar]
- 24. Skliris G. P., et al. 2001. Phylogenetic and antigenic characterization of new fish nodavirus isolates from Europe and Asia. Virus Res. 75:59–67 [DOI] [PubMed] [Google Scholar]
- 25. Smith M., Hickman A., Amanze D., Lumsden A., Thorogood P. 1994. Trunk neural crest origin of caudal fin mesenchyme in the zebrafish Brachydanio-Rerio. Proc. R. Soc. Lond. B Biol. Sci. 256:137–145 [Google Scholar]
- 26. Sommerset I., Nerland A. H. 2004. Complete sequence of RNA1 and subgenomic RNA3 of Atlantic halibut nodavirus (AHNV). Dis. Aquat. Organ. 58:117–125 [DOI] [PubMed] [Google Scholar]
- 27. Starkey W. G., et al. 2001. Nodavirus infection in Atlantic cod and Dover sole in the UK. Vet. Res. 149:179–181 [DOI] [PubMed] [Google Scholar]
- 28. Starkey W. G., et al. 2004. Detection of piscine nodavirus by realtime nucleic acid sequence based amplification (NASBA). Dis. Aquat. Org. 59:93–100 [DOI] [PubMed] [Google Scholar]
- 29. Reference deleted.
Associated Data
This section collects any data citations, data availability statements, or supplementary materials included in this article.