Abstract
The aim of the study was to investigate longitudinally hepatitis B virus (HBV)-specific T-cell reactivity and viral behavior versus treatment response in tolerant children during combined antiviral therapy. Twenty-three children with infancy-acquired hepatitis B (HBeAg+) belonging to a published pilot study of 1-year treatment with lamivudine/alpha interferon (IFN-α) were investigated. Five seroconverted to anti-HBs (responders). Nine were HLA-A2+ (4 responders and 5 nonresponders). Mutations within the HBV core gene were determined at baseline in liver and in serial serum samples by direct sequencing at baseline; during treatment week 2 (TW2), TW9, TW28, and TW52; and after follow-up week 24 (FUW24) and FUW52. HBV-specific reactivity was evaluated by T-cell proliferation with 16 HBV core 20-mer overlapping peptides and by HLA-A2-restricted core18-27 pentamer staining and CD8+ IFN-γ enzyme-linked immunospot (ELISPOT) assay. HBV core-specific T-cell proliferative and CD8 responses were more vigorous and broader among responders than among nonresponders at TW28 and TW52, while the number of mutations within HBV core gene immunodominant epitopes was lower at TW28 and was negatively associated with HBV-specific T-cell proliferative responses at both time points. The HBV DNA viral load was negatively associated with HBV-specific T-cell proliferative and CD8 responses during treatment, especially at TW28. Treatment-induced transition from immunotolerance to HBV immune control is characterized by the emergence of efficient virus-specific immune responses capable of restraining mutations and preventing viral evasion.
Outcome of infection by the noncytopathic, hepatotropic hepatitis B virus (HBV) depends on the quality and strength of the antiviral immune response. Acute hepatitis B results from multispecific and vigorous CD4 and CD8 reactivity, leading to sustained viral control. In chronic hepatitis B (CHB), immune responses are weak and oligoclonal. The fluctuating balance between virus and immune reactivity results in persistent liver inflammation that, if untreated, may culminate in transplant-requiring end-stage liver disease and/or hepatocellular carcinoma (2, 12, 13, 18-21, 26-29, 34, 37).
Antiviral therapy alters the balance between host immunity and viral replication, enabling weak virus-specific immune responses to strengthen, broaden, and control the virus (1).
Selective pressure exercised by restored virus-specific immune reactivity may promote the emergence of amino acid substitutions within universally recognized HBV core epitopes (17, 25, 33). While some studies suggest that the development of mutations favors HBV persistence through evasion of immune control (17, 33), others suggest that a high number of mutations in the HBV core gene is associated with viral control (16). This apparent discrepancy may be due to different timings of testing and different kinetics of mutation development at different disease stages (16). Of note, long-term monotherapy with first-generation nucleotide/nucleoside analogues leads to treatment-resistant mutations, the emergence of which is prevented by combination therapy (38).
Patients with infancy-acquired CHB become immunotolerant, with a high viral load but minimal liver inflammation. Their HBV-specific immune responses are undetectable or weak and narrowly oriented (12, 19, 22, 26-28, 34). Several mechanisms may account for this immune hyporesponsiveness, including impaired ability of the innate immunity to prime an efficient T-cell response; anergy, deletion, or altered maturation of virus-specific effector cells; and expansion of regulatory T cells suppressing effector cells. Whatever the prevailing mechanism, the result is a paucity of antigen-specific T cells in the circulation and in the liver (12, 29, 34).
No study has longitudinally investigated HBV-specific T-cell reactivity in tolerant children during antiviral therapy. We have sequentially determined T-cell proliferative and CD8 responses and the emergence of amino acid substitutions within immunodominant epitopes encoded by the HBV core gene in a cohort of tolerant children with infancy-acquired HBV infection, some of whom seroconverted to anti-HBs with combined lamivudine-alpha interferon (IFN-α) treatment (11).
MATERIALS AND METHODS
Patients.
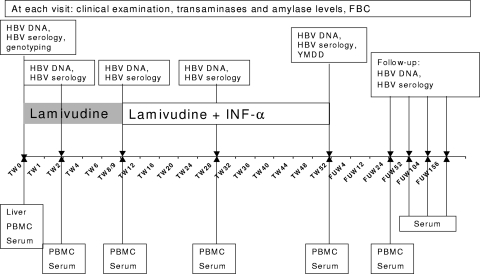
Twenty-three children with perinatally acquired CHB, treated with combination antiviral therapy, were investigated (Table 1). They were hepatitis B envelope antigen positive (HBeAg+) and HBV DNA+, and all but 2 had persistently normal transaminase levels. Their pretreatment liver biopsies showed minimal/mild inflammation and no fibrosis. Lamivudine (3 mg/kg of body weight/day) was administered once daily alone for 8 weeks and for a further 44 weeks in combination with IFN-α2b (5 MU/m2 subcutaneously), given daily for the first 5 doses and then thrice weekly for the remaining 44 weeks (11).
TABLE 1.
Patient clinical and laboratory data
| Parameter | Valuea |
|
|---|---|---|
| Treated (n = 23) | Untreated (n = 7) | |
| Age (yr) | 10.2 (2.9-16.8) | 9.8 (3.8-14.1) |
| Gender (no.) (male/female) | 8/15 | 3/4 |
| Ethnicity (no.) | ||
| Caucasian | 5 | 2 |
| Oriental | 17 | 4 |
| African | 1 | 1 |
| Mixed | 1 | |
| Genotype (no.) | ||
| A | 2 | 1 |
| B | 14 | 3 |
| C | 2 | 1 |
| D | 4 | 1 |
| E | 1 | 1 |
| AST (IU/liter)b | 29 (18-90) | 32 (22-68) |
| HBV-DNA (pg/ml) | 1,717 (445->6,000) | 2,537 (663->6,000) |
Median (range).
AST, aspartate aminotransferase (normal value, <50 IU/liter).
Clinical and laboratory monitoring is summarized in Fig. 1. Sustained virological response was defined as a decrease in HBV DNA below hybridization assay detection limits and anti-HBe seroconversion lasting for >6 months after antiviral therapy discontinuation; complete response was defined as normal aminotransferase levels, decrease in HBV DNA below hybridization detection limits, loss of HBsAg, and anti-HBs seroconversion persisting during a 5-year follow-up (11). At treatment end, 5 patients were anti-HBe positive, and 4 were also HBsAg−/anti-HBs+ (all genotype B). During follow-up, the fifth patient (genotype A) also seroconverted to anti-HBs (40 months after treatment end). These five children are defined as “responders” in the present study. Two further patients (both genotype D) seroconverted to anti-HBe 36 and 48 months after treatment end. Two children with mildly abnormal baseline transaminase levels did not respond to treatment. No lamivudine-related mutations were detected during therapy and follow-up.
FIG. 1.
Treatment and sampling schedule.
Controls included 7 untreated HBeAg+ children with perinatally acquired CHB (Table 1) with minimal/mild inflammation and no fibrosis in liver biopsy; 12 children with chronic hepatitis C virus (HCV) infection (7 males; median age, 13 years; range, 8 to 16 years), 9 healthy adults (4 males; 31 years; range, 28 to 45 years), and 5 adult HCV patients (2 males; 27 years; range, 21 to 49 years).
HBV core peptides.
To investigate T helper proliferative responses, we used overlapping peptides corresponding to genotype A, while to study HLA A2-restricted CD8 responses, we used the HBV core 18-to-27 peptide (core18-27) corresponding to genotypes A, D, and E (sequence, FLPSDFFPSV), which has the same anchor residues as genotypes B and C.
Sixteen HBV core 20-mer overlapping peptides comprising the whole HBV core antigen for genotype A, which shares all anchor areas within the immunodominant epitopes with the other genotypes (amino acids 1 to 183; Chiron, Mimotopes, Australia), were divided into four sets of four peptides spanning amino acid residues 1 to 56, 49 to 104, 97 to 152, and 145 to 183 and used at a final concentration of 1 μM. Peptide purity exceeded 95%.
The immunodominant HLA-A2-restricted cytotoxic T lymphocyte (CTL) epitope (FLPSDFFPSV) core18-27 peptide (ProImmune, United Kingdom) was used for pentamer staining, IFN-γ secretion (final concentration, 5 μg/ml), and IFN-γ enzyme-linked immunospot (ELISPOT) assay (10 μg/ml).
Controls included tetanus toxoid (TTAg) (Connaught International Laboratories, Canada), 1 μg/ml; tuberculin purified protein derivative (PPD) (Glaxo Welcome, United Kingdom), 100 IU/ml; phytohemagglutinin (PHA), 1 μg/ml; phorbol myristate acetate (PMA), 1 μg/ml; ionomycin, 1 μg/ml; and staphylococcal enterotoxin B antigen, 1 mg/ml (all Sigma Aldrich, United Kingdom).
HBV markers.
Serum concentrations of HBV DNA were determined by hybridization assay (Digene) and quantitative PCR (Amplicor Roche, Switzerland). HBsAg, HBeAg, anti-HBe, and anti-HBs were analyzed by microparticle enzyme immunoassay (MEIA; Abbott). HBV genotypes and HBV polymerase YMDD mutation were determined by direct sequencing of PCR-amplified DNA fragments from the pre-S1/pre-S2 and S gene and overlapping polymerase gene regions (8) and compared with known sequences.
T-cell proliferation.
Peripheral blood mononuclear cells (PBMC) were isolated from heparinized blood by density gradient centrifugation. The T-cell proliferative response was evaluated after a 6-day incubation in the presence/absence of peptides (20). Stimulation index (SI) values exceeding 2.5 were considered positive, representing the mean number of cpm plus 3 standard deviations (SD) obtained in 14 HBV-negative adults and 12 HBV-negative children tested against 16 HBV peptides (416 tests).
HLA-A2 typing.
The HLA-A2 type was assessed by flow cytometry (Becton Dickinson [BD], United Kingdom) after the PBMC were stained with an HLA-A2-specific antibody (OneLambda). Nine out of 23 treated (4 responders [all genotype B] and 5 nonresponders [3 genotype B, 1 genotype A, and 1 genotype D]) and 3 out of 7 untreated patients were HLA-A2+.
Staining with HLA pentamer complexes.
Cells were stained with core18-27 phycoerythrin (PE)-labeled pentamer (ProImmune) and with Cy-labeled anti-CD8 monoclonal antibody (BD) ex vivo and after a 10-day incubation in the presence of core18-27 peptide (18, 34). The proportion of CD8/pentamer+ cells was calculated by flow cytometry using CellQuest software (BD) gated on 5,000 lymphocytes, and the results were expressed as the percentage of pentamer+ cells among CD8 cells.
Enumeration of CD8 HBV-specific IFN-γ-producing cells by ELISPOT.
Ninety-six-well nitrocellulose plates (Millipore) were coated overnight at 4°C with anti-IFN-γ monoclonal antibody (EuroClone, Italy) following the manufacturer's instructions (31). PBMC (2 × 10⁵ cells/well) were stimulated with core18-27 or PHA for 20 h at 37°C and developed as described previously (31). After drying, the spots were counted using an ELISpot reader (AID Diagnostika GmbH, Germany). Specific spot-forming cells were calculated as the mean number of spots in the presence of antigen minus the mean number of spots in the absence of antigen per 1 × 10⁶ PBMC (sp. SFC/106 PBMC).
IFN-γ secretion by core18-27-specific CD8 T cells.
PBMC were stained with core18-27 pentamer and incubated for 3 hours with HBV core18-27 peptide. IFN-γ secretion was assessed using a commercial kit (Miltenyi Biotec, Germany). Cells were then stained with anti-CD8 Cy-labeled antibody and counted by cytofluorimetry excluding dead cells by propidium iodide (PI) staining (Sigma Aldrich; 0.5 μg/ml) using CellQuest software. The results are expressed as the percentage of pentamer+ IFN-γ-producing CD8+ cells (18, 34).
HBV DNA isolation.
HBV DNA was isolated from 75-μl serum samples (stored at −70°C) using proteinase K (Sigma Aldrich) incubation at 56°C for 2 h. Viral DNA was obtained by the phenol-chloroform method (10) and was dissolved in 50 μl of nuclease-free water (Sigma Aldrich).
HBV DNA in the liver was isolated from ∼1 to 2 mm of tissue by incubation with proteinase K for 2 h at 56°C. DNA was isolated as described above (10).
Nested PCR of the HBV core gene.
Five microliters of DNA template was amplified in the presence of 1× PCR buffer (New England Biotech [NEB], United Kingdom), 2.5 U of Taq polymerase (NEB), 0.25 mM each deoxynucleotide (Sigma Aldrich), and 20 pmol of each primer (Sigma Genosys, United Kingdom) in a final volume of 25 μl (6, 17, 23, 25, 33). For the HBV core gene region, the external P1 (5′-ATA AGA GGA CTC TTG GAC TA-3′) and P2 (5′-AAA GAC AGG TAC AGT AGA AG-3′) primers were used in the first-round reaction on an automated Hybaid NBS 0.2S Satellite Thermocycler (MWG Biotech, Germany). The nested reaction was performed with internal primers P3 (5′-TTC AAG CTG TGC CTT GGG TG-3′) and P4 (5′-TCT TCT AGG GGA CCT GCC TCG-3′). For the precore region, primers P1 and P9 (5′-GTT GCC TGA GTG CTG TGT GG −3′) were used. PCRs were performed as described previously (33). A High Pure PCR Product Purification Kit (Roche Applied Science, United Kingdom) was used to purify positive PCR products shown on a 2% agarose gel in UV light.
Direct sequencing of HBV core gene.
Five microliters of purified PCR product was amplified in the presence of 1× BigDye Terminator v1.1/v3.1 sequencing buffer (Applied Biosystems [AB]), BigDye Terminator v3.1 sequencing kit (AB), and primers P3/P4 for the core region and primers P1/P4 for the precore region in a sequencing PCR, followed by PCR product precipitation (17, 33). The diluted PCR product was analyzed with the automated sequencer 3100 Avant Genetic Analyzer (all AB). The sequencing results were analyzed using Sequencing Analysis version 5.1 software (AB).
Direct sequence results were compared with known genotype-specific HBV core gene sequences. Nucleotide (synonymous) and amino acid (nonsynonymous) substitutions within universally recognized T helper (Th 1 to 20 and Th 50 to 69), CTL (CTL 18 to 27 and CTL 141 to 151), and B-cell (B 74 to 89, B 107 to 118, and B 130 to 138) immunodominant epitopes were compared with wild-type sequences, and the results were expressed as the number of differences in substitutions (6, 7, 23, 25, 33).
To identify mutations within the basal core promoter (BCP) region and the precore region, including the 1896 stop codon, the results of the purified and sequenced PCR product were compared with known sequences at codons 1762, 1764, and 1896.
Real-time PCR for HBV DNA quantification.
The HBV DNA viral load (relaxed circular lsqb]RC] HBV DNA) was quantified by real-time TaqMan PCR (8). The liver genomic-DNA yield was measured semiquantitatively by Nanodrop (NanoDrop Technologies), and the concentration of genomic DNA was determined with a Quantifiler Human DNA quantification kit (AB). Five microliters DNA extracted from serum and 100 ng liver genomic DNA diluted in 5 μl nuclease-free water were amplified with primers P5 (5′-AGT GTG GAT TCG CAC TCCT-3′) and P6 (5′-GAG TTC TTC TTC TAG GGG ACC TG-3′) (0.75 μM), 0.2 μM HBV probe PRB1 (5′-CCA AAT GCC CCT ATC TTA TCA ACA CTT CC-3′) labeled with the fluorophore 6-carboxyfluorescein (FAM) and nonfluorescent quencher (AB) (8) using ABI Prism 7000 SDS software (AB). The concentration was determined using a 12-point standard curve generated with plasmid pHBV991 (1010 to 1 copies/ml), and the results were expressed as log10 number of HBV DNA copies per ml of serum or per ng of liver genomic DNA. The intra-assay coefficient of variation (CV) for triplicate experiments was 0.22 to 1.12%; the interassay CV, determined on six samples in 5 different runs, was 0.28 to 0.95%.
Real-time PCR for cccDNA quantification.
Liver HBV covalently closed circular DNA (cccDNA) was quantified by real-time TaqMan PCR after treatment of tissue genomic DNA with 25 U ATP-dependent DNase (PlasmidSafe; Epicentre) (14, 36). The digestion product containing HBV cccDNA was amplified in the presence of P7 (5′-CTC CCC GTC TGT GCC TTCT-3′) and P8 (5′-GCC CCA AAG CCA CCC AAG-3′) primers (0.5 μM) and 0.2 μM HBV probe PRB2 (5′-ATG GAG ACC ACC GTG AAC-3′) labeled with FAM and tetramethylrhodamine (TAMRA) quencher; the primers and probe covered a 355-bp fragment in an HBV core gene conserved region (14, 35). The cccDNA concentration was determined using a 12-point standard curve generated with plasmid pHBV991 (107 to 10−3 copies/ml). An exact determination of the liver DNA genomic concentration was obtained with Quantifiler Human DNA. The results are expressed as log10 number of cccDNA copies per ng of liver genomic DNA (detection limit, 5 × 10⁻¹ copies/ng), intra- and interexperimental assay CV ranges were 1.23 to 2.25% and 0.58 to 1.89%.
Immunohistochemical detection of HBcAg.
HBcAg expression was detected by immunostaining formalin-fixed, paraffin-embedded liver specimens (19), using rabbit anti-HBc as the primary antibody (Dako, United Kingdom) and EnVision System anti-rabbit horseradish peroxidase as a revealing reagent (Dako). The number of hepatocytes expressing nuclear and/or cytoplasmic HBcAg was scored semiquantitatively by counting 3 to 5 fields at ×250 magnification.
Statistical analysis.
Descriptive statistics (median and interquartile range) was used to compare different variables. Differences in results were assessed using the Mann-Whitney U test and Fisher exact test as required. Correlation between variables was assessed by the Spearman rank order correlation coefficient. Generalized estimating equations (GEE), which allow multivariate analysis while accounting for dependency between repeated measures, were used to study multivariate interrelations between immune responses, the number of viral mutations, and the viral loads at different time points. Statistical analysis was performed using the SPSS statistical package (SPSS Inc.) and the R software.
RESULTS
T-cell proliferation.
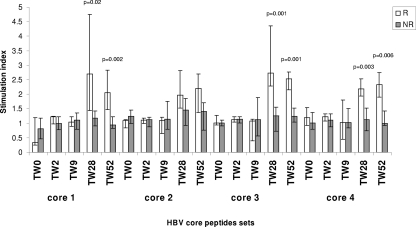
T cells from patients at baseline and treatment week 2 (TW2) and TW9 and from HBV-negative controls did not respond (median SI, <1.2) to HBV core peptides. At TW28 and TW52 (Fig. 2 and Table 2), HBV-specific T-cell proliferation in responders was higher than at baseline and in nonresponders. At TW28, 9 (39%) patients reacted to at least one peptide set; they included all 5 responders and 4 (22%) nonresponders, including 2 who became anti-HBe+ during follow-up. Four responders reacted to at least two peptide sets, including one patient who reacted to 5, while nonresponders reacted to only one. At TW52, 7 (30%) patients reacted to at least one peptide set, including the 5 responders and 2 nonresponders who became anti-HBe+ during follow-up. Three responders reacted to at least two HBV core peptide sets. For 12 patients (4 responders and 8 nonresponders), T-cell proliferation was also performed at TW12 and TW16. At TW12, reactivity to one peptide set was detected in one responder but not in nonresponders. At TW16, 2 out of 4 responders reacted to one peptide set and 1 out of 4 to two peptide sets, while only 1 out of 8 nonresponders reacted to one peptide set. The strength of HBV-specific responses after stimulation with peptide sets 3 and 4 was higher in responders than nonresponders at TW16 (peptide set 3, median 1.99 versus 1.08, P = 0.01; peptide set 4, 2.01 versus 1.06, P = 0.04). T-cell proliferation was not tested at follow-up because of the limited number of cells. Untreated HBV+ children and pediatric and adult HBV-negative controls did not respond to HBV peptides (Table 2). T cells from responders, nonresponders, and controls proliferated similarly in the presence of TTAg, PPD, and PHA (data not shown; available upon request from the authors).
FIG. 2.
HBV core-specific T-cell proliferative responses to HBV core peptide sets during antiviral therapy. R, responders; NR, nonresponders. The error bars indicate interquartile ranges.
TABLE 2.
HBV core-specific T-cell proliferative responses
| Corea | Controlsb |
Treated patientsc |
||||||||
|---|---|---|---|---|---|---|---|---|---|---|
| Non-HBV-treated (n = 7) |
HCV children (n = 12) | HBV-negative adults (n = 14) | TW0 vs. TW9 |
TW0 vs. TW28 |
TW0 vs. TW52 |
|||||
| Yr 0 | Yr 1 | R (n = 5) | NR (n = 18) | R (n = 5) | NR (n = 5) | R (n = 5) | NR (n = 18) | |||
| 1 (aa 1-56) | 0.92 (0.52-1.25) | 0.97 (0.62-1.12) | 1.01 (0.68-1.18) | 0.99 (0.67-1.30) | 0.23 | 0.05 | 0.09 | 0.09 | 0.01 | 0.41 |
| 2 (aa 49-104) | 1.01 (0.56-1.14) | 0.99 (0.57-1.24) | 0.93 (0.69-1.21) | 1.03 (0.54-1.08) | 0.56 | 0.55 | 0.01 | 0.15 | 0.02 | 0.59 |
| 3 (aa 97-152) | 1.08 (0.72-1.18) | 1.02 (0.69-1.31) | 1.11 (0.77-1.23) | 0.99 (0.56-1.31) | 0.34 | 0.25 | 0.02 | 0.44 | 0.01 | 0.21 |
| 4 (aa 145-183) | 1.10 (0.68-1.35) | 1.08 (0.71-1.33) | 1.04 (0.74-1.13) | 0.98 (0.55-1.15) | 0.74 | 0.82 | 0.01 | 0.84 | 0.01 | 0.92 |
aa, amino acids.
Results are expressed as median and range.
Boldface numbers represent significant differences between two treatment time points.
Frequency of HBV core-specific CD8 T cells. (i) Pentamer staining.
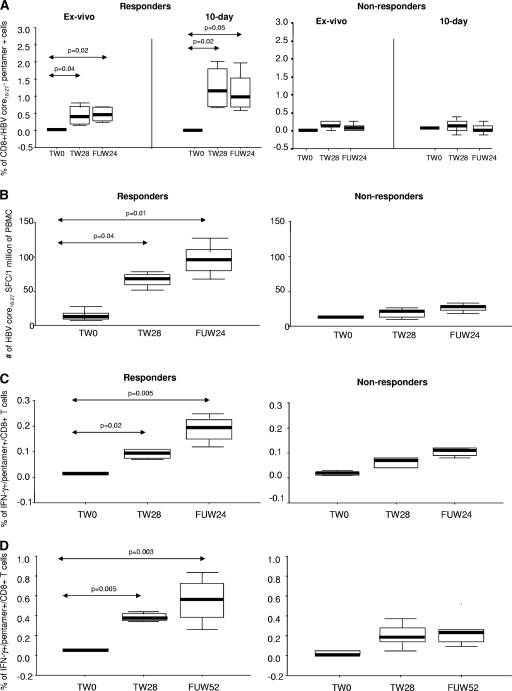
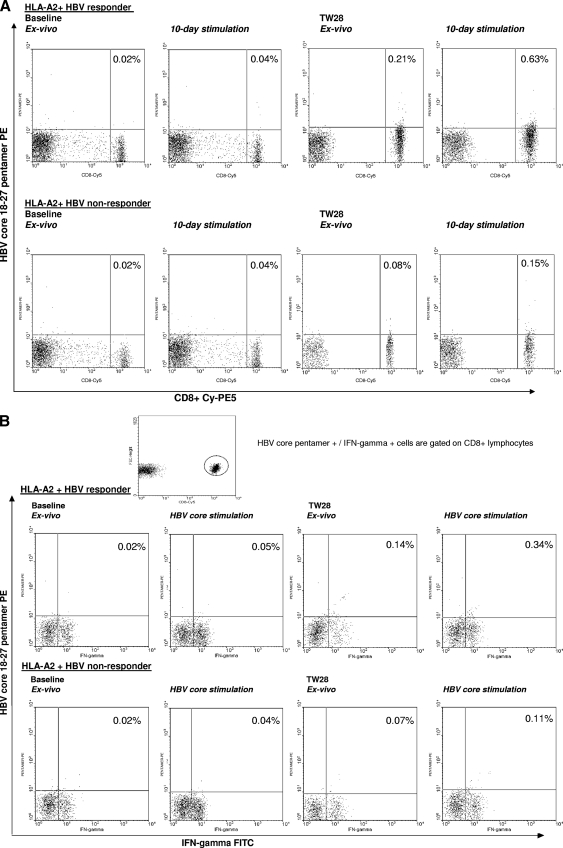
At baseline, there was no difference in the frequencies of HBV core pentamer+ CD8+ T cells ex vivo and after 10 days of incubation between 9 HLA-A2+ patients, 2 HLA-A2-negative patients, and 4 healthy HLA-A2+ controls. At TW28 and FUW24 (time points with sufficient cells), the frequency of core-specific CD8+ T cells increased in all 9 treated HLA-A2+ patients ex vivo and after 10-day stimulation compared to baseline, with higher frequencies present in responders than in nonresponders (Fig. 3 A). Plots for representative patients are shown in Fig. 4. For 6 patients (2 responders and 4 nonresponders) for whom ex vivo pentamer staining was also performed at TW16, the frequency of core-specific CD8+ T cells tended to be higher in responders than nonresponders (median, 0.08 versus 0.04; P = 0.09). Stimulation with PMA and ionomycin did not increase the proportion of HBV core-specific CD8+ T cells in responders and nonresponders (data not shown; available upon request from the authors).
FIG. 3.
HBV-specific T-cell immune responses. (A) Frequency of CD8+ T cell HBV core18-27 pentamer+ ex vivo and after 10-day incubation. (B) Numbers of HBV core18-27-specific CD8+ T cells producing IFN-γ (ELISPOT). (C) Frequency of HBV core18-27 pentamer+/CD8+ T cells producing IFN-γ ex vivo. (D) Frequency of HBV core18-27 pentamer+/CD8+ T cells producing IFN-γ after stimulation with HBV core18-27 peptide. Horizontal black bars and error bars represent median and interquartile ranges, respectively.
FIG. 4.
(A) Flow cytometry plots of HBV core18-27 pentamer staining in two representative patients. (Top row) HLA-A2-positive responder. (Bottom row) HLA-A2-positive nonresponder. Vertical axis, HBV core18-27 pentamer-PE; horizontal axis, anti-CD8-Cy-PE5. (B) Flow cytometry plots of IFN-γ-secreting CD8+ HBV core18-27 pentamer-positive cells from two representative patients. (Top row) HLA-A2-positive responder. (Bottom row) HLA-A2-positive nonresponder. Vertical axis, HBV core18-27 pentamer-PE; horizontal axis, anti-IFN-γ-fluorescein isothiocyanate (FITC).
(ii) ELISPOT.
The numbers of HBV core-specific CD8+ T cells producing IFN-γ after stimulation with HBV core18-27 peptide at baseline were similarly low in patients and controls, while at TW28 and FUW24, they were higher in responders than at baseline and in nonresponders (Fig. 3B). After stimulation with PHA, there was no difference between responders, nonresponders, and controls.
(iii) IFN-γ secretion assay.
At baseline, the proportions of unstimulated and peptide-stimulated HBV core18-27 pentamer+ CD8+ T cells producing IFN-γ were similar in patients and controls, while at TW28 and FUW24, they were higher in responders than at baseline and in nonresponders (Fig. 3C and D). After stimulation with staphylococcal enterotoxin B, HBV pentamer-specific IFN-γ production levels were similar in responders and nonresponders (data not shown; available upon request from the authors).
HBV core gene mutations in serum.
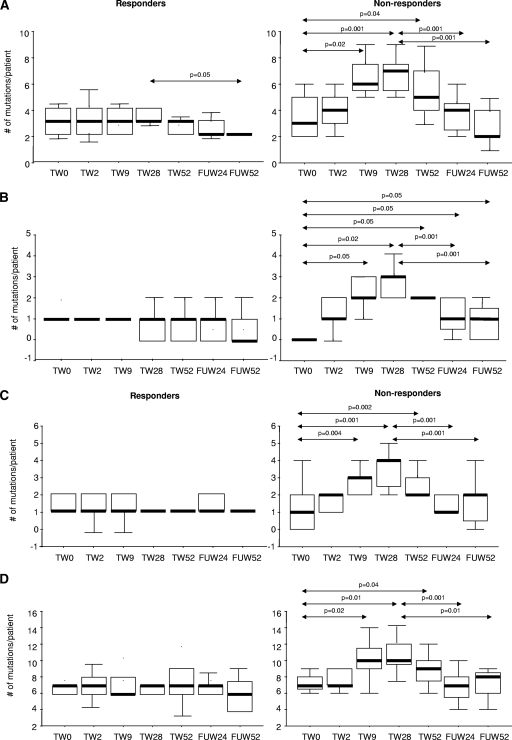
At baseline, the total numbers of synonymous and nonsynonymous mutations within total HBV core gene and universally recognized T helper (Th 1 to 20 and Th 50 to 69), CTL (CTL 18 to 27 and CTL 141 to 151), and B-cell (B 74 to 89, B 107 to 118, and B 130 to 138) immunodominant epitopes were similar in HBV-treated patients, whether responders or not, and untreated HBV controls. In treated patients at TW9, TW28, and TW52, the numbers of synonymous and nonsynonymous substitutions within full-gene, Th, CTL, and B-cell epitopes were higher in nonresponders than in responders (Tables 3 and 4 and Fig. 5 A to D). At FUW24 and FUW52, nonresponders had higher numbers of mutations in CTL epitopes than at baseline, while there was no difference between responders and nonresponders for full-gene, Th, and B-cell epitope mutations. In responders, the number of Th epitope mutations was lower at FUW52 than at TW28. In nonresponders, the numbers of mutations for Th, CTL, B-cell, and full-gene epitopes were lower at FUW24 and FUW52 than at TW28. The numbers of synonymous and nonsynonymous substitutions outside universally recognized immunodominant epitopes were similar in HBV-treated patients, whether responders or not, and untreated controls at all time points (Table 5). No significant changes in the numbers of HBV core gene mutations in full-gene, Th, CTL, and B-cell epitopes were observed in untreated controls. The ratio between synonymous and nonsynonymous mutations within universally recognized immunodominant epitopes increased during therapy in nonresponders (ratio, 1.86 at baseline versus 3.1 at TW28 and 1.86 posttherapy) and remained similar in responders during the course of therapy (ratio, 2 at TW0 versus 2 at TW28 and 1.85 during follow-up). The ratios between synonymous and nonsynonymous mutations within other epitopes were similar for responders and nonresponders at all time points of therapy.
TABLE 3.
Numbers of synonymous mutations (nucleotide substitutions) within the universally recognized immunodominant epitopes in responders and nonresponders
| Time | No. of mutationsa |
|||||||
|---|---|---|---|---|---|---|---|---|
| Th1-20 | Th50-69 | CTL18-27 | CTL141-151 | B74-89 | B107-118 | B130-138 | Total | |
| Nonresponders | ||||||||
| TW0 | 1 (0-4) | 2 (1-6) | 0 (0-1) | 0 (0-2) | 1 (0-4) | 2.5 (0-5) | 3 (0-4) | 13 (1-20) |
| TW9 | 4.5 (1-6) | 9 (0-12) | 2 (0-4) | 0.5 (0-5) | 6 (0-9) | 6.5 (0-7) | 3 (0-8) | 27 (2-37) |
| TW28 | 5 (1-7) | 9 (0-12) | 3 (0-5) | 0.5 (0-6) | 7 (0-8) | 6 (0-8) | 3 (0-8) | 31 (2-45) |
| TW52 | 3.5 (1-8) | 7.5 (0-12) | 3 (0-5) | 0.5 (0-5) | 7 (0-12) | 5 (0-7) | 3 (0-4) | 31 (2-38) |
| FUW24 | 2 (0-6) | 1 (1-3) | 0 (0-1) | 0 (0-1) | 1 (0-4) | 1.5 (0-4) | 2 (0-4) | 13 (4-17) |
| Responders | ||||||||
| TW0 | 1 (0-3) | 2 (1-5) | 0 (0-1) | 0 (0-1) | 1 (0-4) | 2.5 (0-5) | 3 (0-3) | 13 (1-16) |
| TW9 | 1 (0-2) | 1 (0-3) | 0 (0-1) | 0 (0-1) | 1.5 (0-3) | 2.5 (0-5) | 3 (0-3) | 13 (1-16) |
| TW28 | 2.5 (1-5) | 3 (1-11) | 1 (0-3) | 0 (0-1) | 2 (1-8) | 2 (0-4) | 3 (2-3) | 14 (3-32) |
| TW52 | 2.5 (1-5) | 3 (2-11) | 1 (0-3) | 0 (0-1) | 3 (1-4) | 2 (0-6) | 3 (2-3) | 14 (5-32) |
| FUW24 | 1.5 (1-2) | 1 (1-3) | 0 (0-2) | 0 (0-1) | 2 (1-4) | 1.5 (0-4) | 1 (0-2) | 12 (4-14) |
Results are expressed as median and range. B, B cell.
TABLE 4.
Numbers of nonsynonymous mutations (amino acid substitutions) within universally recognized immunodominant epitopes in responders and nonresponders.
| Time | No. of mutationsa |
|||||||
|---|---|---|---|---|---|---|---|---|
| Th1-20 | Th50-69 | CTL18-27 | CTL141-151 | B74-89 | B107-118 | B130-138 | Total | |
| Nonresponders | ||||||||
| TW0 | 2 (0-3) | 0.5 (0-1) | 1 (0-1) | 0 (0-1) | 1 (0-2) | 0 (0-1) | 0 (0-1) | 7 (4-8) |
| TW9 | 3.5 (1-6) | 2 (1-4) | 2 (0-4) | 0 (0-1) | 2.5 (0-5) | 0.5 (0-1) | 0.5 (0-1) | 10 (5-14) |
| TW28 | 4 (1-7) | 3 (0-5) | 2.5 (1-3) | 0.5 (0-1) | 3 (1-5) | 0.5 (0-1) | 0.5 (0-2) | 10 (6-15) |
| TW52 | 2.5 (1-6) | 1.5 (1-4) | 1.5 (1-3) | 0.5 (0-2) | 1.5 (0-4) | 0.5 (0-2) | 0.5 (0-1) | 9 (5-14) |
| FUW24 | 2 (0-3) | 1.5 (0-3) | 1 (0-2) | 0 (0-1) | 1 (0-3) | 0 (0-2) | 0 (0-2) | 7 (4-9) |
| Responders | ||||||||
| TW0 | 1.5 (1-2) | 1 (0-1) | 1 (0-1) | 0 (0-1) | 0 (0-1) | 1 (0-2) | 0 (0-1) | 6.5 (3-8) |
| TW9 | 2 (1-2) | 1 (0-1) | 1 (0-1) | 0 (0-1) | 1 (0-2) | 0 (0-1) | 0 (0-1) | 6 (5-7) |
| TW28 | 2 (2-3) | 1 (0-1) | 1 (0-1) | 0 (0-1) | 1 (1-2) | 0 (0-1) | 0.5 (0-1) | 7 (6-8) |
| TW52 | 2 (1-3) | 1 (0-1) | 1 (0-1) | 0 (0-1) | 1 (0-2) | 0 (0-1) | 0 (0-1) | 7 (4-8) |
| FUW24 | 1.5 (1-2) | 0.5 (0-13) | 1 (0-1) | 0 (0-1) | 1 (0-1) | 0 (0-1) | 0 (0-1) | 6.5 (5-7) |
Results are expressed as median and range. B, B cell.
FIG. 5.
Median numbers and interquartile ranges of mutations per patient for HBV core Th cells (A), CTL (B), B-cell immunodominant epitopes (C), and full gene (D). Horizontal black bars and error bars represent median and interquartile ranges, respectively.
TABLE 5.
Numbers of synonymous and nonsynonymous mutations within other than universally recognized immunodominant epitopes in responders and nonresponders before, during, and after therapy
| Time | No. of mutationsa |
|||
|---|---|---|---|---|
| Synonymous |
Nonsynonymous |
|||
| R | NR | R | NR | |
| TW0 | 5 (0-13) | 5 (0-14) | 2 (0-4) | 2 (0-4) |
| TW9 | 6 (1-13) | 6 (0-15) | 2 (0-4) | 2 (0-4) |
| TW28 | 6 (1-14) | 6 (1-15) | 2.5 (0-6) | 2.5 (1-5) |
| TW52 | 6 (0-14) | 6 (0-15) | 2 (0-5) | 2 (0-6) |
| FUW24 | 5.5 (1-13) | 6 (0-14) | 2 (0-6) | 2 (1-5) |
Results are expressed as median and range.
In addition, mutations in the HLA-A2-restricted CTL core18-27 epitope were evaluated in 9 HLA-A2+ treated patients. At baseline, serum and liver core18-27 epitope substitutions were present in the same proportion of responders (2/4) and nonresponders (2/5) among 9 HLA-A2+ patients. During treatment, serum core18-27 epitope substitutions were more common in nonresponders than in responders (TW28, 4 versus 2, P = 0.03; TW52, 5 versus 1, P = 0.001) but returned to baseline values in both during follow-up. HBVcore18-27 epitope mutations occurred in the following amino acid positions: codon 19 (L19S) in 3 patients (2 genotype B and 1 genotype D), codon 20 (S20A and S20T) in 2 patients (genotype A and genotype B), codon 22 (D22E) in 1 patient with genotype D, and codon 27 (V27I) in 2 patients (genotype A and genotype D).
There was no significant difference in the number of mutations within the HBV core18-27 epitope between HLA-A2-positive and HLA-A2-negative nonresponders at baseline (median, 1 versus 1) or during (TW28, median, 2 versus 2.5) and after (FUW24, median, 1 versus 1) therapy.
Serum HBV DNA in relation to antiviral treatment.
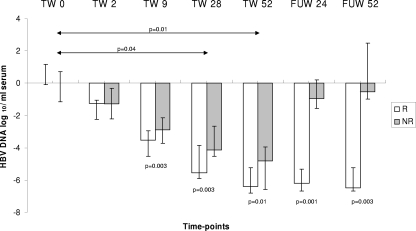
At baseline, HBV DNA serum levels (Fig. 6) were similar in treated and untreated HBV patients (8.82 [range, 7.8 to 9.67] versus 8.78 [range, 7.80 to 10.2] log10 copies/ml) and in responders and nonresponders (8.98 [range, 7.8 to 9.05] versus 8.94 [range, 7.9 to 9.67] log10 copies/ml). In treated patients, the HBV DNA viral load was lower at TW28 and at TW52 than at baseline. A difference in HBV DNA levels between responders and nonresponders became apparent from TW9 and persisted at TW28, TW52, FUW24, and FUW52. During follow-up, levels of HBV DNA returned to values similar to baseline in nonresponders while they remained below 4 log10 copies/ml in responders (FUW24, 2.79 [range, 2.1 to 3.71] log10 copies/ml and FUW52, 2.5 [range, 2.38 to 2.57] log10 copies/ml). The HBV DNA viral load did not change in untreated HBV patients monitored yearly for 2 years (baseline, 8.82 [range, 7.9 to 10.2]; year 1, 8.78 [range, 8.12 to 9.65]; year 2, 8.66 [range, 7.7 to 10.1] log10 copies/ml).
FIG. 6.
HBV DNA viral load during antiviral therapy. The error bars indicate interquartile ranges.
Liver tissue. (i) HBV core mutations.
At baseline, the numbers of HBV core gene mutations (total, Th, CTL, and B cell) in the liver were similar in HBV-treated patients, whether responders or not, and untreated HBV controls.
(ii) HBV DNA viral concentration.
The RC HBV DNA concentrations in pretreatment liver biopsy specimens were similar between treated and untreated patients (4.41 [range, 1.71 to 5.14] versus 4.22 [range, 2.2 to 5.2] log10 copies/ng of liver genomic DNA [lgDNA]). RC HBV DNA tended to be lower in responders than nonresponders (3.82 [range, 2 to 4.18] versus 4.71 [range, 2.78 to 5.32] log10 copies/ng of lgDNA; P = 0.16).
(iii) cccDNA concentration.
The tissue concentrations of cccDNA were similar in responders and nonresponders (2.26 [range, 0.57 to 3.56] versus 1.98 [range, 1.32 to 2.37] log10 copies/ng of lgDNA). There was no difference in cccDNA concentrations between untreated controls (1.68 [range, 0.76 to 3.49] log10 copies per ng of lgDNA) and treated patients (P = 0.5). Levels of liver RC HBV DNA and liver cccDNA were positively correlated (r = 0.67; P = 0.04).
(iv) Expression of HBcAg.
Hepatocyte nuclear and cytoplasmic expression levels of HBcAg were similar in treated patients, whether responders (median nuclear staining, 32.5%, and median cytoplasmic staining, 45%) or not (30% and 40%), and untreated HBV+ controls (30% and 45%). Levels of liver HBcAg expression (nuclear and cytoplasmic) were correlated with liver RC HBV DNA (r = 0.46; P = 0.05) and liver cccDNA (r = 0.49; P = 0.05).
Multivariate analysis.
Multivariate analysis confirmed the following differences between responders and nonresponders, irrespective of HLA-A2 positivity: total number and T helper mutations at TW9 (P = 0.003) and TW28 (P = 0.001); CTL- and B-cell epitope mutations at TW9 (P = 0.003 and P = 0.001), TW28 (P = 0.001 and P = 0.001), and TW52 (P = 0.001 and P = 0.001); HBV core peptide T-cell proliferative responses for peptide sets 1, 3, and 4 at TW28 (P = 0.003) and TW52 (P = 0.001); HBV core-specific pentamer+ CD8+ cells (P = 0.003 and P = 0.001) and those producing IFN-γ (ELISPOT) (P = 0.001 and P = 0.001) at TW28 and FUW24; and HBV DNA loads at TW52 (P = 0.003), FUW24 (P = 0.001), and FUW52 (P = 0.001).
Generalized estimating equations. (i) T-cell proliferation.
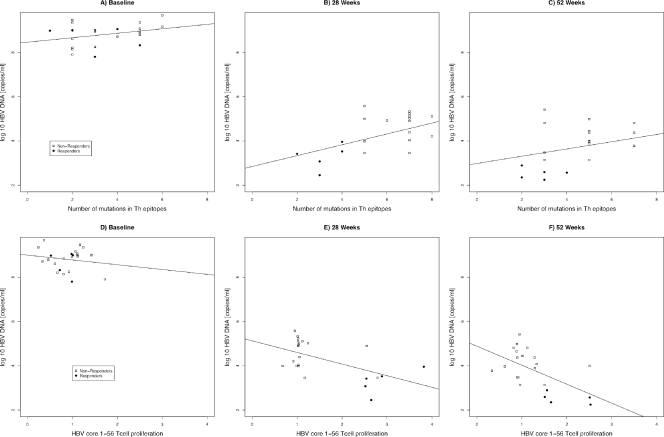
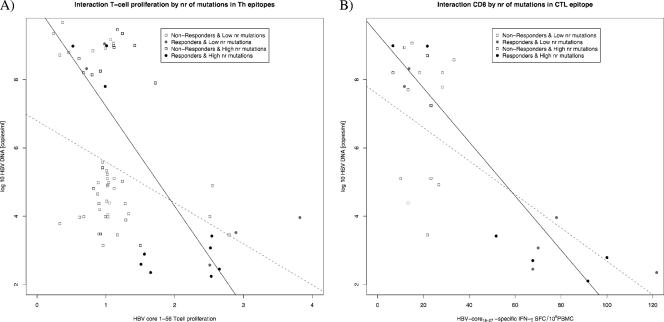
A model using the number of Th mutations and the time of measurement as predictors of the HBV DNA viral load confirmed a decrease in the viral load at TW28 (P < 0.05) and TW52 (P < 0.001) and showed an interaction between the number of mutations and the time of measurement (P < 0.05), with the positive association between the number of mutations and the viral load growing stronger at TW28 and TW52 than at baseline (Fig. 7 A to C). A model considering the effects of T-cell proliferative responses and time of measurement showed a marginally significant interaction between the two. A stronger negative association between the T-cell proliferative response and HBV DNA was observed at TW28 and TW52 than at baseline (Fig. 7D to F). A model evaluating the number of T helper mutations and T-cell proliferative responses over time showed a significant interaction when the viral load was used as a determinant of response (P < 0.05). The negative association between T-cell proliferative responses and the viral load was stronger in patients with a lower number of T helper epitope mutations (Fig. 8 A).
FIG. 7.
Scatter plots showing the association between T-helper epitope mutations (A to C) and T-cell proliferation (D to F) and HBV-DNA load (copies/ml) across time (at baseline, 28 weeks of treatment, and 52 weeks of treatment). Regression lines fitted across individual subjects at each time point are shown.
FIG. 8.
Interaction plots between T helper epitope mutations and T-cell proliferation (A) and between T cytotoxic epitope 18-27 mutations and HBV-specific CD8+ immune responses in relation to the HBV-DNA viral load (copies/ml) (B). The black dots, squares, and regression lines represent individuals with a number of mutations smaller than the mean at baseline, and those in gray represent individuals with a number of mutations higher than the mean at baseline. Data points are given for all individuals across all time points.
(ii) CD8.
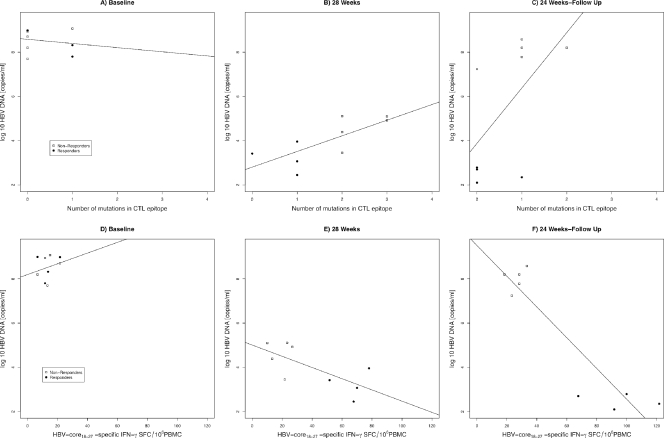
GEE analysis confirmed changes in the viral load over time and the association between viral kinetics and the number of CTL18-27 epitope mutations in 9 HLA-A2+ patients (Fig. 9 A to C). A model including the effects of CD8 responses on the viral load over time showed a significant interaction between CD8 responses and time of measurement in relation to the viral load (P < 0.01). The negative relationship between CD8 responses and the viral load reached its maximum at FUW24 (Fig. 9D to F). A model including the number of CTL18-27 epitope mutations and CD8 responses over time as predictors of the viral load showed an interaction between CD8 responses and the number of mutations (P < 0.001). The negative association between CD8 responses and the viral load was stronger for patients with a low number of CTL18-27 epitope mutations (Fig. 8B).
FIG. 9.
Scatter plots showing the association between T cytotoxic epitope 18-27 mutations (A to C) and HBV-specific CD8+ immune responses (D to F) and the HBV DNA load (copies/ml) across time (at baseline and 28 weeks of treatment and after 24 weeks of follow-up). Regression lines fitted across individual subjects at each time point are shown.
DISCUSSION
This unique longitudinal study characterizes HBV-host immune interaction from immune tolerance to viral control during antiviral treatment in children with high viral loads, normal biochemistry, and near-normal liver histology. Among these patients, infected in infancy and participating in a pilot treatment study with lamivudine followed by lamivudine and IFN-α, 5 of 23 achieved seroconversion to anti-HBs during treatment or follow-up (11).
Patients who achieved viral control were characterized by more vigorous HBV-specific T-cell proliferative and CD8 responses and by a lower number of mutations within universally recognized HBV core immunodominant epitopes, tested by direct sequencing, compared to nonresponders.
Before treatment, HBV-specific T-cell responses were similarly weak in responders and nonresponders and remained so during the 8-week lamivudine treatment, while HBV DNA decreased significantly in both. By week 9, the HBV DNA decrease was more pronounced in responders than nonresponders, reflecting in the latter a higher number of mutations in the immunodominant HBV core gene sequences investigated—encoding B-cell, T helper, and CD8 T-cell viral epitopes—and in the full gene. It is likely that this increased number of mutations during antiviral therapy reflects substitutions that predated treatment and became apparent with the reduction in the wild-type viral load. This possibility should be investigated in the future by cloning studies or pyrosequencing.
At TW28, 20 weeks after IFN-α was added to lamivudine, the differences in viral loads and numbers of mutations increased between responders and nonresponders, with a strong positive association between the viral load and the number of HBV core gene T helper mutations. At the same time point, while in nonresponders HBV-specific T-cell proliferative and CD8 reactivities were low, responders had developed a vigorous HBV-specific T-cell reaction with no increase in mutations, probably reflecting restoration of T-cell responses in parallel with reduction of viral loads. T cells from responders reacted with all sets of HBV core peptides tested in the proliferation assay, and this response was still detectable at TW52. In contrast, HBV-specific T-cell proliferation in nonresponders was directed against only one HBV core peptide set. This differential pattern of response was already clear in those patients tested at TW12 and TW16, with responders showing a gradual broadening and strengthening of the core-specific T-cell proliferation over time. A negative association was observed between the number of HBV core gene T helper mutations, the HBV DNA viral load, and the strength of HBV-specific T-cell proliferation during therapy, suggesting that viral changes may have a direct effect on virus-specific immunity. Defective HBV core-specific T-cell reactivity has been previously described in immunoactive and immunotolerant patients with CHB, though when compared directly, the T-cell immune response was significantly lower in immunotolerant patients (21). Restoration of the HBV-specific T helper immune response is associated with HBV DNA decline and HBeAg clearance following interferon or nucleoside/nucleotide analogue treatment in immunoactive adult patients with CHB (3, 4, 15, 19, 24, 33, 36). In our cohort, a strong HBV-specific T-cell response heralded progression from immunotolerance to complete viral control (anti-HBs seroconversion).
At TW28—and also at TW16 for patients tested—in parallel with what was observed for T-cell proliferation, the numbers of CD8 T cells detected by HBV core18-27 pentamer staining had increased from baseline and were higher in responders than in nonresponders, even when studied ex vivo, a pattern magnified by preincubation with HBV core18-27.
Responders' HBV core18-27-specific CD8 T cells also showed increased ability to secrete IFN-γ upon stimulation with peptide. Increased numbers of peptide-specific T cells and a further enhanced ability to produce IFN-γ were also detectable during follow-up (FUW24). A strong HBV-specific CD8 T-cell reactivity also characterizes treatment response in immunoactive adult patients (3, 4, 15, 24, 31). The appearance of effective HBV-specific CD8+ T-cell responses is likely to lead to viral control through elimination of virus-infected cells, as suggested by the inverse association between the number of HBV core18-27-specific CD8+ cells producing IFN-γ and the number of CTL18-27 epitope mutations at TW28 and FUW24, confirming that the emergence of mutations foils an effective antiviral immune response, as reported in immunoactive adults (36).
This longitudinal study allowed us to determine viral mutation dynamics during and after treatment and their relation to outcome. While in responders there was no increase in mutation numbers from baseline throughout the 2-year observation period, in nonresponders, the numbers of mutations increased significantly during treatment, following a similar pattern over time irrespective of the type of mutation investigated. An increase in the number of mutations within universally recognized HBV core immunodominant epitopes for T helper, T cytotoxic, and B lymphocytes was already detectable at TW2, while the patients were on lamivudine treatment alone, and became significant compared to the baseline, together with an increase in full HBV core gene mutations, at TW9. The numbers of all mutations investigated reached a peak at TW28, decreased during the last weeks of combined treatment, and returned to baseline levels during follow-up. No difference in HBV core gene mutation distributions before and after interferon treatment was reported in a small cohort of children with chronic HBV infection and biochemically active disease (6). Similarly, a minimal difference in the number of HBV core gene mutations was found in HBeAg+ immunoactive children, who cleared HBeAg spontaneously or after IFN-α therapy, compared to children with HBeAg persistence (23). Had we confined our investigation to pretreatment and posttreatment or postseroconversion samples, we would have obtained similar results. Whether immunoactive children behave like immunotolerant children during antiviral treatment remains to be established.
In immunoactive adults, IFN-α treatment alone accelerates the natural evolutionary mutation rate of HBV (9), with emergence of mutations within the immunodominant epitopes of HBV precore/core genes being more frequent in nonresponders and relapsers, akin to what was observed in our study, according to some authors (22), while others report increased numbers of mutations in association with anti-HBe seroconversion (16). The discrepancy is possibly due to patients being tested at different time points in relation to treatment.
At variance with adult immunoactive patients, where nonresponders have higher pretreatment cccDNA levels (35), in tolerant children, expression levels of HBcAg and amounts of RC HBV DNA and cccDNA in pretreatment liver biopsy specimens were similar in responders and nonresponders.
Baseline clinical, biochemical, histological, and virological indices did not differ between nonresponders and responders. The five patients who became HBsAg negative/anti-HBsAg positive had the HBV-favorable genotype A or B, and two who seroconverted to anti-HBe during follow-up had the less favorable genotype D (5). More sensitive assays are needed to ascertain if different HBV-specific immune repertoires at baseline can predict treatment outcome. Though during the initial stage of lamivudine treatment no significant difference between responders and nonresponders in HBV-specific T-cell proliferation was detected, there was a trend for it to increase early in responders concomitant with the decrease in the viral load. After introduction of IFN-α, an immunostimulatory cytokine, HBV-specific T-cell proliferation in responders was gradually magnified. Whether responders and nonresponders could be differentiated before treatment might be ascertained by determining CD4 and CD8 HBV-specific reactivity, not only in the circulation, but also in the liver. This should be investigated in larger combination treatment trials of tolerant patients, using pegylated IFN and more powerful new-generation nucleotide/nucleoside analogues that, by reducing HBV DNA more rapidly than lamivudine, prevent the emergence of mutations (38).
Acknowledgments
The study was supported by Wellcome Trust grant WT 055164MF and by WellChild UK.
Involvement of authors in the study was as follows: study concept and design, I.C., G.M.-V., and D.V.; acquisition of data, analysis and interpretation of data, statistical analysis, and manuscript drafting, I.C.; material and technical support, L.D., S.B., M.S.L., and Y.M.; obtaining funding and study supervision, G.M.-V.; statistical analysis, I.R.M. and D.V.
There were no conflicts of interest for any of the authors.
Footnotes
Published ahead of print on 8 December 2010.
REFERENCES
- 1.Alatrakchi, N., and M. J. Koziel. 2003. Antiviral T-cell responses and therapy in chronic hepatitis B. J. Hepatol. 39:361-364. [DOI] [PubMed] [Google Scholar]
- 2.Bertoletti, A., et al. 1991. HLA class I-restricted human cytotoxic T-cells recognize endogenously synthesized hepatitis B virus nucleocapsid antigen. Proc. Natl. Acad. Sci. U. S. A. 88:10445-10449. [DOI] [PMC free article] [PubMed] [Google Scholar]
- 3.Boni, C., et al. 1998. Lamivudine treatment can restore T-cell responsiveness in chronic hepatitis B. J. Clin. Invest. 102:968-975. [DOI] [PMC free article] [PubMed] [Google Scholar]
- 4.Boni, C., et al. 2001. Lamivudine treatment can overcome cytotoxic T-cell hyporesponsiveness in chronic hepatitis B: new perspectives for immune therapy. Hepatology 33:963-971. [DOI] [PubMed] [Google Scholar]
- 5.Buster, E. H., et al. 2009. Factors that predict response of patients with hepatitis B e antigen—positive chronic hepatitis B to peginterferon-alfa. Gastroenterology 137:2002-2006. [DOI] [PubMed] [Google Scholar]
- 6.Cabrerizo, M., J. Bartolomé, M. Otero, M. Ruiz-Moreno, and V. Carreño. 1999. Sequence variation of hepatitis B virus precore-core open reading frame isolated from serum and liver of children with chronic hepatitis B before and after interferon treatment. J. Med. Virol. 58:208-214. [PubMed] [Google Scholar]
- 7.Carman, W. F., et al. 1997. Hepatitis B virus core protein mutations are concentrated in B-cell epitopes in progressive disease and in T helper cell epitopes during clinical remission. J. Infect. Dis. 175:1093-1100. [DOI] [PubMed] [Google Scholar]
- 8.Chen, R. W., et al. 2001. Real-time PCR for detection and quantitation of hepatitis B virus DNA. J. Med. Virol. 65:250-256. [DOI] [PubMed] [Google Scholar]
- 9.Chen, R. Y., S. Bowden, P. V. Desmond, J. Dean, and S. A. Locarnini. 2003. Effect of interferon alpha therapy on the catalytic domains of the polymerase gene and basal core promoter, pre-core and core regions of hepatitis B virus. J. Gastroenterol. Hepatol. 18:630-637. [DOI] [PubMed] [Google Scholar]
- 10.Chromczynski, P. 1993. A reagent for the single-step simultaneous isolation of RNA, DNA and proteins from cell and tissue samples. Biotechnique 15:532-537. [PubMed] [Google Scholar]
- 11.D'Antiga, L., et al. 2006. Combined lamivudine/interferon-alpha treatment in ‘immuno-tolerant’ children perinatally infected by hepatitis B: a pilot study. J. Pediatr. 148:228-233. [DOI] [PubMed] [Google Scholar]
- 12.Ferrari C. 2003. Immunopathogenesis of hepatitis B. J. Hepatol. 39:S36-S42. [DOI] [PubMed] [Google Scholar]
- 13.Ganem, D., and A. M. Price. 2004. Hepatitis B virus infection—natural history and clinical consequences. N. Engl. J. Med. 50:1118-1129. [DOI] [PubMed] [Google Scholar]
- 14.He, M. L., et al. 2002. A new and sensitive method for the quantification of HBV cccDNA by real-time PCR. Biochem. Biophys. Res. Commun. 295:1102-1107. [DOI] [PubMed] [Google Scholar]
- 15.Lau, G. K., et al. 2007. Impact of viral kinetics on T-cell reactivity during antiviral therapy in chronic hepatitis B. Antivir. Ther. 12:705-718. [PubMed] [Google Scholar]
- 16.Lim, S. G., et al. 2007. Viral quasispecies evolution during hepatitis Be antigen seroconversion. Gastroenterology 133:951-958. [DOI] [PubMed] [Google Scholar]
- 17.Liu, Z., K. Luo, H. He, and J. Hou. 2005. Hot-spot mutations in hepatitis B virus core gene: eliciting or evading immune clearance? J. Viral Hepat. 12:146-153. [DOI] [PubMed] [Google Scholar]
- 18.Maini, M. K., et al. 2000. T cell receptor usage of virus-specific CD8 cells and recognition of viral mutations during acute and persistent hepatitis B virus infection. Eur. J. Immunol. 30:3067-3078. [DOI] [PubMed] [Google Scholar]
- 19.Maini, M. K., et al. 2000. The role of virus-specific CD8+ cells in liver damage and viral control during persistent hepatitis B virus infection. J. Exp. Med. 191:1269-1280. [DOI] [PMC free article] [PubMed] [Google Scholar]
- 20.Marinos, G., et al. 1995. Induction of T-helper cell response to hepatitis B core antigen in chronic hepatitis B: a major factor in activation of the host immune response to the hepatitis B virus. Hepatology 22:1040-1049. [DOI] [PubMed] [Google Scholar]
- 21.Marinos, G., N. V. Naoumov, and R. Williams. 1996. Impact of complete inhibition of viral replication on the cellular immune response in chronic hepatitis B virus infection. Hepatology 24:991-995. [DOI] [PubMed] [Google Scholar]
- 22.Naoumov, N. V., et al. 1995. Genomic variants in the hepatitis B core gene: a possible factor influencing response to interferon alpha treatment. Gastroenterology 108:505-514. [DOI] [PubMed] [Google Scholar]
- 23.Ni, Y. H., M. H. Chang, H. Y. Hsu, and H. L. Chen. 2000. Long-term follow-up study of core gene deletion mutants in children with chronic hepatitis B virus infection. Hepatology 32:124-128. [DOI] [PubMed] [Google Scholar]
- 24.Pontesilli, O., et al. 2004. Hepatitis B virus-specific T-cell response in chronic hepatitis B patients treated with lamivudine and interferon-α. Liver Int. 24:308-315. [DOI] [PubMed] [Google Scholar]
- 25.Radecke K., U. Protzer, M. Trippler, K. H. Meyer Zum Büschenfelde, and G. Gerken. 2000. Selection of hepatitis B virus variants with amino acid substitutions inside the core antigen during Interferon-α therapy. J. Med. Virol. 62:479-486. [DOI] [PubMed] [Google Scholar]
- 26.Rehermann, B., S. M. Pasquinelli, F. V. Mosier, and F. V. Chisari. 1995. Hepatitis B virus (HBV) sequence variation of cytotoxic T lymphocyte epitopes is not common in patients with chronic HBV infection. J. Clin. Invest. 96:1527-1534. [DOI] [PMC free article] [PubMed] [Google Scholar]
- 27.Rehermann, B., D. Lau, J. H. Hoofnagle, and F. V. Chisari. 1996. Cytotoxic T lymphocyte responsiveness after resolution of chronic hepatitis B virus infection. J. Clin. Invest. 97:1655-1665. [DOI] [PMC free article] [PubMed] [Google Scholar]
- 28.Rehermann, B., C. Ferrari, C. Pasquinelli, and F. V. Chisari. 1996. The hepatitis B virus persists for decades after patients' recovery from acute viral hepatitis despite active maintenance of a cytotoxic T-lymphocyte response. Nat. Med. 2:1104-1108. [DOI] [PubMed] [Google Scholar]
- 29.Rehermann, B., and N. Nascimbeni. 2005. Immunology of hepatitis B and hepatitis C infection. Nat. Rev. Immunol. 5:215-229. [DOI] [PubMed] [Google Scholar]
- 30.Rehermann, B., and N. V. Naoumov. 2007. Immunological techniques in viral hepatitis. J. Hepatol. 46:508-520. [DOI] [PubMed] [Google Scholar]
- 31.Rigopoulou, E. I., et al. 2005. Lamivudine plus interleukin-12 combination therapy in chronic hepatitis B: antiviral and immunological activity. Hepatology 42:1028-1036. [DOI] [PubMed] [Google Scholar]
- 32.Schepis, F., et al. 1997. Outcome of liver disease and response to interferon treatment are not influenced by hepatitis B virus core gene variability in children with chronic type B hepatitis. J. Hepatol. 24:776-780. [DOI] [PubMed] [Google Scholar]
- 33.Torre, F., et al. 2004. Direct evidence that naturally occurring mutations within hepatitis B core epitopes alter CD4+ T-cell reactivity. J. Med. Virol. 72:370-376. [DOI] [PubMed] [Google Scholar]
- 34.Webster, G. J., et al. 2004. Longitudinal analysis of CD8+ T cells specific for structural and nonstructural hepatitis B virus proteins in patients with chronic hepatitis B: implications for immunotherapy. J. Virol. 78:5707-5719. [DOI] [PMC free article] [PubMed] [Google Scholar]
- 35.Werle-Lapostolle, B., et al. 2004. Persistence of cccDNA during the natural history of chronic hepatitis B and decline during adefovir dipivoxil therapy. Gastroenterology 126:1750-1758. [DOI] [PubMed] [Google Scholar]
- 36.Whalley, S. A., et al. 2004. Evolution of hepatitis B virus during primary infection in humans: transient generation of cytotoxic T-cell mutants. Gastroenterology 127:1131-1138. [DOI] [PubMed] [Google Scholar]
- 37.Yim, H. J., and A. S. Lok. 2006. Natural history of chronic hepatitis B infection: what we knew in 1981 and what we know in 2005. Hepatology 43:S173-S181. [DOI] [PubMed] [Google Scholar]
- 38.Zoulim, F., and S. Locarnini. 2009. Hepatitis B virus resistance to nucleos(t)ide analogues. Gastroenterology 137:1593-1608. [DOI] [PubMed] [Google Scholar]


