

Abstract
The genome of maize (Zea mays ssp. mays) consists mostly of transposable elements (TEs) and varies in size among lines. This variation extends to other species in the genus Zea: although maize and Zea luxurians diverged only ∼140,000 years ago, their genomes differ in size by ∼50%. We used paired-end Illumina sequencing to evaluate the potential contribution of TEs to the genome size difference between these two species. We aligned the reads both to a filtered gene set and to an exemplar database of unique repeats representing 1,514 TE families; ∼85% of reads mapped against TE repeats in both species. The relative contribution of TE families to the B73 genome was highly correlated with previous estimates, suggesting that reliable estimates of TE content can be obtained from short high-throughput sequencing reads, even at low coverage. Because we used paired-end reads, we could assess whether a TE was near a gene by determining if one paired read mapped to a TE and the second read mapped to a gene. Using this method, Class 2 DNA elements were found significantly more often in genic regions than Class 1 RNA elements, but Class 1 elements were found more often near other TEs. Overall, we found that both Class 1 and 2 TE families account for ∼70% of the genome size difference between B73 and luxurians. Interestingly, the relative abundance of TE families was conserved between species (r = 0.97), suggesting genome-wide control of TE content rather than family-specific effects.
Keywords: maize, transposable elements, genome size, effective population size
Introduction
The completion of plant genome sequences has marked a decisive turn in our understanding of angiosperm genome content. These sequences confirm that transposable elements (TEs) are the major genomic component of most plant species, and they have facilitated important observations about TE evolution. First, TE families proliferate episodically and at different rates. As a result, closely related lineages may diverge rapidly in both TE content and genome size, as exemplified in both Oryza and Gossypium (Hawkins et al. 2006; Piegu et al. 2006). Second, within species, proliferation is counteracted by TE removal via recombination and population processes driven by natural selection (reviewed in Tenaillon et al. (2010)). The opposing forces of proliferation and removal create the potential for rapid turnover of TEs and extensive within-species variation. These forces are also intimately linked to local genomic composition (i.e., gene content, nucleotide composition, methylation status, and recombination rate), thus generating heterogeneity in TE types across genomic regions.
TEs were first discovered in maize (McClintock 1950) and TEs may still be best characterized in this species, particularly after the recent publication of a TE database containing exemplar sequences of 1,526 TE families and subfamilies (Schnable et al. 2009). Overall, TEs constitute over 85% of the maize reference (B73) genome (Schnable et al. 2009), of which the 20 most common TE families comprise ∼70% (Baucom et al. 2009). These 20 “common” families are all members of the Class 1 long terminal repeat (LTR)–retrotransposons, such as the Gypsy and Copia superfamilies. In the genus Zea, amplification of LTR-retrotransposons has been particularly dramatic during the last 3 million years, leading to a doubling of genome size (SanMiguel et al. 1998; Brunner et al. 2005). Class 2 Miniature Inverted Repeat Elements (MITEs) are also abundant in maize (Tikhonov et al. 1999; Fu et al. 2001; Wei et al. 2009), with some families represented by thousands of copies (Zhang et al. 2000, 2001). Due to their small size (<500 bp), however, MITEs occupy much less of the genome than LTR-retrotransposons.
In addition to varying in copy numbers, individual TE superfamilies occupy different genomic niches. MITEs, Helitrons, CACTAs, and MULEs tend to insert preferentially in genic regions (Bureau and Wessler 1992; Bureau et al. 1996; Naito et al. 2006; Wei et al. 2009; Zerjal et al. 2009); Mu elements exhibit insertional preferences in the 5′-ends of genes, correlating with epigenetic marks (Liu et al. 2009); and high-copy-number retroelement families seem to preferentially target non-genic hypermethylated regions, where they nest into each other (Wei et al. 2009; Zerjal et al. 2009). Exceptions to these general rules do exist, however. For example, several papers report the presence of MITEs in non-genic regions, and retrotransposons commonly capture gene fragments (Baucom et al. 2009; Wei et al. 2009), suggesting they do occasionally insert into hypomethylated gene-rich regions.
TEs also facilitate structural variation within species, either through polymorphic TE insertions and deletions or by mediating ectopic recombination events. Comparing a region spanning 2.8 Mb between two maize inbred lines, Brunner et al. (2005) found that, on average, more than 50% of the genomic sequence was not collinear. A similar result was obtained by comparing 8 haplotypes in the bz region from several maize accessions (Wang and Dooner 2006). This structural variation may also be responsible, in part, for pronounced differences in DNA content among maize accessions. Maize genome sizes range from 4.92 to 6.87 pg/2C (Poggio et al. 1998), a ∼1.5-fold size variation. However, TEs are clearly not the only genomic component responsible for substantial genome size variation within species, as DNA content also correlates with the number and size of heterochromatic knobs (Laurie and Bennett 1985). These knobs are regions of heterochromatin comprised of 180-bp tandem-repeats (Peacock et al. 1981), 350-bp tandem-repeats (Ananiev et al. 1998), and various retrotransposons. They may account for as much as 8% of the genome (Peacock et al. 1981; Ananiev et al. 1998) but vary greatly in number, size, and genomic location across maize and its relatives (Brown 1949; Xiong et al. 2005; Lamb et al. 2007; Albert et al. 2010).
Maize is a member of the genus Zea, which is traditionally divided into two sections: Luxuriantes and Zea. The former encompasses several species, including the annual diploid Zea luxurians (hereafter luxurians), whereas the latter consists solely of the annual diploid maize (Z. mays ssp. mays) and its closest wild relatives (ssp. parviglumis and ssp. mexicana; hereafter parviglumis and mexicana). Divergence between parviglumis and maize is very recent, dating to domestication about 9,000 BP (Matsuoka et al. 2002). In contrast, Z. mays sensu lato and luxurians diverged ∼140,000 years ago (Hanson et al. 1996; Ross-Ibarra et al. 2009), and the genomes of luxurians and maize differ in size (Poggio et al. 1998). To investigate the nature of this difference in genome size, Meyers et al. (2001) assessed the abundance of 6 retroelements in both species but found little evidence of variation in copy number between species. In contrast, knob repeats seemed to be more numerous in luxurians than in maize (Meyers et al. 2001).
High throughput, “next generation” sequencing offers a unique opportunity for whole-genome analysis via either de novo assemblies or mapping to a reference genome. These approaches have also proven useful for assessing structural variation in species such as Drosophila melanogaster (Cridland and Thornton 2010). However, the complexity of plant genomes and the extent of their repetitive fraction will likely render these tasks much more challenging than in simpler eukaryotic genomes. The genomic complexity and fluidity of Zea makes it an excellent model system for addressing evolutionary dynamics of TEs within and between species. Here, we use paired-end Illumina sequencing to evaluate genome content in maize and luxurians, with several main goals. First, we compare our inferences with Illumina data to the maize B73 reference genome, to determine whether our short read sequencing approach yields reasonable estimates of copy number. Second, we assess the sampling required with Illumina sequencing to gain robust estimates of TE content. Third, we investigate insertion biases of TE families near genes versus those nested into other TEs. Finally, we evaluate the difference in TE content between the maize B73 genome and an accession of luxurians.
Materials and Methods
Illumina Sequencing and Genome Size Determination
Genomic DNA of the maize reference accession B73 and luxurians accession PI441933 was extracted from lyophilized leaf tissue following a modified hexadecyltrimethylammonium bromide protocol (Saghai-Maroof et al. 1984). Ten micrograms of genomic DNA was sent for library construction and paired-end sequencing at the UC Davis Genome Center. The paired-end libraries produced pairs of sequences from opposite ends of fragments averaging ∼220 bp in length. Each sample was sequenced on a single lane of a flow cell with an Illumina Genome Analyzer II, generating paired-end reads of 84 bp and 104 bp. Data are archived at NCBI Sequence Read Archive (SRA) under accession SRP004910.
In addition to these data, we analyzed three previously published data sets of 36-bp Illumina sequencing from B73 (Gore et al. 2009). Briefly, Gore et al. (2009) isolated genomic DNA from B73 to construct 3 types of libraries enriched for the genic low-copy fraction of the genome: the MS-HpaII data set was constructed with the use of the methylation-sensitive digestion enzyme, HpaII; the MI-HpaII data set used HpaII after a whole-genome amplification step designed to generate unmethylated DNA; and the BbvI data set, generated with the restriction enzyme BbvI, whose restriction sites are distributed at a high frequency in low-copy regions of the genome.
The genome sizes of maize and luxurians were measured by flow cytometry. Samples were sent to Plant Cytometry Services (Schijndel). Buxus sempervirens (2C = 1.62 pg) was used as an internal standard. Measurements were made on 3 biological replicates per species.
Filtered Gene Set and the Unique Transposable Element Database
We downloaded the filtered gene set (FGS) from the RefGen_v1 (Release 4a.53) of the maize genome sequence (Schnable et al. 2009). The FGS is a set of evidence-based genes predicted by Gramene GeneBuilder and complemented by a set of Fgenesh models that were filtered for pseudogenes, TE-encoded genes and low-confidence hypothetical models. The FGS contains 32,540 genes.
We also downloaded an updated version of the maize TE database (Baucom et al. 2009; Schnable et al. 2009) in August 2010. This database consisted of 1,526 elements which are primarily full-sequence, curated elements belonging to both Class 1 (retrotransposons) and Class 2 (DNA transposons), classified according to Wicker et al. (2007). Elements from class 1 included 579 LTR-retrotransposons (154 Copia, 244 Gypsy, 181 unknown), 32 LINEs (30 L1 and 2 RTE), and 6 SINEs (tRNA). Class 2 included 892 TIR elements (387 hAT, 126 CACTA, 182 PIF/Harbinger, 138 Mutator, 59 Tc1/Mariner) and 16 Helitrons. One element was unclassified.
From the exemplar database, we built a TE database containing the unique portion(s) of each element (called hereafter the unique TE database—UTE). To build the UTE, we first cut each element of the exemplar TE database into 104-bp fragments that were then mapped against the exemplar TE database using SSAHA2 version 0.1 (Ning et al. 2001) with 80% homology, the default parameters (−kmer 13 −skip 1 −score 12 −cmatch 9 −ckmer 6) and requiring alignment lengths of at least 30 bp. Mapping results were used to determine the per base pair coverage of all 1,526 elements by the other elements contained in the exemplar TE database. This procedure allowed us to restrict the initial database to the portion(s) of TEs that were not covered by any other elements of the exemplar database under our mapping criteria. Note that the UTE was not filtered against portions of TEs that are repeated within an element, such as LTRs of LTR-retrotransposons. Ultimately, the UTE consisted of 83% of the original exemplar database, with 1,514 elements represented for read mapping (see Results).
Read Mapping
Eight read data sets were mapped: our 104-bp and 84-bp reads from B73 and luxurians (hereafter, B73–104, LUX-104, B73–84, LUX-84), the MS-HpaII, MI-HpaII, BbvI reads from Gore et al. (2009), and a data set of 19 million 100-bp reads generated in silico by randomly sampling sequence from the reference B73 genome (RefGen_v1, including the unassembled chromosome 0). Hereafter, we refer to these reads as the “in silico data set.”
We used SSAHA2 version 0.1 (Ning et al. 2001) to map reads against the 1,514 elements of the UTE with 80% homology, the default parameters (−kmer 13 −skip 1 −score 12 −cmatch 9 −ckmer 6) and the option best. The option best ensures that only the best mapping for each read is reported; when multiple best mappings are found they are all reported. From the SSAHA2 output files, we filtered for alignments ≥ 30 bp. Reads aligning to a TE under these criteria were counted as single hit to the TE. When multiple best-mapping reads were found for a single TE, we counted them as a single hit for that TE and discarded all reads that mapped to multiple TEs with the same score.
Reads were also mapped against the FGS following the above methodology but using a 90% homology criterion. For each data set, we recorded the total number of TE hits, gene hits, and unmapped reads. Because the FGS may have not been filtered completely for the presence of TE-derived sequence (Bennetzen et al. 2004; Wei et al. 2009), but the TE database has been curated manually (Baucom et al. 2009), we considered reads mapping to both a TE and a member of the FGS as TEs rather than genes. We used median values of the distribution of per-bp coverage from mapping of B73–104, LUX-104, B73–84, LUX-84 against each gene in the FGS to determine the genomic coverage of our Illumina data for B73 and luxurians.
Data Analysis
From the mapping against the UTE, we obtained the number of hits across 1,514 TE families for all data sets. Following previous work (Mortazavi et al. 2008), we corrected for differences in the number of reads per library and the length of the reference sequence by calculating Reads Per Kilobase per Million mapped (RPKM) for each ith TE family:
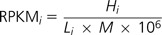 |
where M is the total number of reads mapped against TEs in each sequencing run, Hi is the number of reads mapping to the ith family, and Li is the length in kilobase of the ith family.
To characterize the TE families that exhibited the most marked differences of abundance between the two species, we calculated the log scale difference in TE hits (normalized by the coverage in each species) across 1,514 families and ranked the families accordingly. We added a pseudocount of 1.0 to the 22 families with 0 counts in either B73 or luxurians because the log of zero counts is undefined. We subsequently counted the number of Class 1 or Class 2 elements in the 5% of families with the greatest differences in abundance (e.g., 2.5% in each tail). We applied a Fisher's exact test to this 2 × 2 contingency table to assess whether one class of TE contributes primarily to genome size difference between the two species (two-sided test).
The same rationale was employed for comparing TE families inserted in genic and TE-nested regions within each species. First, we separated the Illumina reads into two categories: those for which one read from a pair mapped to a gene contained in the FGS and the other to a TE contained in the UTE; and those for which both paired-end reads mapped to different TEs. Second, for each of these two categories, we determined the relative abundance of TE families (number of hits). We then applied the previously described comparison between classes both to the 5% of families with the most extreme difference in abundance and to all positive and negative values of the distribution respectively to verify this trend on a broader scale.
Results
We sequenced one lane each of the maize inbred line B73 and a luxurians accession using the Illumina platform. Each lane generated paired-end fragments of 104 bp and 84 bp for a total of 18,689,556 paired-end reads for B73 and 19,942,282 paired-end reads for luxurians.
Read Mapping to a Unique Transposable Element Database and a Filtered Gene Set
As a first step toward mapping our Illumina data to maize TEs, we used an updated version of the maize TE database (Schnable et al. 2009) to build a UTE containing only the unique portion(s) of each TE element relative all other elements of the database (see Materials and Methods). The UTE contained 1,514 exemplar elements, representing 83% of the sequence information of the initial database; seven of the original elements (1 hAT, 1 CACTA, 3 PIF/Harbinger, 1 Mutator, and 1 Tc1/Mariner) contained no unique sequence, and five others contained too little unique sequence for subsequent mapping. The length of the remaining 1,514 elements varied from 35 to 17,890 bp with an average of 3,205 bp and a median value of 2,453 bp. Approximately 75% of the elements in the UTE consist of a single sequence, whereas the remainder consist of multiple noncontiguous fragments (mean fragment number = 2.77).
We subsequently mapped reads from each of our data sets to the UTE using a 80% homology criterion generally accepted as the level of similarity of reads within a single TE family (Wicker et al. 2007) and to the FGS with a more stringent criterion of 90% homology (see Materials and Methods). Table 1 provides mapping results, including the percentage of mapped and unmapped reads and the total number of reads mapping against the FGS and the UTE. As expected, the percentage of all reads from the in silico data set that mapped to the B73 reference genome (85.1%) was higher than for the B73–104 or B73–84 data sets (76.4%). However, the opposite trend was observed for the percentage of TE hits; 79.8% of mapped reads from the in silico data hit TEs, but an average of 84.6% of mapped reads from our B73–104 and B73–84 data hit TEs. Excluding four highly unusual families poorly represented in the reference genome (see below), however, the percentage of our B73 reads mapping to the UTE drops to 76.9%. Finally, the 36-bp Illumina data designed to represent a reduced representation of the heterochromatin (Gore et al. 2009) clearly achieved that purpose, with 74.9% and 85.9% of hits mapping to genes (Table 1.). These comparisons indicate that our paired-sequences successfully capture a representative sample of non-genic regions.
Table 1.
Counts of the Mapping Results against the UTE and the FGS for Paired-End Illumina Reads for B73 and luxurians, 3 Data Sets of 36-bp Illumina Reads from Low-Copy-Enriched B73 Libraries, and the B73 In Silico 100-bp Reads
| B73–104 | B73–84 | LUX-104 | LUX-84 | MS-HpaII | MI-HpaII | BbvI | In Silico Data | |
| #Reads | 18,689,556 | 18,689,556 | 19,942,282 | 19,942,282 | 3,814,762 | 3,130,565 | 5,066,369 | 18,598,686 |
| #UTE hits | 12,503,392 | 11,664,486 | 13,281,920 | 12,399,664 | 254,471 | 1,029,319 | 639,215 | 12,642,456 |
| #FGS hits | 2,101,030 | 2,290,718 | 2,113,671 | 2,347,419 | 1,544,034 | 629,885 | 1,905,067 | 3,190,485 |
| #Unmapped | 4,085,134 | 4,734,352 | 4,546,691 | 5,195,199 | 2,016,257 | 1,471,361 | 2,522,087 | 2,765,745 |
| % Mapped | 78.1 | 74.7 | 77.2 | 73.9 | 47.1 | 53.0 | 50.2 | 85.1 |
| % UTE | 85.6 | 83.6 | 86.3 | 84.1 | 14.1 | 62.0 | 25.1 | 79.8 |
| % FGS | 14.4 | 16.4 | 13.7 | 15.9 | 85.9 | 38.0 | 74.9 | 20.2 |
Comparing Estimates of B73 Transposable Element Content across Families
To examine how well our Illumina libraries capture variation in TE content, we determined the number of hits across the 1,514 TE families in our B73 data sets. Estimates were highly correlated between the B73–104 and B73–84 data (r > 0.99). Among 1,514 TE families, 15 exhibited no hits in our B73 data, which likely results both from the short length of these elements in the UTE (from 45 to 383 bp) and from the fact that they were cut into multiple unique portions (up to 4). We compared our observed number of TE hits across families to estimates from the B73 reference genome in two ways. First, we relied on a detailed analysis of the 20 most common TE families (Baucom et al. 2009), all of which are LTR-retrotransposons and together constitute ∼70% of the reference genome. These families represent 68.4% of all mapped reads in our B73 data set and ∼81% of the reads that mapped against the UTE. Two estimates were available for these families in the B73 reference genome: the number of Mb they occupy, and their copy number as determined by a homology search. We correlated both to the observed number of hits in B73 based on either B73–104 or B73–84 sequencing runs. We found an extremely high correlation with the number of Mb (r = 0.96 with either B73–104 or B73–84) and a lower correlation (r = 0.68 with either B73–104 or B73–84) with copy number, suggesting that mapping of short sequence reads reliably estimates genome space but less accurately predicts copy number.
Second, we correlated RPKM values estimated from B73–104 for all 1,514 families contained in the UTE to those obtained from the in silico data. The correlation across 1,514 families was low (0.25) but due predominantly to 5 families that exhibited more than an order of magnitude higher RPKM in our data compared with the in silico data set. After discarding these five families, RPKM values from our sequencing reads corresponded closely (r = 0.96) to the in silico data (fig. 1A). Qualitatively similar results were seen in the B73–84 reads (data not shown).
FIG. 1.—

Correlation of RPKM between (A) 1,509 TE families estimated from B73–104 and the in silico data with 5 outliers indicated in gray; (B) 1,514 TE families estimated from B73 and luxurians. Values are shown on a log scale, with a pseudocount of 1 added to families with 0 counts.
The five outlier families (RLX_osed_AC191084-2931, RLX_sela_AC195130-4415, RLX_teki_AC202867-7492, RLX_sari_AC184117-11, RLX_eguh_AC188982-71) are all described as unknown LTR-retrotransposons in the TE exemplar database. One of these is very low-copy number, with an RPKM of ∼6 in our data and only a single hit to the in silico data. For the remaining four, RPKM ranged from 2,353 to 34,995; read coverage across each of these elements is shown in figure 2. For RLX_teki_AC202867-7492 (fig. 2C), the difference in coverage between the in silico data and B73–104 was fairly constant along the sequence, suggesting there may be real differences in copy number for the complete element. However, the three other elements exhibited heterogeneity along the length of the TE. For example, 44% of RLX_sela_AC195130-4415 exhibited >10-fold coverage difference between our paired-end data and the in silico data, but three regions of 41–69 bp in length, representing only 11% of the TE length, demonstrated >50-fold coverage difference (fig. 2B). This pattern suggests that a few small portions of these elements are responsible for the dramatic differences we observe between our sequence and the in silico data.
FIG. 2.—

Log scale coverage along the unique sequence length of four of the five outlier TE families. Shown is RPKM of B73 (black lines) and in silico data (gray lines). (A) RLX_osed_AC191084-2931, (B) RLX_sela_AC195130-4415, (C) RLX_teki_AC202867-7492, and (D) RLX_sari_AC184117-11.
Altogether, our results indicated that: 1) TEs represent ∼85% of the B73 genome, as estimated previously, 2) we can reliably estimate the relative abundance of TE families and their contribution to the maize genome using our Illumina data and the UTE, but 3) five unknown LTR-retrotransposon families many more hits than expected based on the reference genome, with some TE portions exhibiting a much higher difference in coverage than others.
Comparing TE Content between Maize and luxurians
Flow cytometry analysis revealed a ∼1.5-fold difference in genome size between B73 (mean 5.96 pg/2C) and luxurians (mean 9.07 pg/2C). The B73 maize estimate is higher than previous estimates (Rayburn et al. 1993), but the luxurians estimate is within the range of previously described values (Poggio et al. 1998). Considering an estimate of ∼978 Mb/pg (Zonneveld et al. 2005), our size estimates convert into 2,914 Mb/C for B73 and 4,435 Mb/C for luxurians.
We used the mapping of B73–104, LUX-104, B73–84, and LUX-84 against the 32,540 genes contained in the FGS to determine the genomic coverage of our Illumina sequencing. Assuming gene content is similar between the two species, we estimate a mean coverage of 1.33 reads/bp for B73 genes and 1.05 reads/bp for luxurians genes from the combined paired-read data. We then estimated RPKM across the 1,514 UTE families in our luxurians data sets (LUX-104 and LUX-84). Results were similar to those obtained in B73: a majority (∼76%) of reads mapped, with ∼85% of mapped reads mapping to the UTE. Using the same 80% homology criterion, ∼15% of unmapped reads of both luxurians and B73 mapped to a set of knob sequences identified by blast (data not shown).
We compared TE content between B73 and luxurians in two ways. First, we compared the total TE content between B73 and luxurians. To do so, we normalized the total number of TE hits within each species by the coverage estimated from the FGS; the ratio of these values suggests that total TE content in luxurians is 1.35-fold higher than in B73, thereby explaining a large part of the 1.52-fold difference in genome size estimated by flow cytometry. Second, we assessed congruence in the relative abundance of TE families between species by comparing log RPKM values across the 1,514 TE families. Although total TE content differed markedly between species, we found a very strong correlation (r = 0.97; fig. 1B) in RPKM, suggesting that the relative abundance of individual families is fairly similar. Consistent with this, the distribution of the log scale difference in TE hits (B73—luxurians) across 1,514 families (fig. 3A) is relatively flat but skewed toward negative values with more than 70% of families showing a greater number of hits in luxurians than in B73. We analyzed the 2.5% most extreme values on each side of the distribution and found no significant difference between the number of Class 1 and 2 elements (P value = 0.64).
FIG. 3.—

Sorted log difference in number of TE hits normalized by coverage between (A) B73 and luxurians, where negative values indicate an excess of TE hits in luxurians; (B) the genic and nested TE regions in B73 (black dots) and luxurians (gray dots), where negative values indicate an excess of TE hits in TE-nested regions. Dashed lines indicate zero difference.
Comparing TE Content between Genic and TE-Nested Regions
Our paired-end sequences provided a unique opportunity to estimate TE content in genic regions because paired ends for which one read maps to a gene and the other to a TE indicate proximity between a gene and a TE. We could also measure the extent to which TEs inserted in or near other TEs by assessing read pairs that map to two different TEs. Considering only these two categories, we found 5.44- and 5.20-fold more reads in the latter category (TE-nested pairs) than in the former (TE-gene pairs) for B73 and luxurians, respectively. Hence, the distribution of the log scale difference in TE hits between those two categories across 1,514 families (fig. 3B) was skewed toward negative values, indicating that a majority of TE families tend to either insert or be preferentially retained in TE-nested regions as opposed to genic regions. We again analyzed the 2.5% most extreme values on each side of the distribution and found that Class 2 DNA elements were far more numerous in genic regions than in nested-TE regions (P value = 5.8 × 10⁻⁵ and 7.2 × 10⁻⁵ for B73 and luxurians, respectively). This trend for Class 1 and Class 2 TEs was confirmed when considering all TE families (P value < 10−8).
Effect of Subsampling on the Reliability of TE Content Estimates
Although our results strongly suggest that Illumina data provide reliable insights into TE content, it is not clear whether smaller samples might be equally reliable. To address this issue, we subsampled our data by randomly selecting 1/4, 1/6, 1/8, 1/10, and 1/12 of the reads from the B73–104 and LUX-104 sequencing runs, corresponding to samples ranging from ∼5 to ∼1.5 million reads. For each subsample, we correlated TE abundance to results from the full data sets. All correlations were high even when discarding the 20 most common families (r > 0.999). Thus subsampling did not strongly affect estimates of relative abundances across families. Not surprisingly, however, the number of TE hits per family diminishes with reduced sample and the number of families with no TE hits increases. For example, 5.4% of the 1,514 TE families were not detected in the smallest subsample of B73–104, whereas only 1.1% escaped detection in the full data set.
Discussion
We used paired-end Illumina sequencing to evaluate TE content in the maize inbred line B73 and Z. luxurians, a wild relative. We also measured DNA content of both taxa by flow cytometry and determined that the luxurians genome was ∼1.5-fold larger than that of B73. Our study had two main objectives. First, we developed a method to estimate TE content reliably using short high-throughput sequencing reads. Second, we investigated the factors contributing to genome size difference between maize and luxurians by focusing on TE content.
Reliability of Illumina Sequencing to Estimate TE Content
We generated ∼19 and ∼20 million paired-end reads for B73 and luxurians, respectively, and mapped them against 1) the 32,540 genes contained in the reference genome FGS and 2) a database we developed of unique TE sequence, representing 1,514 families of both Class 1 retroelements and Class 2 DNA elements. This UTE allowed us to reliably assign reads to individual TE families, eliminating many of the complications of multiple mapping without losing much of the information contained in the initial database of nonunique sequences.
Several lines of evidence suggest that Illumina sequencing offers an accurate representation of the genic and non-genic compartment of the maize and luxurians genomes. First, we were able to map a majority of the reads, corresponding to 76.4% and 75.5% of all reads for B73 and luxurians, respectively. Second, reads mapped primarily to TEs rather than genes (84.6% and 85.2% of all mapped reads mapped against TEs for B73 and luxurians, respectively) in a proportion similar to the previously reported TE content for the maize reference genome (Baucom et al. 2009; Schnable et al. 2009). Third, when compared with data generated from maize reduced representation libraries (Gore et al. 2009), our data clearly capture a much greater fraction of the genomic TE content. Hence, library construction and sequencing did not produce any obvious biases toward the euchromatic genomic component.
But how well does our method perform quantitatively for evaluating TE content across families? We considered the 20 most common TE families known to occupy ∼70% of the maize reference genome (Baucom et al. 2009). These families were among the most numerous in our B73 sequence, representing 68.4% of all mapped reads. Moreover, the number of mapped reads for each family correlated nearly perfectly (r = 0.96) with the Mb content of each family in the reference genome. Comparison of mapped reads from our sequence data to in silico sampling of the reference genome finds a similarly strong correlation across all 1,514 families of the database after removing five outliers (see below). Together, these results suggest our mapping methods provide an accurate representation of family-level abundance of TEs in the maize genome. We also find that there is a strong bias toward insertion or maintenance of DNA elements near genes (Schnable et al. 2009). Finally, we note that even relatively small samples of reads (as few as 1.5–5 million) accurately capture major patterns of TE abundance across the genome, suggesting that multiplexing several genotypes within a single Illumina lane may allow efficient evaluation of TE content for population-level analyses.
Although our approach works well for maize, it has two shortcomings that merit discussion. The first is that our number of hits did not correlate exceptionally well (r = 0.68) with the estimated copy number of the 20 most numerous TEs in the B73 reference genome (Baucom et al. 2009). We do not know why our metric performs poorly in comparison to their estimates of copy number but suspect that the answer has to do with variation in the size of elements. If copies vary in size, then copy number has an inexact relationship to the total amount of DNA attributable to a particular TE family, and we estimate total DNA quite accurately. Our method could be improved if we could estimate copy number directly from Illumina reads, but we see no straightforward way to do this given potential complications with de novo assembly of repetitive regions and individual TE insertions. The second drawback is that the approach used here is unique to model systems with well-characterized TEs. It should be possible, however, to perform at least a low-resolution version of this approach so long as there is a genome sequence from a closely related species that could be annotated for TEs.
Five Outlier Families Differ between Illumina Data and the Reference Genome
We detected five TE families that were overrepresented in our empirical data, with 11- to > 100-fold differences in TE hits relative to reads sampled in silico from the B73 reference genome. All are described as unknown LTR-retrotransposons in the exemplar TE database. This overrepresentation was seen in both B73 and luxurians data, suggesting that the result is not an artifact of our B73 library preparation. One possible explanation for these data is that the five families are inserted primarily in regions lacking from the reference genome. Counting the number of base pairs contained in the reference genome and comparing it with our estimate of 2,914 Mb suggests that ∼30% of the maize genome is missing from the reference sequence. Obviously, this leaves a large component of the genome unexplored, and it is certainly possible that the five TE families are highly represented in this unexplored fraction.
If this explanation holds, these TE families should have a strong preference for insertion in heterochromatic regions, that are challenging to assemble. Consistent with this, two of the five families (RLX_teki_AC202867-7492 and RLX_sari_AC184117-11) were among the top 2.5% families exhibiting the most pronounced difference toward insertions in other TEs (as opposed to insertion near genes); three of the five (RLX_osed_AC191084-2931, RLX_sela_AC195130-4415, RLX_sari_AC184117-11) show homology to putative satellite repeats defined in RepBase (Jurka et al. 2005); and analysis of blast results suggests all but RLX_eguh_AC188982-71 show significant spatial correlation with knob repeats in the reference genome (data not shown). Thus, these elements may have a propensity for insertion into repetitive arrays, not unlike the centromere-specific CRM retroelements (Zhong et al. 2002). Interestingly, only small portions of these TEs are found in high copy number (fig. 2), consistent with the idea that we have detected satellite repeats. The similarity between satellites and TEs could be due to capture of satellites by a TE or, conversely, the procurement of a portion of a TE as a satellite. In any case, identification of these outlier families suggests that short read sequencing may contribute to the description and identification of the heterochromatic component of complex plant genomes.
TE Contribution to Genome Size Difference between Maize and luxurians
In order to investigate the contribution of TEs to the ∼50% genome size difference between B73 and luxurians, we determined TE content in both genomes. Using the FGS as an internal control for coverage, we calculated that TE content in luxurians was 1.35-fold higher than in B73. Thus, differences in TE abundance explain ∼70% of the observed genome size difference between species. This is a sizeable proportion, especially given other potential contributors to genome size differences, such as chromosomal knobs, copy number variants, and small-scale insertions and deletions (Laurie and Bennett 1985; Kato et al. 2004; Springer et al. 2009). Note that after isolating all reads that we were not able to map using either UTE or FGS and mapping them against a collection of knob sequences, we were unable to find differences between species in the proportion of unmapped reads targeting knob sequences.
Our inference is, however, limited by the extent of the TE exemplar database. Because it is a B73-specific database, we were not able to assess whether luxurians-specific TEs or repeat families may have contributed to an increase in the luxurians genome size. However, maize and luxurians diverged relatively recently (Hanson et al. 1996; Ross-Ibarra et al. 2009), and it seems unlikely that many luxurians-specific repeats have evolved in that timeframe. The TE exemplar database may also be slightly incomplete; given that a portion of the maize genome remains unsequenced, this portion could harbor unidentified TEs.
A particularly interesting observation from our data is that the pattern of TE content across families was well conserved, with a correlation of 0.97 between species. Unlike investigated cases of rapid genome size change in rice and cotton (Hawkins et al. 2006; Piegu et al. 2006), one or a few TE families do not appear to be responsible for most of the difference observed here. Below, we discuss three nonexclusive scenarios that may help explain this observation.
First, there could be ongoing positive selection for genome shrinkage in Z. mays sensu lato, in part through loss of TEs. Genome size reduction can trigger rapid changes in physiological, phenological, and life-history traits (reviewed in Meagher and Vassiliadis (2005) and Gaut and Ross-Ibarra (2008)), and others have suggested that changes associated with genome size reduction may play an adaptive role in the evolution of invasiveness (Lavergne et al. 2009). Simple calculations suggest that, in a species with a large effective population size similar to Z. mays, even weakly beneficial mutations could increase to high frequency in timescales similar to the divergence between luxurians and Z. mays (Chevin and Hospital 2008). Such selection would have to act simultaneously on several TE deletions, but the idea merits consideration since there is evidence of positive selection for size reduction in the Arabidopsis thaliana genome (Hu et al. in review). The possibility of rapid shifts in genome size is highlighted in examples from domesticated maize, where selection for earliness has been correlated to decreased genome size (Rayburn et al. 1994). Moreover, Laurie and Bennett (1985) have reported from a limited number of observations (<12 per taxon) a tendency for inbred lines to have less DNA than maize landraces and teosintes, suggesting that inbreeding may contribute to rapid decrease in maize genome size. It thus seems possible that selection for reduced genome size may have contributed to the rapid expansion and adaptation of maize over the last few thousand years (Vigouroux et al. 2008) and may constitute a counterbalance to the rapid expansion of genome size due to TEs (SanMiguel et al. 1998), which may have occurred prior to the divergence of Zea species.
Second, the strength of purifying selection against TEs could vary between Z. mays and luxurians. Slightly negative values of the estimates of the population selection parameter in Z. mays (Ross-Ibarra et al. 2009; Gossmann et al. 2010) suggest purifying selection prevents the fixation of weakly deleterious mutations. The much larger effective population size in Z. mays as compared with luxurians (Ross-Ibarra et al. 2009) would translate to higher efficacy of removal of slightly deleterious mutations (such as TE insertions) in Z. mays. Such a situation has been described in Arabidopsis lyrata, where a refugial population bears a stronger signal of purifying selection against TEs than in derived populations with smaller population sizes (Lockton et al. 2008; Ross-Ibarra et al. 2008).
If purifying selection against TEs is prevalent, we expect: 1) a higher proportion of genes with a TE nearby in luxurians than in maize because selection would be more efficient in highly recombining genic regions than in large heterochromatic nested-TE regions and 2) a higher ratio of segregating nonsynonymous mutations over synonymous mutations in luxurians than in maize. However, we find little difference between maize and luxurians in the pattern of TE insertions near other TEs versus genic regions, and previous studies do not document a higher ratio of nonsynonymous to synonymous polymorphisms in luxurians (Ross-Ibarra et al. 2009); both observations are inconsistent with the hypothesis that the observed genome size difference is driven predominantly by differential efficiency of TE removal.
Finally, it is possible that the two species differ in aspects that control TE proliferation, such as the efficiency of epigenetic modification. Host species silence TEs in part by methylating their DNA, and the methylation status of a TE may in turn affect the strength of selection (Hollister and Gaut 2009). At present, however, very little is known about how epigenetic mechanisms and TE silencing varies among plant species.
Ultimately, population studies in maize and its wild relatives—similar to those that have been carried out in Arabidopsis (Hollister and Gaut 2007, 2009) and Drosophila (Gonzalez and Petrov 2009)—will be necessary to elucidate the evolutionary forces acting on TEs and their contribution to genome size variation. But the apparent paradox that Z. mays has a large effective population size but an obese, TE-ridden genome suggests that genome size in Zea may be determined by nonadaptive processes (Oliver et al. 2007). Interestingly, a recent survey has demonstrated a lack of a general relationship between effective population size and genome size in angiosperms (Whitney et al. 2010), calling for alternative explanation to the traditional selective view (Lynch and Conery 2003).
Acknowledgments
We are grateful to J. Cridland and L. Yang for advice and help with Perl and MySQL, to O. Tenaillon and K. Thornton for insightful discussions throughout this work, and to three anonymous reviewers for comments on an earlier version of the manuscript. This research was supported by start-up funds from the UC Davis College of Agricultural and Environmental Sciences.
References
- Albert PS, Gao Z, Danilova TV, Birchler JA. Diversity of chromosomal karyotypes in maize and its relatives. Cytogenet Genome Res. 2010;129:6–16. doi: 10.1159/000314342. [DOI] [PubMed] [Google Scholar]
- Ananiev EV, Phillips RL, Rines HW. A knob-associated tandem repeat in maize capable of forming fold-back DNA segments: are chromosome knobs megatransposons? Proc Natl Acad Sci U S A. 1998;95:10785–10790. doi: 10.1073/pnas.95.18.10785. [DOI] [PMC free article] [PubMed] [Google Scholar]
- Baucom RS, et al. Exceptional diversity, non-random distribution, and rapid evolution of retroelements in the B73 maize genome. PLoS Genet. 2009;5:e1000732. doi: 10.1371/journal.pgen.1000732. [DOI] [PMC free article] [PubMed] [Google Scholar]
- Bennetzen JL, Coleman C, Liu RY, Ma JX, Ramakrishna W. Consistent over-estimation of gene number in complex plant genomes. Curr Opin Plant Biol. 2004;7:732–736. doi: 10.1016/j.pbi.2004.09.003. [DOI] [PubMed] [Google Scholar]
- Brown WL. Numbers and distribution of chromosome knobs in United States maize. Genetics. 1949;34:524–536. doi: 10.1093/genetics/34.5.524. [DOI] [PMC free article] [PubMed] [Google Scholar]
- Brunner S, Fengler K, Morgante M, Tingey S, Rafalski A. Evolution of DNA sequence nonhomologies among maize inbreds. Plant Cell. 2005;17:343–360. doi: 10.1105/tpc.104.025627. [DOI] [PMC free article] [PubMed] [Google Scholar]
- Bureau TE, Ronald PC, Wessler SR. A computer-based systematic survey reveals the predominance of small inverted-repeat elements in wild-type rice genes. Proc Natl Acad Sci U S A. 1996;93:8524–8529. doi: 10.1073/pnas.93.16.8524. [DOI] [PMC free article] [PubMed] [Google Scholar]
- Bureau TE, Wessler SR. Tourist—a large family of small inverted repeat elements frequently associated with maize genes. Plant Cell. 1992;4:1283–1294. doi: 10.1105/tpc.4.10.1283. [DOI] [PMC free article] [PubMed] [Google Scholar]
- Chevin LM, Hospital F. Selective sweep at a quantitative trait locus in the presence of background genetic variation. Genetics. 2008;180:1645–1660. doi: 10.1534/genetics.108.093351. [DOI] [PMC free article] [PubMed] [Google Scholar]
- Cridland J, Thornton K. Validation of rearrangement breakpoints identified by paired-end sequencing in natural populations of Drosophila melanogaster. Genome Biol Evol. 2010;2010:83–101. doi: 10.1093/gbe/evq001. [DOI] [PMC free article] [PubMed] [Google Scholar]
- Fu H, et al. The highly recombinogenic bz locus lies in an unusually gene-rich region of the maize genome. Proc Natl Acad Sci U S A. 2001;98:8903–8908. doi: 10.1073/pnas.141221898. [DOI] [PMC free article] [PubMed] [Google Scholar]
- Gaut BS, Ross-Ibarra J. Perspective—selection on major components of angiosperm genomes. Science. 2008;320:484–486. doi: 10.1126/science.1153586. [DOI] [PubMed] [Google Scholar]
- Gonzalez J, Petrov DA. The adaptive role of transposable elements in the Drosophila genome. Gene. 2009;448:124–133. doi: 10.1016/j.gene.2009.06.008. [DOI] [PMC free article] [PubMed] [Google Scholar]
- Gore MA, et al. A first-generation haplotype map of maize. Science. 2009;326:1115–1117. doi: 10.1126/science.1177837. [DOI] [PubMed] [Google Scholar]
- Gossmann TI, et al. Genome wide analyses reveal little evidence for adaptive evolution in many plant species. Mol Biol Evol. 2010;27:1822–1832. doi: 10.1093/molbev/msq079. [DOI] [PMC free article] [PubMed] [Google Scholar]
- Hanson MA, et al. Evolution of anthocyanin biosynthesis in maize kernels: the role of regulatory and enzymatic loci. Genetics. 1996;143:1395–1407. doi: 10.1093/genetics/143.3.1395. [DOI] [PMC free article] [PubMed] [Google Scholar]
- Hawkins JS, Kim H, Nason JD, Wing RA, Wendel JF. Differential lineage-specific amplification of transposable elements is responsible for genome size variation in Gossypium. Genome Res. 2006;16:1252–1261. doi: 10.1101/gr.5282906. [DOI] [PMC free article] [PubMed] [Google Scholar]
- Hollister JD, Gaut BS. Population and evolutionary dynamics of helitron transposable elements in Arabidopsis thaliana. Mol Biol Evol. 2007;24:2515–2524. doi: 10.1093/molbev/msm197. [DOI] [PubMed] [Google Scholar]
- Hollister JD, Gaut BS. Epigenetic silencing of transposable elements: a trade-off between reduced transposition and deleterious effects on neighbouring gene expression. Genome Res. 2009;19:1419–1428. doi: 10.1101/gr.091678.109. [DOI] [PMC free article] [PubMed] [Google Scholar]
- Jurka J, et al. Repbase update, a database of eukaryotic repetitive elements. Cytogenet Genome Res. 2005;110:462–467. doi: 10.1159/000084979. [DOI] [PubMed] [Google Scholar]
- Kato A, Lamb JC, Birchler JA. Chromosome painting using repetitive DNA sequences as probes for somatic chromosome identification in maize. Proc Natl Acad Sci U S A. 2004;101:13554–13559. doi: 10.1073/pnas.0403659101. [DOI] [PMC free article] [PubMed] [Google Scholar]
- Lamb JC, et al. Distinct chromosomal distributions of highly repetitive sequences in maize. Chromosome Res. 2007;15:33–49. doi: 10.1007/s10577-006-1102-1. [DOI] [PubMed] [Google Scholar]
- Laurie DA, Bennett MD. Nuclear DNA content in the genera Zea and Sorghum—intergenic, interspecific and intraspecific variation. Heredity. 1985;55:307–313. [Google Scholar]
- Lavergne S, Muenke NJ, Molofsky J. Genome size reduction can trigger rapid phenotypic evolution in invasive plants. Ann Bot. 2009;105:109–116. doi: 10.1093/aob/mcp271. [DOI] [PMC free article] [PubMed] [Google Scholar]
- Liu SZ, et al. Mu transposon insertion sites and meiotic recombination events co-localize with epigenetic marks for open chromatin across the maize genome. PLoS Genet. 2009;5:e1000733. doi: 10.1371/journal.pgen.1000733. [DOI] [PMC free article] [PubMed] [Google Scholar]
- Lockton S, Ross-Ibarra J, Gaut BS. Demography and weak selection drive patterns of transposable element diversity in natural populations of Arabidopsis lyrata. Proc Natl Acad Sci U S A. 2008;105:13965–13970. doi: 10.1073/pnas.0804671105. [DOI] [PMC free article] [PubMed] [Google Scholar]
- Lynch M, Conery JS. The origins of genome complexity. Science. 2003;302:1401–1404. doi: 10.1126/science.1089370. [DOI] [PubMed] [Google Scholar]
- Matsuoka Y, et al. A single domestication for maize shown by multilocus microsatellite genotyping. Proc Natl Acad Sci U S A. 2002;99:6080–6084. doi: 10.1073/pnas.052125199. [DOI] [PMC free article] [PubMed] [Google Scholar]
- McClintock B. The origin and behavior of mutable loci in maize. Proc Natl Acad Sci U S A. 1950;36:344–355. doi: 10.1073/pnas.36.6.344. [DOI] [PMC free article] [PubMed] [Google Scholar]
- Meagher TR, Vassiliadis C. Phenotypic impacts of repetitive DNA in flowering plants. New Phytol. 2005;168:71–80. doi: 10.1111/j.1469-8137.2005.01527.x. [DOI] [PubMed] [Google Scholar]
- Meyers BC, Tingey SV, Morgante M. Abundance, distribution, and transcriptional activity of repetitive elements in the maize genome. Genome Res. 2001;11:1660–1676. doi: 10.1101/gr.188201. [DOI] [PMC free article] [PubMed] [Google Scholar]
- Mortazavi A, Williams BA, McCue K, Schaeffer L, Wold B. Mapping and quantifying mammalian transcriptomes by rna-seq. Nat Methods. 2008;5:621–628. doi: 10.1038/nmeth.1226. [DOI] [PubMed] [Google Scholar]
- Naito K, et al. Dramatic amplification of a rice transposable element during recent domestication. Proc Natl Acad Sci U S A. 2006;103:17620–17625. doi: 10.1073/pnas.0605421103. [DOI] [PMC free article] [PubMed] [Google Scholar]
- Ning Z, Cox AJ, Mullikin JC. SSAHA: a fast search method for large DNA databases. Genome Res. 2001;11:1725–1729. doi: 10.1101/gr.194201. [DOI] [PMC free article] [PubMed] [Google Scholar]
- Oliver MJ, Petrov D, Ackerly D, Falkowski P, Schofield OM. The mode and tempo of genome size evolution in eukaryotes. Genome Res. 2007;17:594–601. doi: 10.1101/gr.6096207. [DOI] [PMC free article] [PubMed] [Google Scholar]
- Peacock WJ, Dennis ES, Rhoades MM, Pryor AJ. Highly repeated DNA sequence limited to knob heterochromatin maize. Proc Natl Acad Sci U S A. 1981;78:4490–4494. doi: 10.1073/pnas.78.7.4490. [DOI] [PMC free article] [PubMed] [Google Scholar]
- Piegu B, et al. Doubling genome size without polyploidization: dynamics of retrotransposition-driven genomic expansions in Oryza australiensis, a wild relative of rice. Genome Res. 2006;16:1262–1269. doi: 10.1101/gr.5290206. [DOI] [PMC free article] [PubMed] [Google Scholar]
- Poggio L, Rosato M, Chiavarino AM, Naranjo CA. Genome size and environmental correlations in maize (Zea mays ssp. mays, Poaceae) Ann Bot. 1998;82:107–115. [Google Scholar]
- Rayburn AL, Biradar DP, Bullock DG, McMurphy LM. Nuclear DNA content in F1 hybrids of maize. Heredity. 1993;70:294–300. [Google Scholar]
- Rayburn AL, Dudley JW, Biradar DP. Selection for early flowering results in simultaneous selection for reduced nuclear DNA content in maize. Plant Breed. 1994;112:318–322. [Google Scholar]
- Ross-Ibarra J, Tenaillon MI, Gaut BS. Historical divergence and gene flow in the genus Zea. Genetics. 2009;181:1399–1413. doi: 10.1534/genetics.108.097238. [DOI] [PMC free article] [PubMed] [Google Scholar]
- Ross-Ibarra J, et al. Patterns of polymorphism and demographic history in natural populations of Arabidopsis lyrata. PLoS One. 2008;3:e2411. doi: 10.1371/journal.pone.0002411. [DOI] [PMC free article] [PubMed] [Google Scholar]
- Saghai-Maroof MA, Soliman KM. Jorgensen RA, Allard RW. Ribosomal DNA spacer-length in barley—mendelian inheritance, chromosomal location, and population-dynamics. Proc Natl Acad Sci U S A. 1984;81:8014–8018. doi: 10.1073/pnas.81.24.8014. [DOI] [PMC free article] [PubMed] [Google Scholar]
- SanMiguel PJ, Gaut BS, Tikhonov A, Nakajima Y, Bennetzen JL. The paleontology of intergene retrotransposons of maize. Nat Genet. 1998;20:43–45. doi: 10.1038/1695. [DOI] [PubMed] [Google Scholar]
- Schnable PS, et al. The B73 maize genome: complexity, diversity, and dynamics. Science. 2009;326:1112–1115. doi: 10.1126/science.1178534. [DOI] [PubMed] [Google Scholar]
- Springer NM, et al. Maize inbreds exhibit high levels of copy number variation (CNV) and presence/absence variation (PAV) in genome content. PLoS Genet. 2009;5:e1000734. doi: 10.1371/journal.pgen.1000734. [DOI] [PMC free article] [PubMed] [Google Scholar]
- Tenaillon MI, Hollister JD, Gaut BS. Plant transposable elements in three dimensions. Trends Plant Sci. 2010;15:471–478. doi: 10.1016/j.tplants.2010.05.003. [DOI] [PubMed] [Google Scholar]
- Tikhonov AP, et al. Colinearity and its exceptions in orthologous adh regions of maize and sorghum. Proc Natl Acad Sci U S A. 1999;96:7409–7414. doi: 10.1073/pnas.96.13.7409. [DOI] [PMC free article] [PubMed] [Google Scholar]
- Vigouroux Y, et al. Population structure and genetic diversity of new world maize races assessed by DNA microsatellites. Am J Bot. 2008;95:1240–1253. doi: 10.3732/ajb.0800097. [DOI] [PubMed] [Google Scholar]
- Wang QH, Dooner HK. Remarkable variation in maize genome structure inferred from haplotype diversity at the bz locus. Proc Natl Acad Sci U S A. 2006;103:17644–17649. doi: 10.1073/pnas.0603080103. [DOI] [PMC free article] [PubMed] [Google Scholar]
- Wei FS, et al. Detailed analysis of a contiguous 22-Mb region of the maize genome. PLoS Genet. 2009;5:e1000728. doi: 10.1371/journal.pgen.1000728. [DOI] [PMC free article] [PubMed] [Google Scholar]
- Whitney KD, et al. A role for nonadaptive processes in plant genome size evolution? Evolution. 2010;64:2097–2109. doi: 10.1111/j.1558-5646.2010.00967.x. [DOI] [PubMed] [Google Scholar]
- Wicker T, et al. A unified classification system for eukaryotic transposable elements. Nat Rev Genet. 2007;8:973–982. doi: 10.1038/nrg2165. [DOI] [PubMed] [Google Scholar]
- Xiong ZY, et al. Heterozygosity of knob-associated tandem repeats and knob instability in mitotic chromosomes of Zea (Zea mays L. and Z. diploperennis Iltis Doebley) J Integ Plant Biol. 2005;47:1345–1351. [Google Scholar]
- Zerjal T, Joets J, Alix K, Grandbastien MA, Tenaillon MI. Contrasting evolutionary patterns and target specificities among three Tourist-like MITE families in the maize genome. Plant Mol Biol. 2009;71:99–114. doi: 10.1007/s11103-009-9511-0. [DOI] [PubMed] [Google Scholar]
- Zhang Q, Arbuckle J, Wessler SR. Recent, extensive, and preferential insertion of members of the miniature inverted-repeat transposable element family Heartbreaker into genic regions of maize. Proc Natl Acad Sci U S A. 2000;97:1160–1165. doi: 10.1073/pnas.97.3.1160. [DOI] [PMC free article] [PubMed] [Google Scholar]
- Zhang X, et al. P instability factor: an active maize transposon system associated with the amplification of Tourist-like MITEs and a new superfamily of transposases. Proc Natl Acad Sci U S A. 2001;98:12572–12577. doi: 10.1073/pnas.211442198. [DOI] [PMC free article] [PubMed] [Google Scholar]
- Zhong CX, et al. Centromeric retroelements and satellites interact with maize kinetochore protein CENH3. Plant Cell. 2002;14:2825–2836. doi: 10.1105/tpc.006106. [DOI] [PMC free article] [PubMed] [Google Scholar]
- Zonneveld BJM, Leitch IJ, Bennett MD. First nuclear DNA amounts in more than 300 angiosperms. Annals of Botany. 2005;96:229–244. doi: 10.1093/aob/mci170. [DOI] [PMC free article] [PubMed] [Google Scholar]