Abstract
Background:
Hematoma expansion (HE) is a surrogate marker in intracerebral hemorrhage (ICH) trials. However, the amount of HE necessary to produce poor outcomes in an individual is unclear; there is no agreement on a clinically meaningful definition of HE. We compared commonly used definitions of HE in their ability to predict poor outcome as defined by various cutpoints on the modified Rankin Scale (mRS).
Methods:
In this cohort study, we analyzed 531 patients with ICH from the Virtual International Stroke Trials Archive. Primary outcome was mRS at 90 days, dichotomized into 0–3 vs 4–6. Secondary outcomes included other mRS cutpoints and mRS “shift analysis.” Sensitivity, specificity, and predictive values for commonly used HE definitions were calculated.
Results:
Between 13% and 32% of patients met the commonly used HE definitions. All definitions independently predicted poor outcome; positive predictive values increased with higher growth cutoffs but at the expense of lower sensitivities. All HE definitions showed higher specificity than sensitivity. Absolute growth cutoffs were more predictive than relative cutoffs when mRS 5–6 or 6 was defined as “poor outcome.”
Conclusion:
HE robustly predicts poor outcome regardless of the growth definition or the outcome definition. The highest positive predictive values are obtained when using an absolute growth definition to predict more severe outcomes. Given that only a minority of patients may have clinically relevant HE, hemostatic ICH trials may need to enroll a large number of patients, or select for a population that is more likely to have HE.
Intracerebral hemorrhage (ICH) is associated with 40% early mortality and 80% disability.1,2 Hematoma expansion (HE) is a major determinant of early deterioration and death.3,4 Accordingly, there is interest in determining the risk of HE,5–8 and developing strategies to reduce HE.9
HE is a potential surrogate marker in ICH trials: HE is associated with poor outcome,4,10 can be influenced by therapy,11–13 and is on the biologic pathway that leads from initial presentation to worsening and death. HE has not, however, been validated as a surrogate marker for several reasons. First, there is no consensus definition for HE, which limits the understanding of its frequency and predictors.3,14–16 Second, relationships between different definitions for HE and outcome have not been studied; it is unclear which cutoffs are most appropriate. Third, different definitions of “poor outcome” in ICH have not been comprehensively studied; an optimal ICH trial outcome may increase the sensitivity to detect treatment effects that reduce HE.
Recent trials failed to find a clinical benefit for ICH therapies, despite a reduction in HE.11,13 These results are difficult to interpret without a better understanding of the magnitude of HE reduction that is meaningful at the individual patient level.17 To address these limitations, we asked the following: 1) How do different definitions of HE compare in their ability to predict poor outcome? 2) Are the relationships between HE and outcome dependent on the definition of “poor outcome” used?
METHODS
We analyzed patient data obtained from the Virtual International Stroke Trials Archive (VISTA).18 Eligibility for VISTA required the following: 1) documented entry criteria into a trial, with a minimum of 100 patients; 2) local ethics board approval; 3) baseline assessment within 24 hours of stroke; 4) baseline assessment of neurologic deficit; 5) confirmation of stroke with imaging; 6) outcome assessment between 1 and 6 months with a validated stroke scale; and 7) data validation through monitoring. In addition, the VISTA cohort used in our study consisted of patients presenting with CT-proven ICH within 6 hours of symptom onset, and with baseline clinical, radiologic, and laboratory data. All patients had baseline and 24-hour NIH Stroke Scale (NIHSS) score, follow-up CT scan at 72 hours, 3-month modified Rankin Scores (mRS), and 3-month mortality data. Exclusion criteria included ICH attributable to trauma, severely depressed consciousness, planned surgical evacuation, premorbid mRS >1 or severe concurrent illness with life expectancy <6 months, age <18, pregnancy or breast-feeding, or inclusion in another study with an investigational drug or device. ICH volumes were measured on the baseline and 72-hour scan using semiautomated computerized planimetry; scans were read centrally. Patients were included from both the active and control arms of the trials, but were not derived from trials targeting HE, and were not treated with study-specified antihypertensive or hemostatic agents. All patient data were anonymized by VISTA.
The primary outcome was mRS at 3 months, dichotomized into good (0–3) or poor (4–6) outcome. As there is no standard definition for poor outcome in ICH trials,11,19 our secondary outcomes included mRS “shift analysis,” and reclassification of poor outcome as mRS 2–6, 3–6, 5–6, and 6 (death).
The primary exposure was HE. We performed univariate analyses to explore the association between HE and outcomes, and potential confounders including age, gender, medical history, antithrombotic medications, smoking, baseline blood pressure, baseline NIHSS, Glasgow Coma Scale (GCS), onset-to-baseline CT time, ICH location, intraventricular extension, and baseline hematoma volume. We used Fisher exact test for comparisons of dichotomous or categorical variables, and t test or the Wilcoxon rank sum test for continuous variables. Multivariable models included significant covariates from this exploratory analysis.
We generated receiver operating characteristic (ROC) curves for relative and absolute definitions of HE and compared them. To determine whether initial hematoma size affects the performance of the absolute vs relative growth definitions, we compared their c statistics when adjusted for baseline ICH volume (categorized as <10 mL, 10–19 mL, 20–29 mL, and >30 mL). For the most commonly used definitions of HE (33% growth, ≥6 mL growth, or ≥12.5 mL growth) we calculated sensitivity, specificity, and positive and negative predictive values. To derive a mathematically optimal cutoff for growth, we randomly selected a derivation sample (2/3 of the cohort) and used the method of Youden20 to select optimal cutpoints for relative and absolute growth. These cutpoints were then tested in the remaining validation sample.
Using the complete study cohort, we built multivariable logistic regression models to test the relationships between various definitions of HE and the primary outcome, adjusted for confounders. Candidate variables were those associated with the primary outcome (p ≤ 0.15) in the exploratory analysis. Nonsignificant variables (p > 0.05) were eliminated in a backward stepwise fashion to create a minimal model.
Finally, ROC analyses and multivariable models were repeated for the secondary outcome measures. Ordinal logistic regression was used for mRS shift analysis. All models were adjusted for the same covariates as above.
SAS version 9.2 (Cary, NC) was used for all statistical analyses.
Standard protocol approvals, registrations, and patient consents.
All studies included into the VISTA database required patient consent and local ethics board approval.
RESULTS
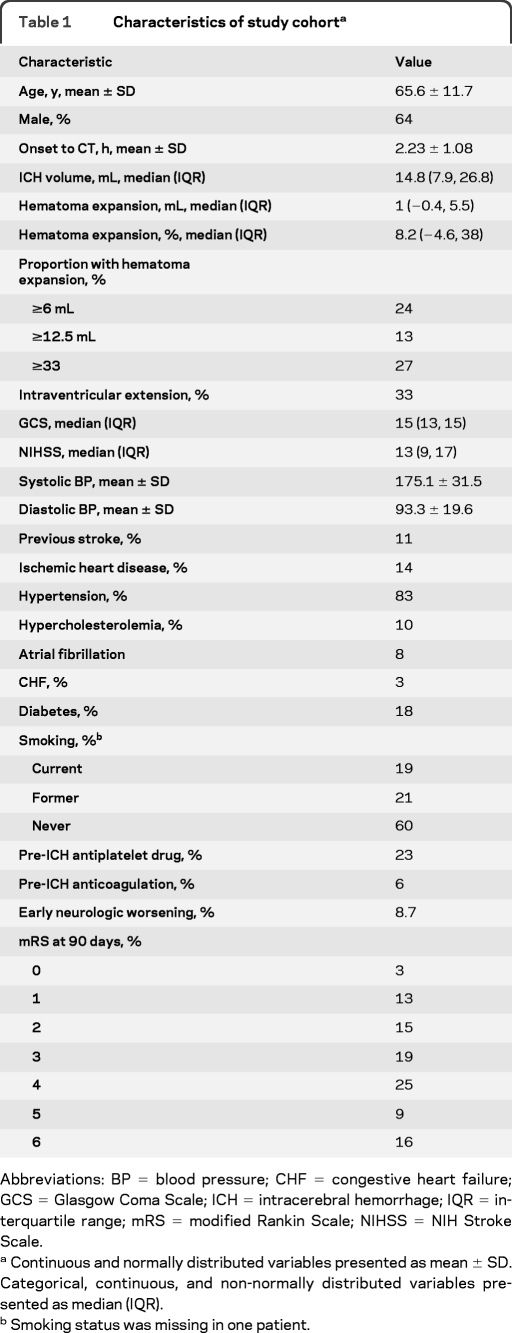
The study cohort consisted of 531 patients; baseline characteristics are shown in table 1. Exploratory analyses revealed significant associations between poor functional outcome (mRS 4–6) and HE, age, GCS, baseline NIHSS, baseline systolic blood pressure, baseline glucose, baseline ICH volume, intraventricular hemorrhage, early neurologic worsening (NIHSS change ≥4 between baseline and 24 hours), prior stroke, prior hypertension, prior atrial fibrillation, and anticoagulant use (p < 0.05 for all comparisons, data not shown). Early neurologic worsening occurred in 8.7% overall and was more frequent in patients with HE as defined by any of the cutoffs in table 1 (p < 0.001 for each comparison, data not shown).
Table 1.
Characteristics of study cohorta
Abbreviations: BP = blood pressure; CHF = congestive heart failure; GCS = Glasgow Coma Scale; ICH = intracerebral hemorrhage; IQR = interquartile range; mRS = modified Rankin Scale; NIHSS = NIH Stroke Scale.
Continuous and normally distributed variables presented as mean ± SD. Categorical, continuous, and non-normally distributed variables presented as median (IQR).
Smoking status was missing in one patient.
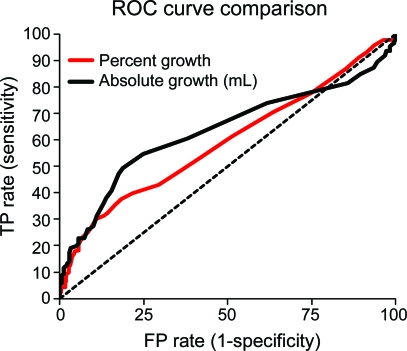
ROC curves for absolute and relative HE, for the prediction of poor outcome defined as mRS 4–6, are shown in the figure. The area under the ROC curve (AUC) was 0.61 for absolute growth and 0.59 for relative growth; HE discriminated the risk of poor outcome only modestly. There was a trend toward better discrimination when using absolute growth compared to relative growth (p = 0.09). Absolute growth was more predictive of poor outcome than relative growth when the definition of poor outcome was changed to mRS 5–6 (AUC 0.64 vs 0.61, p = 0.02) or death (AUC 0.66 vs 0.62, p = 0.003). The discrimination of relative and absolute growth was similar across different categories of baseline hematoma size (<10 mL, 10–19 mL, 20–29 mL, and >30 mL), with AUCs ranging from 0.59 to 0.66 for absolute growth and 0.59 to 0.66 for relative growth. There were no significant differences between the AUCs for absolute vs relative HE in any baseline hematoma size category (p ≥ 0.14 for all comparisons).
Figure. Receiver operating characteristic (ROC) curve comparison.
ROC curves for percent growth and absolute growth (n = 531). FP = false positive; TP = true positive.
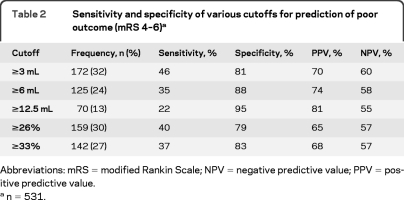
To derive and validate a mathematically defined optimal growth cutpoint, we randomly divided the cohort into derivation (n = 354) and validation (n = 177) samples. According to the method of Youden,20 the best cutoff for absolute growth was ≥3 mL (sensitivity 49%, specificity 81%) and the best cutoff for relative growth was ≥26% (sensitivity 42%, specificity 80%). These cutoffs reproduced well in the validation sample (≥3 mL: sensitivity 38%, specificity 79%; ≥26%: sensitivity 35%, specificity 78%) with the exception of somewhat lower sensitivity for the ≥3 mL cutoff in the validation sample compared to the derivation sample.
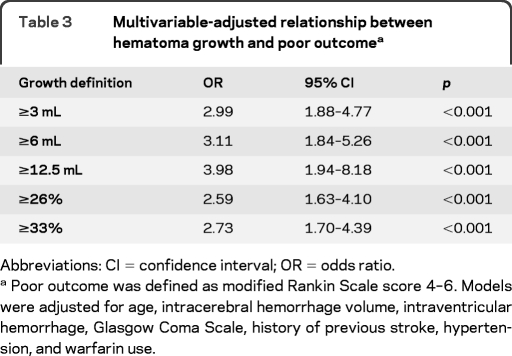
Using the entire cohort (n = 531), we calculated sensitivity, specificity, positive predictive value, and negative predictive value for commonly used HE definitions, as well as the mathematically derived optimal cutpoints (table 2; values for all definitions shown in table e-1 on the Neurology® Web site at www.neurology.org). By any definition, specificity was substantially higher than sensitivity. Less than a third of patients had HE by any of these definitions. Multivariable-adjusted regression analyses confirmed that all definitions independently predicted poor outcome (table 3).
Table 2.
Sensitivity and specificity of various cutoffs for prediction of poor outcome (mRS 4–6)a
Abbreviations: mRS = modified Rankin Scale; NPV = negative predictive value; PPV = positive predictive value.
n = 531.
Table 3.
Multivariable-adjusted relationship between hematoma growth and poor outcomea
Abbreviations: CI = confidence interval; OR = odds ratio.
Poor outcome was defined as modified Rankin Scale score 4–6. Models were adjusted for age, intracerebral hemorrhage volume, intraventricular hemorrhage, Glasgow Coma Scale, history of previous stroke, hypertension, and warfarin use.
HE was a robust independent predictor of early neurologic deterioration and poor outcome regardless of the outcome definition or growth definition (table 4). Sensitivity for predicting poor outcome increased when using more severe outcomes, more so for absolute growth definitions compared to relative growth definitions. There was no clearcut growth definition that best predicted outcome, although absolute growth better predicted the more severe outcomes. Further, as the amount of growth required for the definition of significant HE was increased, sensitivity was sacrificed for greater specificity. Odds ratios for ordinal logistic regression (shift analysis) were also highly significant for all growth definitions.
Table 4.
Relationship between hematoma expansion and different definitions of poor clinical outcome
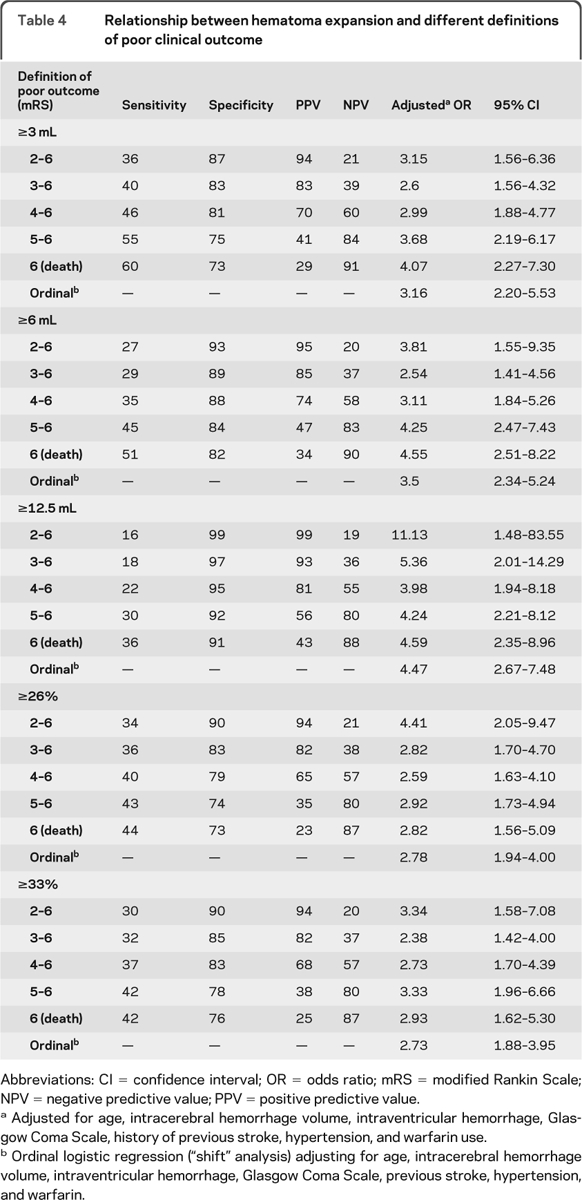
Abbreviations: CI = confidence interval; OR = odds ratio; mRS = modified Rankin Scale; NPV = negative predictive value; PPV = positive predictive value.
Adjusted for age, intracerebral hemorrhage volume, intraventricular hemorrhage, Glasgow Coma Scale, history of previous stroke, hypertension, and warfarin use.
Ordinal logistic regression (“shift” analysis) adjusting for age, intracerebral hemorrhage volume, intraventricular hemorrhage, Glasgow Coma Scale, previous stroke, hypertension, and warfarin.
DISCUSSION
Early definitions of hematoma growth were derived from the thresholds at which expansion was visually discernible on sequential CT scans: proposed definitions included 40% relative volume increase or an absolute increase of 12.6 mL,3 33% relative increase,15 a combined 50% relative increase and 2 mL absolute increase,14 or a 20-mL absolute increase.14 More recently, investigators from the phase IIb recombinant factor VII ICH trial used a combined cutoff of 33% relative and 12.5 mL absolute volume increase as the criteria for hematoma enlargement.21 Yet current studies examining CT angiography contrast extravasation used an absolute increase of 6 mL,8,22 based on a recent ICH cohort study.23 Clearly, there is no universally agreed upon definition for hematoma growth.
Our study systematically delineates the relationship between clinical outcomes and the most commonly used definitions of HE. A minority of patients exhibited HE, even by the most liberal definition, which is consistent with prior findings.3,14,15 There was no obvious threshold relationship between HE and the likelihood of poor outcome. We found all HE definitions performed similarly: by any definition, the sensitivity for predicting poor outcome was ≤50%, and was much lower than the specificity. Many patients with ICH were likely destined for a poor outcome irrespective of HE, perhaps due to advanced age, large hematoma volumes, or intraventricular extension, which contributed to the low sensitivity (the probability that a patient with a poor outcome had HE). By contrast, specificity was substantially higher. Accordingly, the positive predictive values (the probability that a patient with HE will have a poor outcome) ranged from 66% to 78%. As expected, the positive predictive value was higher for HE definitions that required a greater amount of hematoma increase.
There was a trend toward better performance for absolute HE definitions compared to relative HE definitions. For prediction of our prespecified poor outcome (mRS 4–6), the AUC for absolute growth was nonsignificantly higher than for relative growth (p = 0.09). In secondary analyses, the AUC for absolute growth was significantly higher than relative growth when poor outcome was defined as either severe disability (mRS 5–6) or death. Further, the positive predictive values for poor outcome were higher for absolute growth definitions as compared to relative growth definitions. The most likely explanation for these findings is that absolute HE is directly proportional to the volume of brain tissue destroyed or distorted by the hematoma; hematoma volume is well-recognized as the primary determinant of poor outcome following ICH.24,25
We found baseline hematoma size had little bearing on the ability of absolute vs relative HE definitions to predict outcome. One might expect that relative HE definitions would perform poorly in hematomas of small baseline size, as a 33% relative size increase would translate into a small volume increase. Conversely, one might expect that relative HE definitions would perform better when the baseline hematoma size is large. Unexpectedly, we failed to find any significant difference between absolute and relative definitions of HE according to baseline hematoma size categories of <10, 10–19, 20–29, and ≥30 mL. Our results may reflect the choice of baseline hematoma size categories. It is possible that the relationships between relative and absolute HE definitions and outcome become more apparent in hematomas of very small or very large baseline size, of which there were few in this study.
In addition to investigating HE definitions already used in the literature, we used the study data to derive and validate mathematically optimal cutoffs for absolute and relative HE, based on the method of Youden.20 This method selects the optimal cutoff based on the point on the ROC curve that is farthest from a chance result. The cutoffs obtained (3 mL and 26%) represent lower degrees of HE than the commonly used definitions in the literature, and have correspondingly lower positive predictive values but higher sensitivities. These “optimal” cutpoints are selected by a method that assigns equal weight to maximizing sensitivity and specificity, and therefore may not be the most clinically relevant when these are not deemed to be equal. A clinically relevant definition of HE suitable for use as a surrogate marker in trials of hemostatic therapies should have a high positive predictive value, such that there is a high likelihood that a patient meeting the definition for HE will have a poor outcome. In this context, our mathematically derived HE cutpoints may not be ideal definitions for hemostatic clinical trials. Rather, the commonly used ≥12.5 mL cutpoint had the highest adjusted odds ratio for predicting all poor outcome definitions, and is above the minimal detectable difference (MDD) of quantitative volumetric ICH measurement.26 Yet ≥12.5 mL growth was only seen in 13% of patients in this study. This highlights a necessary trade-off when defining HE cutoffs: more specific definitions are based on higher amounts of growth, which are seen in fewer patients. An ideal definition of HE for a hemostatic trial should have a good positive predictive value and exceed the MDD of ICH measurement while still being detected in a reasonable proportion of trial participants.
This study has several limitations. Our findings may not be applicable to studies restricted to very early ICH presentation. Our dataset included patients scanned up to 6 hours after symptom onset, similar to the Intensive Blood Pressure Reduction in Acute Cerebral Hemorrhage Trial (INTERACT), which showed blood pressure lowering reduces HE.13 The frequency of HE is dependent on the timing of imaging, as maximal growth occurs in the first 3 hours.15 Mean time from symptom onset to CT in our study (2.23 ± 1.08 hours) was comparable to INTERACT (3.5 hours from onset to randomization), but slightly longer than the phase III Factor Seven for Acute Hemorrhagic Stroke trial (1.82 ± 0.65 hours from onset to CT), which only enrolled patients with symptom onset to scan times of <4 hours.11 Median HE was lower in our study compared to the placebo group of the FAST trial, consistent with our longer mean onset to scan times. Further, in our cohort, final ICH volume was measured at 72 hours, instead of 24 hours as in many other studies. This may have overestimated HE compared to other studies, although we think this is unlikely because late expansion (between 24 and 72 hours) is considered very rare. In addition, the data in this study were derived from participants in ICH trials and excluded patients with severely depressed consciousness, large ICH volumes, or those in whom withdrawal of care or surgical intervention was anticipated. Despite these exclusions, withdrawal of care following trial enrollment may partly account for the strong association between HE and death, if HE was perceived by the treating team as negating any chance of a good outcome (a potentially self-fulfilling prophecy).27,28 Although our findings may not be applicable to the entire ICH population, our study cohort is representative of the patients enrolled in ICH clinical trials,11,13 and our results have important implications for their design. The cohort design introduces the possibility of unknown confounding variables that may have influenced the relationship between HE and outcome. Finally, our analyses were exploratory and our findings may have been influenced by unique characteristics of our study population and therefore warrant confirmation and external validation.
If our observations can be independently confirmed, then we suggest our findings have 3 main implications for designing and reporting of hemostatic therapy trials for ICH. First, dichotomous definitions of HE should include an absolute growth criterion, and absolute growth should be reported in trials. Absolute growth seems more clinically relevant than relative growth, particularly for more severe outcomes. Further, this growth definition should have a high positive predictive value for poor outcome, capture a useful number of patients with HE, and exceed the MDD of ICH volume measurement. Second, HE appears more predictive of severe outcomes than more moderate ones; an endpoint based on severe disability or death may be more sensitive to hemostatic therapy than other endpoints. Third, to efficiently conduct clinical trials of hemostatic therapy, it would be advantageous to enrich the study population with patients at higher risk for HE, as we found that HE is only present in a minority of patients even when using relatively liberal definitions. Patients without clinically relevant HE have little chance of benefit, but a similar chance of harm from hemostatic therapies. Patient selection for hemostatic trials could be based on very early enrollment after symptom onset, or by radiologic criteria such as the presence of a “spot sign” on CT.22,29
Supplementary Material
Editorial, page 1204
Supplemental data at www.neurology.org
- AUC
- area under the receiver operating characteristic curve
- GCS
- Glasgow Coma Scale
- HE
- hematoma expansion
- ICH
- intracerebral hemorrhage
- INTERACT
- Intensive Blood Pressure Reduction in Acute Cerebral Hemorrhage Trial
- MDD
- minimal detectable difference
- mRS
- modified Rankin Scale
- NIHSS
- NIH Stroke Scale
- ROC
- receiver operating characteristic
- VISTA
- Virtual International Stroke Trials Archive.
AUTHOR CONTRIBUTIONS
Statistical analysis was conducted by Dr. E.E. Smith.
COINVESTIGATORS
VISTA Steering Committee: A. Alexandrov, P.W. Bath, E. Bluhmki, L. Claesson, J. Curram, S.M. Davis, G. Donnan, H.C. Diener, M. Fisher, B. Gregson, J. Grotta, W. Hacke, M.G. Hennerici, M. Hommel, M. Kaste, K.R. Lees, P. Lyden, J. Marler, K. Muir, R. Sacco, A. Shuaib, P. Teal, N.G. Wahlgren, S. Warach, and C. Weimar.
DISCLOSURE
Dr. Dowlatshahi was supported by a Canadian Institutes of Health Research Fellowship award and a University of Ottawa Fellowship for New Faculty award. Dr. Demchuk has served on a scientific advisory board for Boehringer Ingelheim; has received funding for travel and speaker honoraria from Boehringer Ingelheim and Sanofi-Aventis; serves on the editorial boards of Journal of Neuroimaging, Stroke, and the International Journal of Stroke; and receives research support from Novo Nordisk and the NIH/NINDS. Dr. Flaherty has served as a consultant for Boehringer Ingelheim and receives research support from Novo Nordisk and the NIH/NINDS. Dr. Ali reports no disclosures. Dr. Lyden serves on a scientific advisory board for CoAxia, Inc.; has received funding for travel from Mitsubishi Tanabe Pharma Corporation and PhotoThera; serves on the editorial boards of Stroke, International Journal of Stroke, and Journal of Stroke and Cerebrovascular Disorders; receives publishing royalties for Thrombolytic Therapy for Acute Ischemic Stroke, 2nd ed. (Humana Press, 2006); serves as a consultant for Mitsubishi Tanabe Pharma Corporation, BeneChill, Inc., PhotoThera, CoAxia, Inc., Pfizer Inc., and ZZ Biotech L.L.C.; and has received research support from the NIH and the US Veterans Administration. Dr. Smith has served on a scientific advisory board for Genentech, Inc.; received speaker honoraria from the Canadian Conference on Dementia; serves as an Assistant Editor for Stroke; has served on speakers' bureaus for QuantiaMD and BMJ Best Practice; and receives research support from the NIH/NINDS, Canadian Institutes for Health Research, Canadian Stroke Network, a the Alberta Heritage Fund for Medical Research, and Hotchkiss Brain Institute.
REFERENCES
- 1. Rost NS, Smith EE, Chang Y, et al. Prediction of functional outcome in patients with primary intracerebral hemorrhage: the FUNC score. Stroke 2008;39:2304–2309 [DOI] [PubMed] [Google Scholar]
- 2. van Asch CJ, Luitse MJ, Rinkel GJ, van der Tweel I, Algra A, Klijn CJ. Incidence, case fatality, and functional outcome of intracerebral haemorrhage over time, according to age, sex, and ethnic origin: a systematic review and meta-analysis. Lancet Neurol 2010;9:167–176 [DOI] [PubMed] [Google Scholar]
- 3. Kazui S, Naritomi H, Yamamoto H, Sawada T, Yamaguchi T. Enlargement of spontaneous intracerebral hemorrhage: incidence and time course. Stroke 1996;27:1783–1787 [DOI] [PubMed] [Google Scholar]
- 4. Davis SM, Broderick J, Hennerici M, et al. , Recombinant Activated Factor VII Intracerebral Hemorrhage Trial Investigators Hematoma growth is a determinant of mortality and poor outcome after intracerebral hemorrhage. Neurology 2006;66:1175–1181 [DOI] [PubMed] [Google Scholar]
- 5. Demchuk AM, Kosior J, Tymchuk S, et al. Multicentre prospective study demonstrates validity of CTA spot sign for hematoma expansion prediction in noncoagulopathic primary ICH patients. Cerebrovasc Dis 2008;25 (suppl 2):52 [Google Scholar]
- 6. Delgado Almandoz JE, Yoo AJ, et al. The spot sign score in primary intracerebral hemorrhage identifies patients at highest risk of in-hospital mortality and poor outcome among survivors. Stroke 2010;41:54–60 [DOI] [PMC free article] [PubMed] [Google Scholar]
- 7. Ederies A, Demchuk A, Chia T, et al. Postcontrast CT extravasation is associated with hematoma expansion in CTA spot negative patients. Stroke 2009;40:1672–1676 [DOI] [PubMed] [Google Scholar]
- 8. Thompson AL, Kosior JC, Gladstone DJ, et al. Defining the CT angiography ‘spot sign’ in primary intracerebral hemorrhage. Can J Neurol Sci 2009;36:456–461 [DOI] [PubMed] [Google Scholar]
- 9. Aviv RI, Gladstone D, Goldstein J, Flaherty M, Broderick J, Demchuk A, Spot Sign for Predicting and Treating ICH Growth and Spot Sign Selection of ICH to Guide Hemostatic Therapy Investigators Contrast extravasation predicts hematoma growth: where to now? AJNR Am J Neuroradiol 2008;29:E80. [DOI] [PMC free article] [PubMed] [Google Scholar]
- 10. Leira R, Dávalos A, Silva Y, et al. Early neurologic deterioration in intracerebral hemorrhage: predictors and associated factors. Neurology 2004;63:461–467 [DOI] [PubMed] [Google Scholar]
- 11. Mayer SA, Brun NC, Begtrup K, et al. Efficacy and safety of recombinant activated factor VII for acute intracerebral hemorrhage. N Engl J Med 2008;358:2127–2137 [DOI] [PubMed] [Google Scholar]
- 12. Mayer SA, Brun NC, Begtrup K, et al. Recombinant activated factor VII for acute intracerebral hemorrhage. N Engl J Med 2005;352:777–785 [DOI] [PubMed] [Google Scholar]
- 13. Anderson CS, Huang Y, Wang JG, et al. Intensive blood pressure reduction in acute cerebral haemorrhage trial (INTERACT): a randomised pilot trial. Lancet Neurol 2008;7:391–399 [DOI] [PubMed] [Google Scholar]
- 14. Fujii Y, Takeuchi S, Sasaki O, Minakawa T, Tanaka R. Multivariate analysis of predictors of hematoma enlargement in spontaneous intracerebral hemorrhage. Stroke 1998;29:1160–1166 [DOI] [PubMed] [Google Scholar]
- 15. Brott T, Broderick J, Kothari R, et al. Early hemorrhage growth in patients with intracerebral hemorrhage. Stroke 1997;28:1–5 [DOI] [PubMed] [Google Scholar]
- 16. Kazui S, Minematsu K, Yamamoto H, Sawada T, Yamaguchi T. Predisposing factors to enlargement of spontaneous intracerebral hematoma. Stroke 1997;28:2370–2375 [DOI] [PubMed] [Google Scholar]
- 17. Hanley DF. An age old question: does size really matter? Stroke 2010;41:199–200 [DOI] [PMC free article] [PubMed] [Google Scholar]
- 18. Ali M, Bath PM, Curram J, et al. The Virtual International Stroke Trials Archive. Stroke 2007;38:1905–1910 [DOI] [PubMed] [Google Scholar]
- 19. Mendelow AD, Gregson BA, Fernandes HM, et al. Early surgery versus initial conservative treatment in patients with spontaneous supratentorial intracerebral haematomas in the International Surgical Trial in Intracerebral Haemorrhage (STICH): a randomised trial. Lancet 2005;365:387–397 [DOI] [PubMed] [Google Scholar]
- 20. Perkins NJ, Schisterman EF. The inconsistency of “optimal” cutpoints obtained using two criteria based on the receiver operating characteristic curve. Am J Epidemiol 2006;163:670–675 [DOI] [PMC free article] [PubMed] [Google Scholar]
- 21. Broderick JP, Diringer MN, Hill MD, et al. Determinants of intracerebral hemorrhage growth: an exploratory analysis. Stroke 2007;38:1072–1075 [DOI] [PubMed] [Google Scholar]
- 22. Delgado Almandoz JE, Yoo AJ, Stone MJ, et al. Systematic characterization of the computed tomography angiography spot sign in primary intracerebral hemorrhage identifies patients at highest risk for hematoma expansion: the spot sign score. Stroke 2009;40:2994–3000 [DOI] [PMC free article] [PubMed] [Google Scholar]
- 23. Chang EF, Meeker M, Holland MC. Acute traumatic intraparenchymal hemorrhage: risk factors for progression in the early post-injury period. Neurosurgery 2006;58:647–656 [DOI] [PubMed] [Google Scholar]
- 24. Broderick JP, Brott TG, Duldner JE, Tomsick T, Huster G. Volume of intracerebral hemorrhage: a powerful and easy-to-use predictor of 30-day mortality. Stroke 1993;24:987–993 [DOI] [PubMed] [Google Scholar]
- 25. Hemphill JC, Bonovich DC, Besmertis L, Manley GT, Johnston SC. The ICH score: a simple, reliable grading scale for intracerebral hemorrhage. Stroke 2001;32:891–897 [DOI] [PubMed] [Google Scholar]
- 26. Kosior JC, Idris S, Dowlatshahi D, et al. Quantomo: validation of a computer-assisted method for volumetric analysis of hematoma in intracerebral and intraventricular hemorrhage. Cerebrovasc Dis 2009;27:S6 [Google Scholar]
- 27. Zahuranec DB, Brown DL, Lisabeth LD, et al. Early care limitations independently predict mortality after intracerebral hemorrhage. Neurology 2007;68:1651–1657 [DOI] [PubMed] [Google Scholar]
- 28. Becker KJ, Baxter AB, Cohen WA, et al. Withdrawal of support in intracerebral hemorrhage may lead to self-fulfilling prophecies. Neurology 2001;56:766–772 [DOI] [PubMed] [Google Scholar]
- 29. Wada R, Aviv RI, Fox AJ, et al. CT angiography “spot sign” predicts hematoma expansion in acute intracerebral hemorrhage. Stroke 2007;38:1257–1262 [DOI] [PubMed] [Google Scholar]
Associated Data
This section collects any data citations, data availability statements, or supplementary materials included in this article.


