Abstract
Purpose
Patients receiving cancer-related thoracotomy are highly symptomatic in the first weeks after surgery. This study examined whether at-home symptom monitoring plus feedback to clinicians about severe symptoms contributes to more effective postoperative symptom control.
Patients and Methods
We enrolled 100 patients receiving thoracotomy for lung cancer or lung metastasis in a two-arm randomized controlled trial; 79 patients completed the study. After hospital discharge, patients rated symptoms twice weekly for 4 weeks via automated telephone calls. For intervention group patients, an e-mail alert was forwarded to the patient's clinical team for response if any of a subset of symptoms (pain, disturbed sleep, distress, shortness of breath, or constipation) reached a predetermined severity threshold. No alerts were generated for controls. Group differences in symptom threshold events were examined by generalized estimating equation modeling.
Results
The intervention group experienced greater reduction in symptom threshold events than did controls (19% v 8%, respectively) and a more rapid decline in symptom threshold events. The difference in average reduction in symptom interference between groups was −0.36 (SE, 0.078; P = .02). Clinicians responded to 84% of e-mail alerts. Both groups reported equally high satisfaction with the automated system and with postoperative symptom control.
Conclusion
Frequent symptom monitoring with alerts to clinicians when symptoms became moderate or severe reduced symptom severity during the 4 weeks after thoracic surgery. Methods of automated symptom monitoring and triage may improve symptom control after major cancer surgery. These results should be confirmed in a larger study.
INTRODUCTION
Thoracotomy for lung cancer or lung metastases produces considerable physical trauma. For the first few weeks after discharge, thoracotomy patients frequently report multiple severe symptoms, including pain, disrupted sleep, constipation, emotional distress, and shortness of breath. If not controlled, these symptoms can cause substantial distress, inhibit postoperative recovery, and lead to unscheduled care.1,2
Calling patients to monitor symptoms between clinic visits has been shown to be effective in reducing symptoms3; however, the cost of clinician time for personal patient calls is prohibitive. Information technology can be used to automatically monitor symptoms and provide feedback to clinicians when patients become symptomatic. Web-based applications are one way to gather symptom information, but using the telephone may be more practical, especially for older patients who are not computer literate.
Using the telephone keypad, patients can respond to symptom questions delivered by a central server to their home or cell telephone. These patient-reported symptom data are then transferred to a statistical data management system. Such interactive voice response (IVR) systems have been used to monitor symptoms related to psychiatric disease,4–7 chemotherapy,8–10 or stem-cell transplantation.11,12
Even with an automated symptom assessment system, the demands on staff time to review the symptom reports from all patients would be considerable. IVR systems can be programmed to triage symptom information, alerting clinicians only when symptom severity surpasses a pre-established threshold.
We conducted a two-arm randomized controlled trial of an IVR triage alert system in patients who underwent thoracotomy for primary lung cancer or lung metastasis. Although we expected all patients to show a reduction in symptoms as they recovered from surgery, we hypothesized that patients receiving automated symptom monitoring via IVR coupled with e-mail feedback to clinicians about moderate to severe symptoms (the intervention group) would have better postoperative symptom control than would patients receiving only automated monitoring and usual symptom care (the control group). The study was conducted during the first 4 weeks after thoracotomy. Our primary research question was as follows: Are patients in the intervention group less likely to have symptoms that meet or exceed a predetermined severity threshold over time than patients in the control group? A secondary analysis examined group differences in reported symptom interference, acceptability of the IVR symptom assessment system, and satisfaction with symptom control.
PATIENTS AND METHODS
Patients
We recruited men and women scheduled for thoracic surgery for primary lung cancer or lung metastases at The University of Texas MD Anderson Cancer Center in Houston, Texas. Eligible patients were at least 18 years old, able to understand English and the study requirements, and willing and able to respond to a repeated IVR-administered symptom rating scale. For a patient to be accepted into the study, his or her surgical clinician had to be willing to receive e-mail alerts about moderate to severe symptoms for patients in the intervention group, to consult with these patients by phone about alerted symptoms, and to inform study staff about actions taken in response to the alert.
The study was approved by the Institutional Review Board of MD Anderson Cancer Center. All participants gave informed consent.
Study Design
Assessment measures.
Symptoms were assessed using the M. D. Anderson Symptom Inventory (MDASI),13 a brief, validated measure of 13 common cancer-related symptoms over the previous 24 hours. Each symptom is rated on an 11-point scale, with 0 being “not present” and 10 being “as bad as you can imagine.” Constipation was added for this study. Patients also rate how much their symptoms interfered in the previous 24 hours with six common functional domains, including walking, work, general activity, mood, enjoyment of life, and relations with others. Symptom interference is the average of these six items. Interference items are also rated on 11-point scales, with 0 being “did not interfere” and 10 being “interfered completely.” We also collected demographic information and clinically relevant variables, including Eastern Cooperative Oncology Group performance status at study entry.14
Setting symptom alert thresholds for the intervention arm.
The intervention involved the use of IVR-generated alerts to inform a patient's treatment team whenever one or more of five targeted symptoms met or exceeded a preset severity threshold. Symptoms and severity thresholds were chosen in consultation with the thoracic surgery staff.
The five targeted symptoms were selected from among postoperative symptoms reported in a longitudinal IVR study of patients with lung cancer after thoracic surgery.15 Four of the most severe symptoms from that study—pain, distress, disturbed sleep, and shortness of breath—were considered by the thoracic surgery clinicians to be symptoms that could be responded to clinically in a telephone consultation; thus, these four symptoms were selected to trigger threshold alerts in the current study. Although fatigue was the most severe postoperative symptom in the previous study,15 we did not target it here because it was considered too difficult to manage by phone. Constipation was added to the list of targeted symptoms because it is frequently a concern after surgery.
The thoracic clinical team also participated in determining the severity thresholds for each targeted symptom. On the basis of hospital pain management guidelines and previous research examining the impact of pain severity,16 clinicians set the thresholds at 5 (on the 0 to 10 scale) for moderate pain, distress, and disturbed sleep and at 3 for moderate shortness of breath and constipation. When any of these symptoms met or exceeded its threshold, a symptom threshold event was logged. For a given IVR assessment, a patient could generate zero or as many as five symptom threshold events.
Procedures.
Enrolled patients were randomly assigned to either the intervention or control group before surgery. Random assignment was completed electronically by MD Anderson's protocol management system. Presurgical symptoms were assessed via MDASI, and demographic and clinical variables were recorded. Patients in both groups were given a demonstration of the IVR system and rehearsed using the system until they were comfortable with it. Patients were given options about which days of the week to receive IVR calls and also specified their preferred time of day for the call.
Immediately before discharge from the hospital (approximately 5 days after surgery), patients completed a paper-and-pencil version of the MDASI, and discharge symptom management orders were recorded (time point 0 [T0]). After discharge, patients were called by the IVR system approximately twice a week for 4 weeks, for a total of seven additional time points (T1 through T7). All MDASI items were rated at each time point.
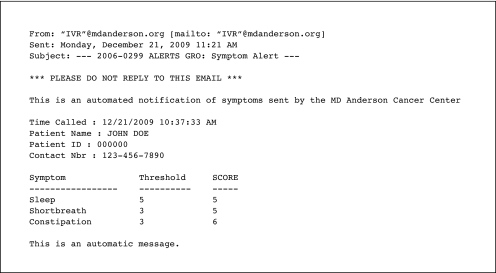
For each patient in the intervention group, the IVR screened the five targeted symptoms. On the occurrence of one or more symptom threshold events for a patient, the IVR system immediately generated an e-mail alert to the surgical team's advanced practice nurse (APN). The e-mail provided the patient's name, phone number(s), and case history number, along with the severity of each symptom that had generated a symptom threshold event. The APN was asked to reply to the e-mail to indicate if and when the patient was contacted in response to the alert and to specify actions taken (eg, educated or counseled patient, changed prescription, scheduled a visit).
Patients in the control group also received IVR calls but were informed that IVR data would be used for research purposes only and would not be provided to their clinicians. All patients were instructed to report to their treating team if symptoms became severe or to seek emergency help.
If a participant missed a scheduled call, the IVR system initiated up to two more calls, spaced 45 minutes apart. If no calls were answered on a given day, research staff initiated a call the same day or the next working day and verbally administered the MDASI to the participant. If a patient in the intervention group had one or more symptom threshold events, the staff member initiated an alert e-mail to the patient's surgical team.
The final assessment occurred at the first follow-up clinic visit, usually 4 to 6 weeks after discharge. Research staff administered a paper-and-pencil version of the MDASI, and participants completed a set of questions about their impressions of the IVR system, their perception of the relevance of the system to their symptom management, and their satisfaction with postoperative symptom control.
Statistical Analysis: Sample Size Calculation
Based on data from the previous postoperative IVR study,15 we calculated that 59 patients per arm would be needed to detect a medium effect size difference in postoperative symptom severity between groups, using a two-tailed α = .05 and 80% power.
Primary Analyses
Group differences in the number of symptom threshold events.
Incorporating the longitudinal nature of our data, we used a log-linear generalized estimating equation model to address the main research question of whether or not the intervention (automated symptom monitoring with e-mail alerts) would reduce the total number of symptom threshold events for all five targeted symptoms during the first 4 weeks after discharge from thoracic surgery. The total number of symptom threshold events was modeled as a Poisson random variable, using a log link function and a Poisson variance function.17
Cumulative distribution of symptom threshold events.
We plotted the cumulative distribution of symptom threshold events for the intervention and control groups for all targeted symptoms to graphically illustrate differences between groups in the number of symptom threshold events over time.
Differences in mean symptom severity between discharge and follow-up.
Using paired t tests, we examined whether the combined groups (intervention and control) and each group separately differed in change scores between discharge and follow-up visit on the mean severity of the five targeted symptoms.
Secondary Analyses
Group differences in mean symptom interference.
The mean score of the six MDASI interference items was computed as an indicator of symptom impact. We used a linear mixed model to test whether mean symptom interference scores differed significantly over time between the intervention and control groups. The explanatory variables in all models were time and the interactive effect of group and time, adjusted for age and sex.17 Age and sex were included in the model as potential confounding factors.
Group differences in patient satisfaction.
Independent sample t tests were used to compare groups on secondary outcome variables, including patient satisfaction with symptom treatment, responsiveness of clinic, and patient assessment of the IVR system.
RESULTS
Patient Characteristics
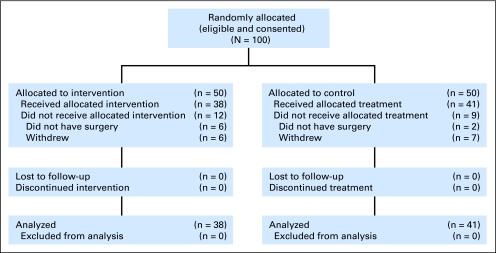
Of the patients approached to participate in the study, 100 were eligible and agreed to be enrolled. We were unable to meet the specified 59 patients per arm required in the original design as a result of termination of funding for the trial. Participants were randomly assigned into two groups of 50 patients each; an evaluation of presurgical data indicated that the groups were equivalent in terms of MDASI symptoms and Eastern Cooperative Oncology Group performance status. By the time of the first assessment at hospital discharge, 38 patients remained in the intervention group and 41 patients remained in the control group, for a total of 79 patients (Fig 1). Reasons for attrition included change in treatment plan that excluded surgery (n = 8) and voluntary withdrawal from the study after consent (n = 13). All 79 patients completed the 4-week trial.
Fig 1.
CONSORT diagram.
Demographic and clinical characteristics of the 79 participants are listed by random assignment group in Table 1. No significant differences in demographic characteristics and disease or treatment factors were found between groups. Approximately half of each group had stage IV cancer with lung metastases from a variety of primary sites; 21% of the intervention group and 29% of the control group had early (stage I) non–small-cell lung cancer. Few patients in either group were receiving preoperative medical management for pain and other symptoms. At discharge, there was no significant difference between groups in the numbers of patients prescribed opioid pain medications, laxatives, or other symptom management drugs.
Table 1.
Patient Demographics and Clinical Characteristics by Group
| Demographic or Clinical Characteristic | Intervention Group (n = 38) |
Control Group (n = 41) |
P | ||
|---|---|---|---|---|---|
| No. of Patients | % | No. of Patients | % | ||
| Age, years | |||||
| Mean | 59.2 | 60.9 | .491 | ||
| SD | 13.6 | 11.8 | |||
| < 60 | 15 | 39.5 | 13 | 31.7 | .491 |
| ≥ 60 | 23 | 60.5 | 28 | 68.3 | |
| Sex | .822 | ||||
| Male | 21 | 55.3 | 21 | 51.2 | |
| Female | 17 | 44.7 | 20 | 48.8 | |
| Marital status | .758 | ||||
| Married | 33 | 86.8 | 34 | 82.9 | |
| Unmarried | 5 | 13.2 | 7 | 17.1 | |
| Race | .361 | ||||
| White non-Hispanic | 32 | 88.9 | 33 | 80.5 | |
| Other | 4 | 11.1 | 8 | 19.5 | |
| Education level | < .99 | ||||
| < Grade 12 | 1 | 2.6 | 2 | 4.9 | |
| ≥ Grade 12 | 37 | 97.4 | 39 | 95.1 | |
| Job status | .950 | ||||
| Employed outside the home | 13 | 34.2 | 14 | 34.1 | |
| Homemaker | 1 | 2.6 | 4 | 9.8 | |
| Retired | 18 | 47.4 | 17 | 41.5 | |
| Medical leave/unemployed/other | 6 | 16.0 | 6 | 16.0 | |
| Ever smoker | 25 | 65.8 | 27 | 65.9 | |
| ECOG PS score at enrollment | < .99 | ||||
| 0 | 20 | 54.1 | 22 | 53.7 | |
| 1-2 | 17 | 45.9 | 19 | 46.3 | |
| Received preoperative chemotherapy | 8 | 21.6 | 8 | 19.5 | < .99 |
| Disease status | .262 | ||||
| Local | 14 | 37.8 | 21 | 51.2 | |
| Metastatic | 23 | 62.2 | 20 | 48.8 | |
| Preoperative disease stage | .279 | ||||
| I | 7 | 20.6 | 10 | 28.6 | |
| II | 2 | 5.9 | 5 | 14.3 | |
| III | 8 | 23.5 | 3 | 8.6 | |
| IV | 17 | 50.0 | 17 | 48.6 | |
| Primary cancer diagnosis | .655 | ||||
| Colon/rectum | 5 | 13.2 | 6 | 14.6 | |
| Esophagus | 1 | 2.6 | 0 | 0.0 | |
| Uterus | 0 | 0.0 | 1 | 2.4 | |
| Kidney | 2 | 5.3 | 2 | 4.9 | |
| Head and neck | 0 | 0.0 | 2 | 4.9 | |
| Lung: small cell | 0 | 0.0 | 2 | 4.8 | |
| Lung: non–small cell | 16 | 42.1 | 20 | 48.8 | |
| Melanoma | 3 | 7.9 | 2 | 4.9 | |
| Sarcoma | 10 | 26.3 | 6 | 14.6 | |
| Other | 1 | 2.6 | 0 | 0.0 | |
Abbreviations: SD, standard deviation; ECOG PS, Eastern Cooperative Oncology Group performance status.
Symptom Intervention Report
During the trial, criteria for alert generation was met 58 times for the intervention group and 77 times for the control group. Over the course of the trial, 33 patients in the intervention group generated an alert; 36 patients in the control group would have generated an alert based on the prespecified threshold.
Each alert may have represented more than one symptom threshold event for that patient (Fig 2). The IVR detected 100% of the symptom threshold events and made all required alerts to surgical care APNs. APNs acknowledged 49 (84%) of 58 alerts via e-mail reply to the research team, and a phone consultation was made in response to 35 alerts (60%). For the nine alerts with no APN action report, seven symptom threshold events were for shortness of breath, two events were for pain, and one event was for constipation. Most of the intervention calls reinforced the patient's prescribed symptom management or provided education. New medications were prescribed five times (15%). For the 14 alerts for which no call was made, six were because the symptom had already been discussed with the patient before the call and two were because the patient could not be reached; in six instances, no reason was given for not completing the call.
Fig 2.
Sample e-mail alert.
Primary Analyses
Group differences in the number of symptom threshold events.
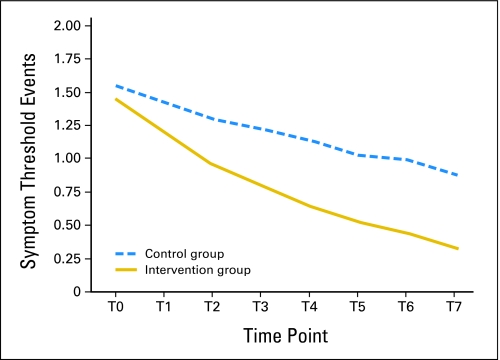
We compared the number of symptom threshold events during the 4-week intervention period between the intervention and control groups by longitudinal analysis. Controlling for age and sex, the log-linear generalized estimating equation model found that both groups showed significant reduction in the number of symptom threshold events over time, with an average reduction of 19% in the intervention group and 8% in the control group (Fig 3). In addition, the slope of reduction was significantly steeper in the intervention group than in the control group (P = .003). The rate ratio for the difference was 0.88 (95% CI, 0.78 to 0.98), indicating that the number of symptom threshold events was approximately 12% less in the intervention group than in the control group.
Fig 3.
Mean symptom threshold events per patient.
Cumulative distribution of symptom threshold events.
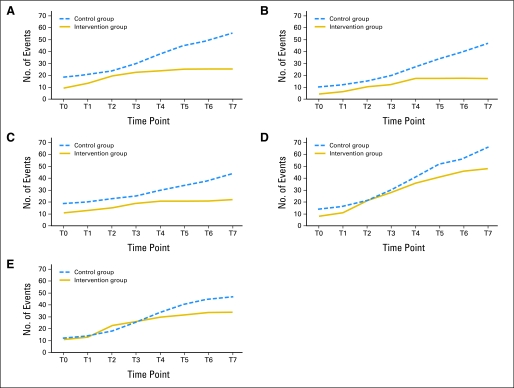
Figure 4 presents the cumulative distribution of symptom threshold events for the five targeted symptoms. For each of the symptoms, the control group had more symptom threshold events than the intervention group at the end of the study period. For example, at the end of 4 weeks, symptom threshold events for pain totaled 56 for the control group and 28 for the intervention group.
Fig 4.
Cumulative number of symptom threshold events for the five targeted symptoms, which included (A) pain, (B) distress, (C) disturbed sleep, (D) shortness of breath, and (E) constipation. For each of the five targeted symptoms, at the end of the study period, the control group had a greater number of symptom threshold events than the intervention group. These graphs depict the number of symptom threshold events per symptom as they accumulated during the study period.
Differences in mean symptom severity between discharge and follow-up.
We examined the magnitude of symptom reduction from discharge to follow-up for both groups together and for each treatment group. As expected, a dramatic reduction in symptom severity was found between the time points in the postoperative period. For both groups together, the effect size of reduction in symptom severity was 0.72, with an effect size of 0.68 in the control group and 0.75 in the intervention group. The difference in change scores between the intervention and control groups was not significant.
Secondary Analyses
Group differences in mean symptom interference.
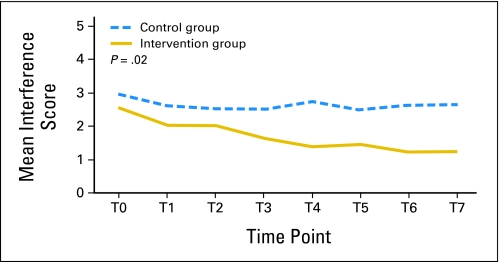
Figure 5 presents the significant effect of reduction in overall symptom interference in the intervention group compared with the control group during the 4-week intervention. The mixed model found that the interference score in the control group did not significantly decrease, whereas, on average, symptom interference in the intervention group showed a 0.46-unit decrease (on the 0 to 10 scale) each week. The difference in average reduction of overall interference between the two groups over time was 0.36 on the 0 to 10 scale, adjusted for age and sex (estimate, −0.36; SE, 0.078; P = .02).
Fig 5.
Mean symptom interference from discharge to follow-up by group.
Group differences in patient satisfaction.
Patients in the intervention group were significantly more comfortable with the IVR system than were patients in the control group (score, 9.4 v 8.4, respectively; P < .03) and were more likely to rate the system as easy to use (score, 9.7 v 8.8, respectively; P < .01). Patients in both groups rated their satisfaction with the system and their symptom management as high and felt that the system should be used in routine postoperative care (scores of 8 or 9 on a 0 to 10 scale).
DISCUSSION
This study examined whether providing e-mail alerts to clinicians would improve symptom control compared with automated symptom monitoring alone, which may itself reduce symptoms.18 As expected, both the intervention and control groups demonstrated significant reduction in symptom severity and symptom interference between hospital discharge and follow-up. However, the intervention group demonstrated a number of benefits compared with the control group, including significantly fewer symptom threshold events during the 4-week intervention period, a significantly more rapid decline in symptom threshold events during the intervention period, and a significantly lower level of symptom interference during the intervention period, suggesting that postoperative functioning may also have been better in the intervention group than in the control group.
Patients in both study arms found the symptom monitoring system easy to use. Those in the intervention group were significantly more comfortable using the system, possibly reflecting their knowledge that their symptoms were being monitored. Both groups supported the value of the system in their postoperative care. The system used in this study was not technologically difficult to implement. In a busy practice, 84% of the alerts for the intervention group were acknowledged by treating clinicians within 24 hours, and 60% of the alerts generated a call to patients. A small percentage of the calls (15%) resulted in a medication change, but most of the calls educated the patient about symptom control or reinforced the use of prescribed medications.
In several recent studies, symptom monitoring alone, without threshold alerts to clinicians, has been shown to provide a symptom benefit.19–21 A limitation to this study was that no nonmonitored, usual care group was included. Additional limitations reduce the generalizability of this study and suggest arenas for future research. First, this was a small study that needs confirmation in a larger study. Second, the study was performed in a well-resourced tertiary cancer center that emphasizes symptom control. The benefit of symptom monitoring and alerts or of automated symptom monitoring alone might have been greater in a care setting with fewer resources or where postoperative symptom management receives a lower priority.
In conclusion, a system that frequently monitored postoperative symptoms and informed clinicians when symptoms became severe led to lower symptom severity and less symptom interference. Such automated approaches provide an excellent opportunity to use information systems to enhance the efficiency and efficacy of symptom management.
Acknowledgment
We acknowledge Jeanie F. Woodruff, ELS, for editorial assistance; Marilyn Morrissey, MPH, for protocol management; and Arlene M. Correa, PhD, for data management.
Footnotes
Supported by Grant No. RSGPB-03-244-01-BBP from the American Cancer Society, Atlanta, GA, and Grant No. R01 CA026582 from the National Cancer Institute, Bethesda, MD.
Presented in part at the 44th Annual Meeting of the American Society of Clinical Oncology, May 30-June 3, 2008, Chicago, IL.
The content of this article is solely the responsibility of the authors and does not necessarily represent the official views of the National Cancer Institute or the National Institutes of Health.
Authors' disclosures of potential conflicts of interest and author contributions are found at the end of this article.
Clinical trial information can be found for the following: NCT00423436.
AUTHORS' DISCLOSURES OF POTENTIAL CONFLICTS OF INTEREST
The author(s) indicated no potential conflicts of interest.
AUTHOR CONTRIBUTIONS
Conception and design: Charles S. Cleeland, Xin Shelley Wang, Joe B. Putnam Jr, Ara A. Vaporciyan
Financial support: Charles S. Cleeland, Joe B. Putnam Jr
Administrative support: Charles S. Cleeland, Sherry L. Wright, Madonna D. Berry
Provision of study materials or patients: Xin Shelley Wang,Ibrahima Gning, Ara A. Vaporciyan
Collection and assembly of data: Sherry L. Wright, Madonna D. Berry, Donna Malveaux, Pankil K. Shah, Ibrahima Gning, Wayne L. Hofstetter, Ara A. Vaporciyan
Data analysis and interpretation: Charles S. Cleeland, Xin Shelley Wang, Qiuling Shi, Tito R. Mendoza, Pankil K. Shah, Ibrahima Gning, Wayne L. Hofstetter, Ara A. Vaporciyan
Manuscript writing: Charles S. Cleeland, Xin Shelley Wang, Qiuling Shi, Tito R. Mendoza, Ara A. Vaporciyan
Final approval of manuscript: Charles S. Cleeland, Xin Shelley Wang, Qiuling Shi, Tito R. Mendoza, Sherry L. Wright, Madonna D. Berry, Donna Malveaux, Pankil K. Shah, Ibrahima Gning, Wayne L. Hofstetter, Joe B. Putnam Jr, Ara A. Vaporciyan
REFERENCES
- 1.Kalso E, Mennander S, Tasmuth T, et al. Chronic post-sternotomy pain. Acta Anaesthesiol Scand. 2001;45:935–939. doi: 10.1034/j.1399-6576.2001.450803.x. [DOI] [PubMed] [Google Scholar]
- 2.Tasmuth T, von Smitten K, Kalso E. Pain and other symptoms during the first year after radical and conservative surgery for breast cancer. Br J Cancer. 1996;74:2024–2031. doi: 10.1038/bjc.1996.671. [DOI] [PMC free article] [PubMed] [Google Scholar]
- 3.Kornblith AB, Dowell JM, Herndon JE, 2nd, et al. Telephone monitoring of distress in patients aged 65 years or older with advanced stage cancer: A Cancer and Leukemia Group B study. Cancer. 2006;107:2706–2714. doi: 10.1002/cncr.22296. [DOI] [PubMed] [Google Scholar]
- 4.Greist JH, Marks IM, Baer L, et al. Behavior therapy for obsessive-compulsive disorder guided by a computer or by a clinician compared with relaxation as a control. J Clin Psychiatry. 2002;63:138–145. doi: 10.4088/jcp.v63n0209. [DOI] [PubMed] [Google Scholar]
- 5.Mundt JC, Clarke GN, Burroughs D, et al. Effectiveness of antidepressant pharmacotherapy: The impact of medication compliance and patient education. Depress Anxiety. 2001;13:1–10. doi: 10.1002/1520-6394(2001)13:1<1::aid-da1>3.0.co;2-s. [DOI] [PubMed] [Google Scholar]
- 6.Searles JS, Helzer JE, Walter DE. Comparison of drinking patterns measured by daily reports and timeline follow back. Psychol Addict Behav. 2000;14:277–286. doi: 10.1037//0893-164x.14.3.277. [DOI] [PubMed] [Google Scholar]
- 7.Marshall BJ, Hoffman SR, Babadzhov V, et al. The Automatic Patient Symptom Monitor (APSM): A voice mail system for clinical research. Proc Annu Symp Comput Appl Med Care. 1993:32–36. [PMC free article] [PubMed] [Google Scholar]
- 8.Weaver A, Young AM, Rowntree J, et al. Application of mobile phone technology for managing chemotherapy-associated side-effects. Ann Oncol. 2007;18:1887–1892. doi: 10.1093/annonc/mdm354. [DOI] [PubMed] [Google Scholar]
- 9.Carpenter JS, Rawl S, Porter J, et al. Oncology outpatient and provider responses to a computerized symptom assessment system. Oncol Nurs Forum. 2008;35:661–669. doi: 10.1188/08/ONF.661-669. [DOI] [PMC free article] [PubMed] [Google Scholar]
- 10.Mooney KH, Beck SL, Friedman RH, et al. Telephone-linked care for cancer symptom monitoring: A pilot study. Cancer Pract. 2002;10:147–154. doi: 10.1046/j.1523-5394.2002.103006.x. [DOI] [PubMed] [Google Scholar]
- 11.Bush N, Donaldson G, Moinpour C, et al. Development, feasibility and compliance of a web-based system for very frequent QOL and symptom home self-assessment after hematopoietic stem cell transplantation. Qual Life Res. 2005;14:77–93. doi: 10.1007/s11136-004-2394-2. [DOI] [PubMed] [Google Scholar]
- 12.Campagnaro E, Saliba R, Giralt S, et al. Symptom burden after autologous stem cell transplantation for multiple myeloma. Cancer. 2008;112:1617–1624. doi: 10.1002/cncr.23299. [DOI] [PubMed] [Google Scholar]
- 13.Cleeland CS, Mendoza TR, Wang XS, et al. Assessing symptom distress in cancer patients: The M. D. Anderson Symptom Inventory. Cancer. 2000;89:1634–1646. doi: 10.1002/1097-0142(20001001)89:7<1634::aid-cncr29>3.0.co;2-v. [DOI] [PubMed] [Google Scholar]
- 14.Oken MM, Creech RH, Tormey DC, et al. Toxicity and response criteria of the Eastern Cooperative Oncology Group. Am J Clin Oncol. 1982;5:649–655. [PubMed] [Google Scholar]
- 15.Vaporciyan A, Wang XS, Bashkar S, et al. A novel system for measuring longitudinal postoperative symptom burden: Proof of concept comparing VATS versus open lobectomy. Innovations. 2008;3:63. abstr 13. [Google Scholar]
- 16.Serlin RC, Mendoza TR, Nakamura Y, et al. When is cancer pain mild, moderate or severe? Grading pain severity by its interference with function. Pain. 1995;61:277–284. doi: 10.1016/0304-3959(94)00178-H. [DOI] [PubMed] [Google Scholar]
- 17.Fitzmaurice GM, Laird NM, Ware JH. Applied Longitudinal Analysis. Hoboken, NJ: Wiley-Interscience; 2004. [Google Scholar]
- 18.Hoekstra J, de Vos R, van Duijn NP, et al. Using the symptom monitor in a randomized controlled trial: The effect on symptom prevalence and severity. J Pain Symptom Manage. 2006;31:22–30. doi: 10.1016/j.jpainsymman.2005.06.014. [DOI] [PubMed] [Google Scholar]
- 19.Given CW, Sikorskii A, Tamkus D, et al. Managing symptoms among patients with breast cancer during chemotherapy: Results of a two-arm behavioral trial. J Clin Oncol. 2008;26:5855–5862. doi: 10.1200/JCO.2008.16.8872. [DOI] [PMC free article] [PubMed] [Google Scholar]
- 20.Velikova G, Booth L, Smith AB, et al. Measuring quality of life in routine oncology practice improves communication and patient well-being: A randomized controlled trial. J Clin Oncol. 2004;22:714–724. doi: 10.1200/JCO.2004.06.078. [DOI] [PubMed] [Google Scholar]
- 21.Basch E, Artz D, Dulko D, et al. Patient online self-reporting of toxicity symptoms during chemotherapy. J Clin Oncol. 2005;23:3552–3561. doi: 10.1200/JCO.2005.04.275. [DOI] [PubMed] [Google Scholar]


